Estimated median house/condo value in 2022: $403,583
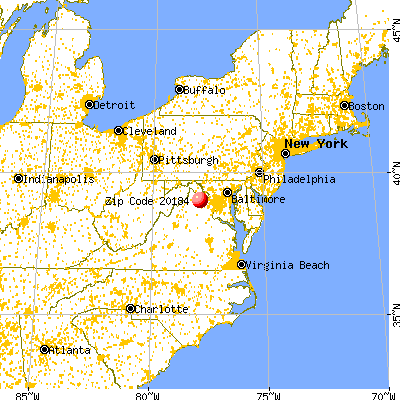
20184:
$403,583
Virginia:
$365,700
According to our research of Virginia and other state lists, there was 1 registered sex offender living in 20184 zip code as of June 08, 2024. The ratio of all residents to sex offenders in zip code 20184 is 644 to 1. The ratio of registered sex offenders to all residents in this zip code is lower than the state average.
Median resident age:
This zip code:
46.5 years
Virginia median age:
39.0 years
Average household size:
This zip code:
1.8 people
Virginia:
2.5 people
Averages for the 2020 tax year for zip code 20184, filed in 2021:
Average Adjusted Gross Income (AGI) in 2020: $256,150 (Individual Income Tax Returns)
Here:
$256,150
State:
$86,446
Salary/wage: $98,544 (reported on 75.0% of returns)
Here:
$98,544
State:
$71,185
(% of AGI for various income ranges: 1072.5% for AGIs below $25k, 4437.5% for AGIs $25k-50k, 7900.0% for AGIs $50k-75k, 13730.0% for AGIs $100k-200k)
Taxable interest for individuals: $2,538 (reported on 33.3% of returns)
This zip code:
$2,538
Virginia:
$1,805
(% of AGI for various income ranges: 43.3% for AGIs $50k-75k)
Ordinary dividends: $56,557 (reported on 29.2% of returns)
Here:
$56,557
State:
$8,327
(% of AGI for various income ranges: 1210.0% for AGIs $50k-75k)
Net capital gain/loss in AGI: +$50,857 (reported on 29.2% of returns)
Here:
+$50,857
State:
+$24,644
(% of AGI for various income ranges: 1156.7% for AGIs $50k-75k)
Profit/loss from business: +$11,417 (reported on 25.0% of returns)
Here:
+$11,417
State:
+$12,836
(% of AGI for various income ranges: 1292.5% for AGIs below $25k, 560.0% for AGIs $50k-75k)
Total itemized deductions: $58,225 (reported on 16.7% of returns)
Here:
$58,225
State:
$33,287
(% of AGI for various income ranges: )
Charity contributions: $20,975 (reported on 16.7% of returns)
Here:
$20,975
State:
$10,381
(% of AGI for various income ranges: )
Taxes paid: $7,840 (reported on 20.8% of returns)
20184:
$7,840
State:
$8,284
(% of AGI for various income ranges: )
Percentage of individuals using paid preparers for their 2020 taxes: 87.5%
Here:
88%
State:
92%
(% for various income ranges: 83.3% for AGIs below $25k, 83.3% for AGIs $25k-50k, 80.0% for AGIs $50k-75k, 100.0% for AGIs $100k-200k, 100.0% for AGIs over 200k)
Averages for the 2012 tax year for zip code 20184, filed in 2013:
Average Adjusted Gross Income (AGI) in 2012: $191,938 (Individual Income Tax Returns)
Here:
$191,938
State:
$71,192
Salary/wage: $119,344 (reported on 75.0% of returns)
Here:
$119,344
State:
$59,229
(% of AGI for various income ranges: 69.9% for AGIs below $25k, 83.5% for AGIs $25k-50k, 72.8% for AGIs $50k-75k, 71.8% for AGIs $100k-200k, 39.7% for AGIs over 200k)
Taxable interest for individuals: $16,280 (reported on 41.7% of returns)
This zip code:
$16,280
Virginia:
$1,600
(% of AGI for various income ranges: 1.2% for AGIs below $25k, 1.3% for AGIs $50k-75k, 4.3% for AGIs over 200k)
Ordinary dividends: $57,629 (reported on 29.2% of returns)
Here:
$57,629
State:
$6,959
(% of AGI for various income ranges: 3.7% for AGIs below $25k, 3.9% for AGIs $50k-75k, 10.6% for AGIs over 200k)
Net capital gain/loss in AGI: +$136,467 (reported on 25.0% of returns)
Here:
+$136,467
State:
+$16,672
Profit/loss from business: +$11,075 (reported on 16.7% of returns)
Here:
+$11,075
State:
+$14,116
Total itemized deductions: $73,362 (15% of AGI, reported on 33.3% of returns)
Here:
$73,362
State:
$26,596
Here:
14.6% of AGI
State:
20.1% of AGI
Charity contributions: $13,650 (reported on 25.0% of returns)
Here:
$13,650
State:
$4,443
Taxes paid: $37,500 (reported on 33.3% of returns)
20184:
$37,500
State:
$9,951
Earned income credit: $1,867 (reported on 12.5% of returns)
Here:
$1,867
State:
$2,211
(% of AGI for various income ranges: 6.3% for AGIs below $25k)
Percentage of individuals using paid preparers for their 2012 taxes: 54.2%
Here:
54%
State:
46%
(% for various income ranges: 37.5% for AGIs below $25k, 60.0% for AGIs $25k-50k, 100.0% for AGIs $50k-75k, 75.0% for AGIs over 200k)
Averages for the 2004 tax year for zip code 20184, filed in 2005:
Average Adjusted Gross Income (AGI) in 2004: $118,440 (Individual Income Tax Returns)
Here:
$118,440
State:
$56,704
Salary/wage: $94,724 (reported on 76.6% of returns)
Here:
$94,724
State:
$48,441
(% of AGI for various income ranges: 381.0% for AGIs below $10k, 81.7% for AGIs $10k-25k, 81.4% for AGIs $25k-50k, 86.0% for AGIs $50k-75k, 73.9% for AGIs $75k-100k, 55.3% for AGIs over 100k)
Taxable interest for individuals: $5,465 (reported on 56.6% of returns)
This zip code:
$5,465
Virginia:
$1,688
(% of AGI for various income ranges: 33.3% for AGIs below $10k, 6.7% for AGIs $25k-50k, 0.6% for AGIs $50k-75k, 0.2% for AGIs $75k-100k, 2.6% for AGIs over 100k)
Taxable dividends: $37,986 (reported on 42.3% of returns)
Here:
$37,986
State:
$4,028
(% of AGI for various income ranges: 123.8% for AGIs below $10k, 2.9% for AGIs $25k-50k, 0.9% for AGIs $50k-75k, 16.9% for AGIs over 100k)
Net capital gain/loss: +$17,103 (reported on 33.1% of returns)
Here:
+$17,103
State:
+$14,375
(% of AGI for various income ranges: -19.0% for AGIs below $10k, 0.7% for AGIs $50k-75k, 6.1% for AGIs over 100k)
Total itemized deductions: $45,162 (18% of AGI, reported on 38.9% of returns)
Here:
$45,162
State:
$21,492
Here:
17.5% of AGI
State:
21.0% of AGI
(% of AGI for various income ranges: 37.3% for AGIs $10k-25k, 24.7% for AGIs $50k-75k, 15.8% for AGIs over 100k)
Charity contributions deductions: $10,362 (4% of AGI, reported on 33.1% of returns)
Here:
$10,362
State:
$3,794
Here:
3.7% of AGI
State:
3.5% of AGI
Total tax: $28,160 (reported on 82.3% of returns)
20184:
$28,160
State:
$9,537
(% of AGI for various income ranges: 14.3% for AGIs below $10k, 4.7% for AGIs $10k-25k, 8.7% for AGIs $25k-50k, 10.0% for AGIs $50k-75k, 8.6% for AGIs $75k-100k, 22.6% for AGIs over 100k)
Earned income credit: $1,462 (reported on 7.4% of returns)
Here:
$1,462
State:
$1,734
Percentage of individuals using paid preparers for their 2004 taxes: 64.0%
Here:
64%
State:
52%
(% for various income ranges: 57.6% for AGIs below $10k, 46.2% for AGIs $10k-25k, 63.4% for AGIs $25k-50k, 95.5% for AGIs $50k-75k, 87.2% for AGIs over 100k)
Notable locations in zip code 20184: Willisville Crossroads (A), Powells Corner (B), Dunbars Corner (C), Ayreshire Farm (D), Green Gardens (E), Oakley (F), Upperville Volunteer Fire Company 5 (G). Display/hide their locations on the map
Size of family households: 115 2-persons, 13 6-persons
Size of nonfamily households: 116 1-person
60 married couples with children.
0 single-parent households ().
49.9% of residents of 20184 zip code speak English at home.
51.2% of residents speak Spanish at home (74% very well, 26% well).
Foreign born population: 133 (30.0%) (56.5% of them are naturalized citizens)
This zip code:
30.0%
Whole state:
12.7%
93%Honduras
7%European
4%British
Year of entry for the foreign-born population
702010 or later
02000 to 2009
671990 to 1999
0Before 1990
Housing units lacking complete kitchen facilities: 7.5%
82.8%Electricity
17.4%Fuel oil, kerosene, etc.
Place of birth for U.S.-born residents:
This state: 205
South: 26
West: 83
59% of the 20184 zip code residents lived in the same house 5 years ago. Out of people who lived in different houses, 52% lived in this county. Out of people who lived in different counties, 50% lived in Virginia.
101% of the 20184 zip code residents lived in the same house 1 year ago.
Private vs. public school enrollment:
Students in private schools in grades 1 to 8 (elementary and middle school):
Here:
0.0%
Virginia:
13.2%
Students in private schools in grades 9 to 12 (high school):
Here:
0.0%
Virginia:
10.2%
Top industries in this zip code by the number of employees in 2005:
Construction: Water and Sewer Line and Related Structures Construction (20-49 employees: 1 establishment)
Construction: Masonry Contractors (10-19: 1)
Accommodation and Food Services: Limited-Service Restaurants (10-19: 1)
Arts, Entertainment, and Recreation: Other Spectator Sports (10-19: 1)
Construction: New Single-Family Housing Construction (except Operative Builders) (5-9: 1, 1-4: 1)
Educational Services: Sports and Recreation Instruction (5-9: 1, 1-4: 1)
Accommodation and Food Services: Bed-and-Breakfast Inns (5-9: 1)
Professional, Scientific, and Technical Services: Administrative Management and General Management Consulting Services (5-9: 1)
Home Mortgage Disclosure Act Aggregated Statistics For Year 2009 (Based on 4 partial tracts)
A) FHA, FSA/RHS & VA Home Purchase Loans
B) Conventional Home Purchase Loans
C) Refinancings
D) Home Improvement Loans
F) Non-occupant Loans on < 5 Family Dwellings (A B C & D)
Number
Average Value
Number
Average Value
Number
Average Value
Number
Average Value
Number
Average Value
LOANS ORIGINATED
5
$441,644
12
$636,074
85
$436,680
3
$156,897
8
$911,529
APPLICATIONS APPROVED, NOT ACCEPTED
0
$0
1
$1,069,010
6
$442,793
1
$112,110
0
$0
APPLICATIONS DENIED
1
$310,320
1
$305,690
22
$489,471
1
$8,180
1
$317,830
APPLICATIONS WITHDRAWN
1
$346,340
2
$494,560
15
$421,073
1
$334,670
0
$0
FILES CLOSED FOR INCOMPLETENESS
0
$0
0
$0
4
$295,188
0
$0
0
$0
Aggregated Statistics For Year 2008 (Based on 4 partial tracts)
A) FHA, FSA/RHS & VA Home Purchase Loans
B) Conventional Home Purchase Loans
C) Refinancings
D) Home Improvement Loans
F) Non-occupant Loans on < 5 Family Dwellings (A B C & D)
Number
Average Value
Number
Average Value
Number
Average Value
Number
Average Value
Number
Average Value
LOANS ORIGINATED
2
$537,215
15
$532,671
36
$379,984
5
$128,262
5
$576,272
APPLICATIONS APPROVED, NOT ACCEPTED
0
$0
2
$1,212,895
5
$426,376
0
$0
1
$244,290
APPLICATIONS DENIED
0
$0
2
$287,190
18
$518,496
3
$121,657
1
$313,210
APPLICATIONS WITHDRAWN
0
$0
3
$485,950
7
$519,657
0
$0
0
$0
FILES CLOSED FOR INCOMPLETENESS
0
$0
1
$405,730
3
$567,473
0
$0
0
$0
Aggregated Statistics For Year 2007 (Based on 4 partial tracts)
B) Conventional Home Purchase Loans
C) Refinancings
D) Home Improvement Loans
F) Non-occupant Loans on < 5 Family Dwellings (A B C & D)
Number
Average Value
Number
Average Value
Number
Average Value
Number
Average Value
LOANS ORIGINATED
33
$581,695
54
$430,897
11
$170,793
8
$699,900
APPLICATIONS APPROVED, NOT ACCEPTED
2
$540,265
11
$404,209
2
$80,270
1
$635,580
APPLICATIONS DENIED
8
$653,045
31
$504,890
3
$167,177
2
$313,465
APPLICATIONS WITHDRAWN
5
$470,500
13
$434,581
2
$204,990
0
$0
FILES CLOSED FOR INCOMPLETENESS
1
$255,140
7
$467,620
0
$0
0
$0
Aggregated Statistics For Year 2006 (Based on 4 partial tracts)
B) Conventional Home Purchase Loans
C) Refinancings
D) Home Improvement Loans
F) Non-occupant Loans on < 5 Family Dwellings (A B C & D)
Number
Average Value
Number
Average Value
Number
Average Value
Number
Average Value
LOANS ORIGINATED
41
$531,611
67
$464,312
10
$179,861
11
$426,588
APPLICATIONS APPROVED, NOT ACCEPTED
5
$562,880
9
$452,770
2
$281,775
1
$532,980
APPLICATIONS DENIED
6
$458,015
23
$434,849
5
$185,084
3
$346,237
APPLICATIONS WITHDRAWN
5
$439,134
16
$482,039
2
$256,615
1
$529,850
FILES CLOSED FOR INCOMPLETENESS
0
$0
3
$403,707
1
$120,870
0
$0
Aggregated Statistics For Year 2005 (Based on 4 partial tracts)
B) Conventional Home Purchase Loans
C) Refinancings
D) Home Improvement Loans
F) Non-occupant Loans on < 5 Family Dwellings (A B C & D)
Number
Average Value
Number
Average Value
Number
Average Value
Number
Average Value
LOANS ORIGINATED
74
$474,862
86
$447,112
13
$267,723
15
$424,919
APPLICATIONS APPROVED, NOT ACCEPTED
6
$542,567
8
$280,096
2
$261,605
0
$0
APPLICATIONS DENIED
8
$374,081
19
$449,103
5
$239,798
2
$258,660
APPLICATIONS WITHDRAWN
7
$439,999
17
$437,747
4
$168,448
1
$258,030
FILES CLOSED FOR INCOMPLETENESS
1
$706,230
2
$485,510
0
$0
0
$0
Aggregated Statistics For Year 2004 (Based on 4 partial tracts)
B) Conventional Home Purchase Loans
C) Refinancings
D) Home Improvement Loans
F) Non-occupant Loans on < 5 Family Dwellings (A B C & D)
G) Loans On Manufactured Home Dwelling (A B C & D)
Number
Average Value
Number
Average Value
Number
Average Value
Number
Average Value
Number
Average Value
LOANS ORIGINATED
48
$428,644
91
$363,129
12
$216,452
9
$459,794
0
$0
APPLICATIONS APPROVED, NOT ACCEPTED
5
$306,116
10
$335,599
1
$77,320
0
$0
1
$96,710
APPLICATIONS DENIED
6
$401,777
21
$392,995
4
$166,265
2
$903,395
3
$48,313
APPLICATIONS WITHDRAWN
6
$589,420
14
$337,940
1
$251,880
1
$504,490
0
$0
FILES CLOSED FOR INCOMPLETENESS
2
$516,120
4
$519,025
0
$0
0
$0
0
$0
Aggregated Statistics For Year 2003 (Based on 4 partial tracts)
B) Conventional Home Purchase Loans
C) Refinancings
D) Home Improvement Loans
F) Non-occupant Loans on < 5 Family Dwellings (A B C & D)
Number
Average Value
Number
Average Value
Number
Average Value
Number
Average Value
LOANS ORIGINATED
43
$401,478
197
$311,105
9
$132,588
10
$455,775
APPLICATIONS APPROVED, NOT ACCEPTED
4
$502,985
19
$308,629
2
$89,065
1
$1,215,350
APPLICATIONS DENIED
2
$282,425
29
$277,496
3
$37,823
1
$270,580
APPLICATIONS WITHDRAWN
5
$446,080
22
$369,133
1
$28,880
1
$205,580
FILES CLOSED FOR INCOMPLETENESS
0
$0
6
$402,162
0
$0
0
$0
Aggregated Statistics For Year 2002 (Based on 2 partial tracts)
A) FHA, FSA/RHS & VA Home Purchase Loans
B) Conventional Home Purchase Loans
C) Refinancings
D) Home Improvement Loans
F) Non-occupant Loans on < 5 Family Dwellings (A B C & D)
Number
Average Value
Number
Average Value
Number
Average Value
Number
Average Value
Number
Average Value
LOANS ORIGINATED
1
$244,950
32
$307,129
101
$290,159
3
$59,447
4
$217,282
APPLICATIONS APPROVED, NOT ACCEPTED
0
$0
4
$279,048
8
$373,642
1
$124,370
0
$0
APPLICATIONS DENIED
0
$0
3
$247,690
12
$297,421
2
$36,150
0
$0
APPLICATIONS WITHDRAWN
0
$0
6
$373,257
11
$259,245
1
$62,400
1
$281,420
FILES CLOSED FOR INCOMPLETENESS
0
$0
0
$0
2
$233,775
0
$0
0
$0
Aggregated Statistics For Year 2001 (Based on 2 partial tracts)
A) FHA, FSA/RHS & VA Home Purchase Loans
B) Conventional Home Purchase Loans
C) Refinancings
D) Home Improvement Loans
F) Non-occupant Loans on < 5 Family Dwellings (A B C & D)
Number
Average Value
Number
Average Value
Number
Average Value
Number
Average Value
Number
Average Value
LOANS ORIGINATED
2
$170,960
33
$278,793
70
$293,979
4
$63,872
3
$255,210
APPLICATIONS APPROVED, NOT ACCEPTED
0
$0
2
$199,415
6
$221,200
3
$38,507
0
$0
APPLICATIONS DENIED
0
$0
2
$390,825
15
$189,481
2
$33,200
0
$0
APPLICATIONS WITHDRAWN
0
$0
4
$275,148
9
$268,606
1
$45,320
0
$0
FILES CLOSED FOR INCOMPLETENESS
1
$69,770
1
$308,610
3
$250,783
1
$65,350
0
$0
Aggregated Statistics For Year 2000 (Based on 2 partial tracts)
A) FHA, FSA/RHS & VA Home Purchase Loans
B) Conventional Home Purchase Loans
C) Refinancings
D) Home Improvement Loans
F) Non-occupant Loans on < 5 Family Dwellings (A B C & D)
Number
Average Value
Number
Average Value
Number
Average Value
Number
Average Value
Number
Average Value
LOANS ORIGINATED
2
$151,145
33
$294,743
18
$196,747
5
$44,732
2
$276,780
APPLICATIONS APPROVED, NOT ACCEPTED
0
$0
4
$209,588
4
$199,628
2
$62,820
0
$0
APPLICATIONS DENIED
1
$62,400
4
$292,328
5
$231,670
1
$44,060
1
$276,570
APPLICATIONS WITHDRAWN
0
$0
3
$290,060
5
$189,340
1
$39,420
0
$0
FILES CLOSED FOR INCOMPLETENESS
0
$0
0
$0
1
$258,230
0
$0
0
$0
Aggregated Statistics For Year 1999 (Based on 2 partial tracts)
A) FHA, FSA/RHS & VA Home Purchase Loans
B) Conventional Home Purchase Loans
C) Refinancings
D) Home Improvement Loans
F) Non-occupant Loans on < 5 Family Dwellings (A B C & D)
Detailed PMIC statistics for the following Tracts:6108.00
, 9901.00
2002 - 2018 National Fire Incident Reporting System (NFIRS) incidents
Based on the data from the years 2002 - 2018 the average number of fire incidents per year is 6. The highest number of fires - 16 took place in 2015, and the least - 1 in 2002. The data has an increasing trend.
When looking into fire subcategories, the most incidents belonged to: Structure Fires (54.6%), and Outside Fires (25.0%).
Fire incident types reported to NFIRS in Zip Code 20184


 Nearest zip codes: 20130, 20135, 20144, 22642, 20141, 20117.


 Based on the data from the years 2002 - 2018 the average number of fire incidents per year is 6. The highest number of fires - 16 took place in 2015, and the least - 1 in 2002. The data has an increasing trend.
 When looking into fire subcategories, the most incidents belonged to: Structure Fires (54.6%), and Outside Fires (25.0%).