Estimated zip code population in 2022: 1,693 Zip code population in 2010: 1,940 Zip code population in 2000: 2,272
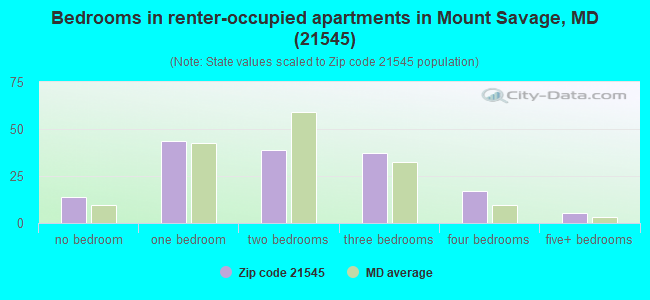
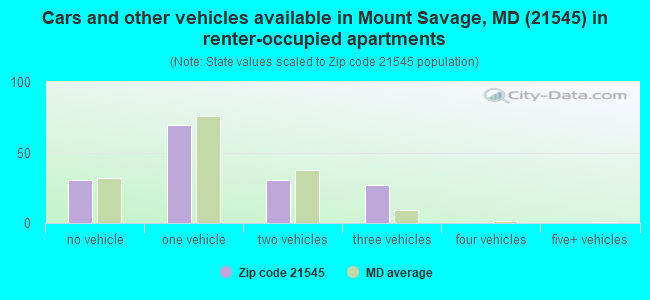
Houses and condos: 844 Renter-occupied apartments: 155
% of renters here:
21%
State:
32%
March 2022 cost of living index in zip code 21545: 89.1 (less than average, U.S. average is 100)
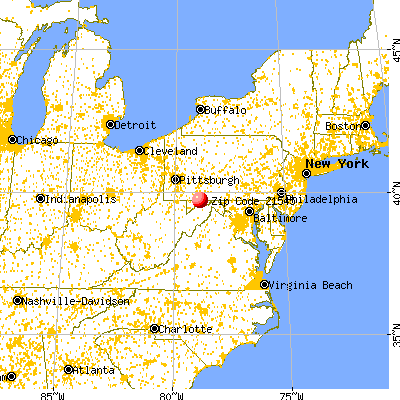
Land area: 14.4 sq. mi. Water area: 0.0 sq. mi.
Population density: 118 people per square mile
(very low).
OSM Map
General Map
Google Map
MSN Map
OSM Map
General Map
Google Map
MSN Map
OSM Map
General Map
Google Map
MSN Map
OSM Map
General Map
Google Map
MSN Map
Please wait while loading the map...
Real estate property taxes paid for housing units in 2022:
This zip code:
1.0% ($1,080)
Maryland:
0.9% ($3,777)
Median real estate property taxes paid for housing units with mortgages in 2022: $948 (0.8%) Median real estate property taxes paid for housing units with no mortgage in 2022: $1,136 (1.1%)
Business Search- 14 Million verified businesses
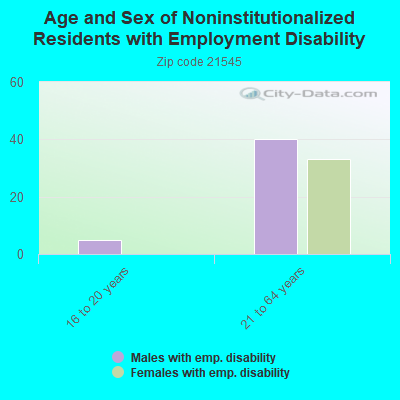
Males: 811
(47.9%)
Females: 882
(52.1%)
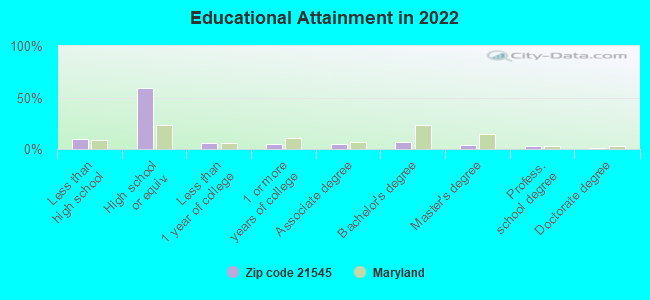
For population 25 years and over in 21545:
High school or higher: 89.0%
Bachelor's degree or higher: 14.8%
Graduate or professional degree: 7.8%
Unemployed: 8.8%
Mean travel time to work (commute): 22.4 minutes
For population 15 years and over in 21545:
Never married: 25.7%
Now married: 51.5%
Separated: 1.9%
Widowed: 3.6%
Divorced: 17.3%
Zip code 21545 compared to state average:
Median household income below state average.
Median house value significantly below state average.
Unemployed percentage above state average.
Black race population percentage significantly below state average.
Hispanic race population percentage significantly below state average.
Median age significantly above state average.
Foreign-born population percentage significantly below state average.
Renting percentage below state average.
Length of stay since moving in significantly above state average.
House age above state average.
Percentage of population with a bachelor's degree or higher significantly below state average.
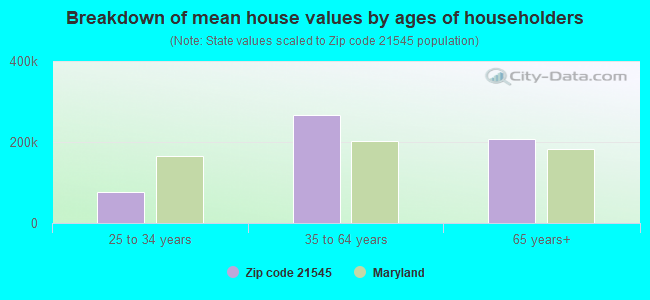
Estimated median house/condo value in 2022: $112,891
21545:
$112,891
Maryland:
$398,100
According to our research of Maryland and other state lists, there was 1 registered sex offender living in 21545 zip code as of May 28, 2024. The ratio of all residents to sex offenders in zip code 21545 is 2,031 to 1. The ratio of registered sex offenders to all residents in this zip code is lower than the state average.
Median resident age:
This zip code:
52.1 years
Maryland median age:
39.7 years
Average household size:
This zip code:
2.3 people
Maryland:
2.5 people
Averages for the 2020 tax year for zip code 21545, filed in 2021:
Average Adjusted Gross Income (AGI) in 2020: $45,899 (Individual Income Tax Returns)
Here:
$45,899
State:
$86,905
Salary/wage: $43,412 (reported on 80.2% of returns)
Here:
$43,412
State:
$73,953
(% of AGI for various income ranges: 1116.4% for AGIs below $25k, 3437.1% for AGIs $25k-50k, 5450.8% for AGIs $50k-75k, 9073.3% for AGIs $75k-100k, 16590.0% for AGIs $100k-200k)
Taxable interest for individuals: $388 (reported on 30.2% of returns)
This zip code:
$388
Maryland:
$1,528
(% of AGI for various income ranges: 9.1% for AGIs below $25k, 12.9% for AGIs $25k-50k, 13.3% for AGIs $50k-75k, 25.0% for AGIs $75k-100k, 46.0% for AGIs $100k-200k)
Ordinary dividends: $744 (reported on 10.5% of returns)
Here:
$744
State:
$8,028
(% of AGI for various income ranges: 5.5% for AGIs below $25k, 10.0% for AGIs $25k-50k, 56.7% for AGIs $75k-100k)
Net capital gain/loss in AGI: +$1,480 (reported on 5.8% of returns)
Here:
+$1,480
State:
+$25,238
(% of AGI for various income ranges: 5.7% for AGIs $25k-50k, 103.3% for AGIs $75k-100k)
Profit/loss from business: +$8,125 (reported on 9.3% of returns)
Here:
+$8,125
State:
+$11,398
(% of AGI for various income ranges: 60.5% for AGIs below $25k, 163.3% for AGIs $25k-50k, 290.0% for AGIs $75k-100k)
Taxable individual retirement arrangement distribution: $9,683 (reported on 7.0% of returns)
21545:
$9,683
Maryland:
$20,944
(% of AGI for various income ranges: 150.5% for AGIs below $25k, 208.3% for AGIs $50k-75k)
Earned income credit: $2,185 (reported on 15.1% of returns)
Here:
$2,185
State:
$2,151
(% of AGI for various income ranges: 83.2% for AGIs below $25k, 48.1% for AGIs $25k-50k)
Percentage of individuals using paid preparers for their 2020 taxes: 94.2%
Here:
94%
State:
90%
(% for various income ranges: 93.3% for AGIs below $25k, 92.3% for AGIs $25k-50k, 92.9% for AGIs $50k-75k, 100.0% for AGIs $75k-100k, 100.0% for AGIs $100k-200k)
Averages for the 2012 tax year for zip code 21545, filed in 2013:
Average Adjusted Gross Income (AGI) in 2012: $38,182 (Individual Income Tax Returns)
Here:
$38,182
State:
$72,703
Salary/wage: $35,505 (reported on 84.4% of returns)
Here:
$35,505
State:
$62,228
(% of AGI for various income ranges: 73.0% for AGIs below $25k, 78.6% for AGIs $25k-50k, 83.8% for AGIs $50k-75k, 78.3% for AGIs $75k-100k, 74.7% for AGIs $100k-200k)
Taxable interest for individuals: $426 (reported on 37.8% of returns)
This zip code:
$426
Maryland:
$1,413
(% of AGI for various income ranges: 0.5% for AGIs below $25k, 0.8% for AGIs $25k-50k, 0.1% for AGIs $50k-75k, 0.5% for AGIs $75k-100k, 0.2% for AGIs $100k-200k)
Ordinary dividends: $860 (reported on 11.1% of returns)
Here:
$860
State:
$6,933
(% of AGI for various income ranges: 0.5% for AGIs below $25k, 0.3% for AGIs $25k-50k, 0.6% for AGIs $75k-100k)
Net capital gain/loss in AGI: +$1,014 (reported on 7.8% of returns)
Here:
+$1,014
State:
+$14,830
Profit/loss from business: +$4,760 (reported on 11.1% of returns)
Here:
+$4,760
State:
+$12,606
(% of AGI for various income ranges: 4.9% for AGIs below $25k, 1.0% for AGIs $25k-50k, 2.1% for AGIs $75k-100k)
Taxable individual retirement arrangement distribution: $7,943 (reported on 7.8% of returns)
21545:
$7,943
Maryland:
$17,065
(% of AGI for various income ranges: 2.4% for AGIs below $25k, 2.5% for AGIs $25k-50k, 2.3% for AGIs $50k-75k)
Total itemized deductions: $17,524 (24% of AGI, reported on 18.9% of returns)
Here:
$17,524
State:
$27,886
Here:
24.4% of AGI
State:
22.8% of AGI
(% of AGI for various income ranges: 5.2% for AGIs below $25k, 6.1% for AGIs $25k-50k, 9.9% for AGIs $50k-75k, 10.4% for AGIs $75k-100k, 12.5% for AGIs $100k-200k)
Charity contributions: $2,454 (reported on 14.4% of returns)
Here:
$2,454
State:
$4,452
(% of AGI for various income ranges: 1.1% for AGIs $25k-50k, 1.0% for AGIs $50k-75k, 1.1% for AGIs $75k-100k, 1.2% for AGIs $100k-200k)
Taxes paid: $6,276 (reported on 18.9% of returns)
21545:
$6,276
State:
$11,690
(% of AGI for various income ranges: 0.9% for AGIs below $25k, 1.8% for AGIs $25k-50k, 3.3% for AGIs $50k-75k, 3.5% for AGIs $75k-100k, 6.9% for AGIs $100k-200k)
Earned income credit: $2,075 (reported on 17.8% of returns)
Here:
$2,075
State:
$2,199
(% of AGI for various income ranges: 4.7% for AGIs below $25k, 1.0% for AGIs $25k-50k)
Percentage of individuals using paid preparers for their 2012 taxes: 54.4%
Here:
54%
State:
52%
(% for various income ranges: 46.2% for AGIs below $25k, 56.0% for AGIs $25k-50k, 64.3% for AGIs $50k-75k, 75.0% for AGIs $75k-100k, 50.0% for AGIs $100k-200k)
Averages for the 2004 tax year for zip code 21545, filed in 2005:
Average Adjusted Gross Income (AGI) in 2004: $32,575 (Individual Income Tax Returns)
Here:
$32,575
State:
$60,339
Salary/wage: $30,689 (reported on 86.3% of returns)
Here:
$30,689
State:
$52,211
(% of AGI for various income ranges: 78.2% for AGIs below $10k, 78.8% for AGIs $10k-25k, 82.3% for AGIs $25k-50k, 88.0% for AGIs $50k-75k, 86.9% for AGIs $75k-100k, 63.3% for AGIs over 100k)
Taxable interest for individuals: $931 (reported on 40.0% of returns)
This zip code:
$931
Maryland:
$1,701
(% of AGI for various income ranges: 1.2% for AGIs below $10k, 1.2% for AGIs $10k-25k, 1.9% for AGIs $25k-50k, 0.8% for AGIs $50k-75k, 0.3% for AGIs $75k-100k, 0.5% for AGIs over 100k)
Taxable dividends: $569 (reported on 12.8% of returns)
Here:
$569
State:
$4,235
(% of AGI for various income ranges: 0.2% for AGIs below $10k, 0.3% for AGIs $10k-25k, 0.3% for AGIs $25k-50k, 0.0% for AGIs $50k-75k, 0.2% for AGIs $75k-100k, 0.3% for AGIs over 100k)
Net capital gain/loss: +$827 (reported on 8.3% of returns)
Here:
+$827
State:
+$15,888
(% of AGI for various income ranges: 0.1% for AGIs $10k-25k, -0.1% for AGIs $25k-50k, 0.2% for AGIs $50k-75k, 1.5% for AGIs $75k-100k)
Profit/loss from business: +$5,292 (reported on 11.7% of returns)
Here:
+$5,292
State:
+$12,221
(% of AGI for various income ranges: 3.8% for AGIs below $10k, 3.6% for AGIs $10k-25k, 3.4% for AGIs $25k-50k, -0.2% for AGIs $50k-75k, 1.3% for AGIs $75k-100k)
IRA payment deduction: $2,000 (reported on 1.9% of returns)
21545:
$2,000
Maryland:
$2,968
Total itemized deductions: $14,629 (21% of AGI, reported on 16.6% of returns)
Here:
$14,629
State:
$22,960
Here:
21.2% of AGI
State:
23.3% of AGI
(% of AGI for various income ranges: 3.9% for AGIs $10k-25k, 5.3% for AGIs $25k-50k, 9.8% for AGIs $50k-75k, 9.8% for AGIs $75k-100k, 13.0% for AGIs over 100k)
Charity contributions deductions: $2,203 (3% of AGI, reported on 13.0% of returns)
Here:
$2,203
State:
$4,031
Here:
3.0% of AGI
State:
3.9% of AGI
(% of AGI for various income ranges: 0.4% for AGIs $10k-25k, 0.7% for AGIs $25k-50k, 1.1% for AGIs $50k-75k, 1.0% for AGIs $75k-100k, 1.6% for AGIs over 100k)
Total tax: $3,553 (reported on 72.2% of returns)
21545:
$3,553
State:
$10,167
(% of AGI for various income ranges: 1.9% for AGIs below $10k, 3.5% for AGIs $10k-25k, 6.3% for AGIs $25k-50k, 7.9% for AGIs $50k-75k, 9.9% for AGIs $75k-100k, 17.6% for AGIs over 100k)
Earned income credit: $1,746 (reported on 18.6% of returns)
Here:
$1,746
State:
$1,700
Percentage of individuals using paid preparers for their 2004 taxes: 57.9%
Here:
58%
State:
55%
(% for various income ranges: 42.3% for AGIs below $10k, 59.2% for AGIs $10k-25k, 62.6% for AGIs $25k-50k, 65.5% for AGIs $50k-75k, 64.4% for AGIs $75k-100k, 61.9% for AGIs over 100k)
Likely homosexual households (counted as self-reported same-sex unmarried-partner households)
Lesbian couples: 3.3% of all households
Gay men: 0.0% of all households
Household received Food Stamps/SNAP in the past 12 months: 108 Household did not receive Food Stamps/SNAP in the past 12 months: 642
Women who had a birth in the past 12 months: 17 (17 now married, 0 unmarried) Women who did not have a birth in the past 12 months: 350 (106 now married, 243 unmarried)
Housing units in zip code 21545 with a mortgage: 225 (9 second mortgage, 5 both second mortgage and home equity loan) Houses without a mortgage: 15
Median monthly owner costs for units with a mortgage: $1,173 Median monthly owner costs for units without a mortgage: $434
Residents with income below the poverty level in 2022:
This zip code:
16.9%
Whole state:
9.6%
Residents with income below 50% of the poverty level in 2022:
This zip code:
7.9%
Whole state:
4.7%
Median number of rooms in houses and condos:
Here:
7.0
State:
7.3
Median number of rooms in apartments:
Here:
5.3
State:
4.2
Notable locations in this zip code not listed on our city pages
Size of family households: 254 2-persons, 101 3-persons, 43 4-persons, 10 5-persons, 16 6-persons, 5 7-or-more-persons
Size of nonfamily households: 185 1-person, 62 2-persons, 77 3-persons
118 married couples with children.
25 single-parent households (25 women).
98.1% of residents of 21545 zip code speak English at home.
1.2% of residents speak Asian or Pacific Island language at home (100% not well).
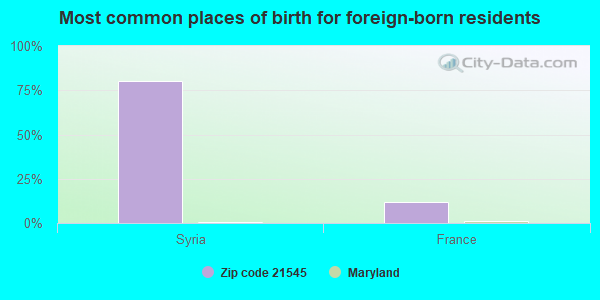
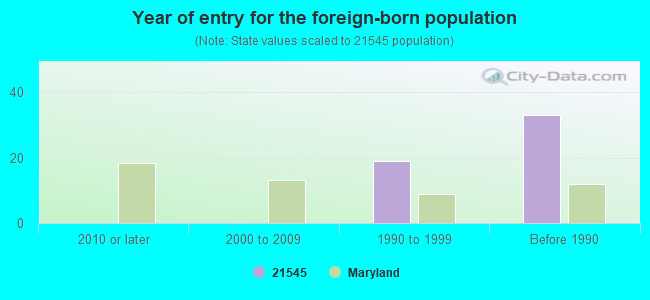
Foreign born population: 50 (3.0%) (44.8% of them are naturalized citizens)
This zip code:
3.0%
Whole state:
16.7%
80%Syria
12%France
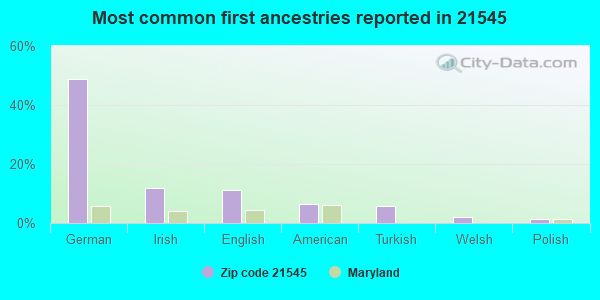
49%German
12%Irish
11%English
6%American
6%Turkish
2%Welsh
1%Polish
Year of entry for the foreign-born population
02010 or later
02000 to 2009
191990 to 1999
33Before 1990
Facilities with environmental interests located in this zip code:
MT SAVAGE SPECIAL REFRACTORIES (15905 FOUNDRY ROW in MOUNT SAVAGE, MD)
AIR MINOR (AIRS/AFS) STATE MASTER (Maryland Permits tracking) - NPDES STORMWATER PERMIT STATE MASTER (Maryland Air Emissions Database) - AIR MAJOR TRI REPORTER (Tracking of toxic chemicals releasing facilities) Business SIC classification: CLAY REFRACTORIES; MINERALS AND EARTHS, GROUND OR OTHERWISE TREATED Alternative names: MOUNT SAVAGE SPECIALTY REFRACTORIES CO, MOUNT SAVAGE SPECIALTY REFRACTORY, MT SAVAGE SPECIALTY REFRACTORIES
MOUNT SAVAGE HIGH SCHOOL (13201 NEW SCHOOL ROAD NORTHWEST in MOUNT SAVAGE, MD)
AIR MINOR (AIRS/AFS) STATE MASTER (Maryland Air Emissions Database) - AIR MINOR Business SIC classification: ELEMENTARY AND SECONDARY SCHOOLS Alternative names: MT SAVAGE HIGH SCHOOL
MOUNT SAVAGE ELEMENTARY/MIDDLE (13201 NEW SCHOOL RD NW in MOUNT SAVAGE, MD)
(National Center for Education Statistics) - STATE ID-011301 Organizations: ALLEGANY COUNTY BOARD OF EDUCATON (SCHOOL DISTRICT)
BARRELVILLE (13320 BARNEY ENGLE LANE NW in MOUNT SAVAGE, MD)
(Integrated Compliance Information System) - ICIS-03-1997-0194, FORMAL ENFORCEMENT ACTION Business SIC classification: WATER SUPPLY
Housing units lacking complete plumbing facilities: 3.5%
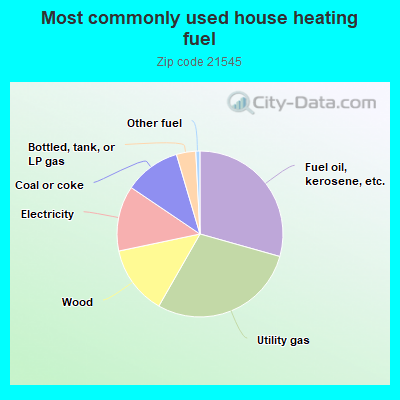
29.5%Fuel oil, kerosene, etc.
29.0%Utility gas
13.5%Wood
12.8%Electricity
11.0%Coal or coke
3.8%Bottled, tank, or LP gas
0.8%Other fuel
Population in 1990: 2,067. Population change in the 1990s: +205 (+9.9%).
Place of birth for U.S.-born residents:
This state: 1,279
Northeast: 92
Midwest: 27
South: 219
West: 6
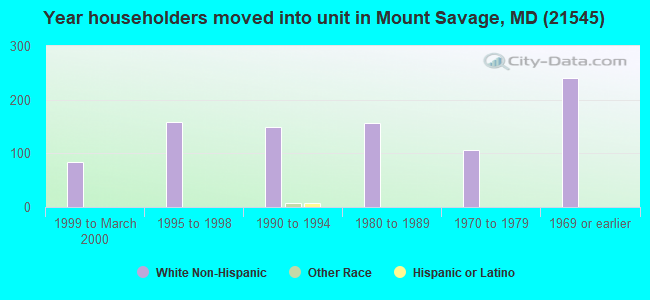
78% of the 21545 zip code residents lived in the same house 5 years ago. Out of people who lived in different houses, 78% lived in this county. Out of people who lived in different counties, 50% lived in Maryland.
98% of the 21545 zip code residents lived in the same house 1 year ago. Out of people who lived in different houses, 70% moved from this county. Out of people who lived in different houses, 70% moved from different state.
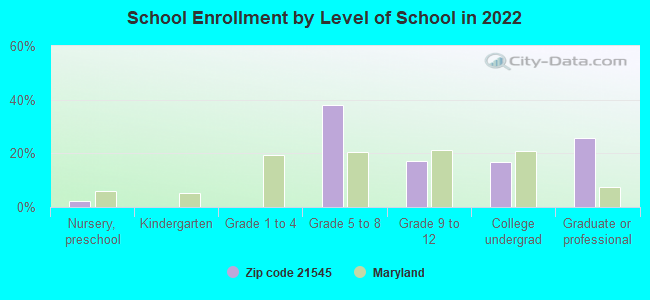
Private vs. public school enrollment:
Students in private schools in grades 1 to 8 (elementary and middle school):
Here:
0.0%
Maryland:
15.2%
Students in private schools in grades 9 to 12 (high school): 6
Here:
20.7%
Maryland:
14.4%
Students in private undergraduate colleges: 4
Here:
16.9%
Maryland:
20.2%
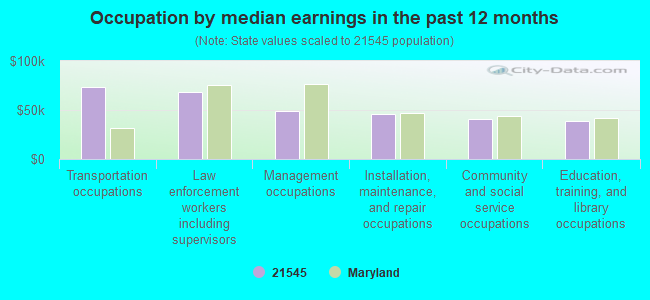
Occupation by median earnings in the past 12 months ($)
73,922Transportation occupations
68,472Law enforcement workers including supervisors
49,205Management occupations
46,011Installation, maintenance, and repair occupations
40,753Community and social service occupations
38,659Education, training, and library occupations
Top industries in this zip code by the number of employees in 2005:
Other Services (except Public Administration): Religious Organizations (1-4 employees: 4 establishments)
Health Care and Social Assistance: Child Day Care Services (5-9: 1)
Other Services (except Public Administration): Civic and Social Organizations (5-9: 1)
Health Care and Social Assistance: Home Health Care Services (5-9: 1)
Accommodation and Food Services: Drinking Places (Alcoholic Beverages) (1-4: 2)
Administrative and Support and Waste Management and Remediation Services: Landscaping Services (1-4: 1)
Other Services (except Public Administration): Commercial and Industrial Machinery and Equipment (except Automotive and Electronic) Repair and Maintenance (1-4: 1)
Fatal accident statistics in 2011:
Fatal accident count: 1
Vehicles involved in fatal accidents: 1
Fatal accidents caused by drunken drivers: 0
Fatalities: 1
Persons involved in fatal accidents: 1
Pedestrians involved in fatal accidents: 0
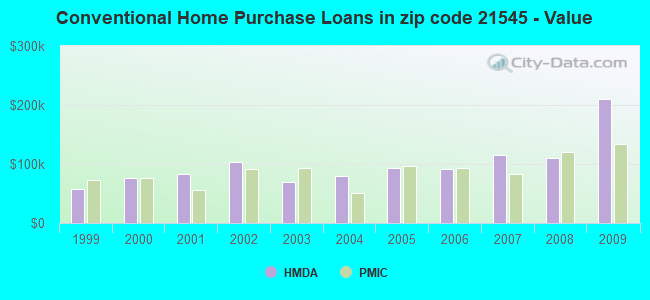
Home Mortgage Disclosure Act Aggregated Statistics For Year 2009 (Based on 2 full and 2 partial tracts)
A) FHA, FSA/RHS & VA Home Purchase Loans
B) Conventional Home Purchase Loans
C) Refinancings
D) Home Improvement Loans
F) Non-occupant Loans on < 5 Family Dwellings (A B C & D)
G) Loans On Manufactured Home Dwelling (A B C & D)
Number
Average Value
Number
Average Value
Number
Average Value
Number
Average Value
Number
Average Value
Number
Average Value
LOANS ORIGINATED
12
$115,908
18
$209,446
88
$116,002
19
$31,426
5
$97,128
0
$0
APPLICATIONS APPROVED, NOT ACCEPTED
0
$0
2
$773,375
3
$158,387
2
$11,975
0
$0
0
$0
APPLICATIONS DENIED
3
$81,760
4
$150,682
48
$85,703
5
$44,478
3
$58,360
2
$55,880
APPLICATIONS WITHDRAWN
0
$0
1
$68,010
25
$94,917
0
$0
0
$0
1
$71,640
FILES CLOSED FOR INCOMPLETENESS
2
$112,765
0
$0
3
$83,813
0
$0
0
$0
0
$0
Aggregated Statistics For Year 2008 (Based on 2 full and 2 partial tracts)
A) FHA, FSA/RHS & VA Home Purchase Loans
B) Conventional Home Purchase Loans
C) Refinancings
D) Home Improvement Loans
F) Non-occupant Loans on < 5 Family Dwellings (A B C & D)
G) Loans On Manufactured Home Dwelling (A B C & D)
Number
Average Value
Number
Average Value
Number
Average Value
Number
Average Value
Number
Average Value
Number
Average Value
LOANS ORIGINATED
19
$93,676
41
$109,384
83
$118,802
33
$28,856
7
$90,723
0
$0
APPLICATIONS APPROVED, NOT ACCEPTED
0
$0
1
$102,470
2
$76,840
3
$110,630
0
$0
1
$102,470
APPLICATIONS DENIED
5
$77,610
5
$82,784
57
$85,721
12
$40,698
2
$44,905
3
$113,987
APPLICATIONS WITHDRAWN
2
$64,865
4
$26,445
36
$103,773
5
$47,352
3
$46,867
0
$0
FILES CLOSED FOR INCOMPLETENESS
2
$165,650
0
$0
9
$113,777
2
$39,915
1
$77,980
0
$0
Aggregated Statistics For Year 2007 (Based on 2 full and 2 partial tracts)
A) FHA, FSA/RHS & VA Home Purchase Loans
B) Conventional Home Purchase Loans
C) Refinancings
D) Home Improvement Loans
F) Non-occupant Loans on < 5 Family Dwellings (A B C & D)
G) Loans On Manufactured Home Dwelling (A B C & D)
Number
Average Value
Number
Average Value
Number
Average Value
Number
Average Value
Number
Average Value
Number
Average Value
LOANS ORIGINATED
7
$80,319
36
$114,749
50
$79,992
44
$34,783
7
$66,780
0
$0
APPLICATIONS APPROVED, NOT ACCEPTED
0
$0
9
$70,752
9
$60,714
3
$59,547
4
$53,888
0
$0
APPLICATIONS DENIED
0
$0
21
$63,232
138
$102,828
30
$57,921
7
$46,679
4
$82,590
APPLICATIONS WITHDRAWN
1
$110,630
6
$58,980
54
$106,806
8
$74,588
4
$53,105
1
$58,040
FILES CLOSED FOR INCOMPLETENESS
0
$0
1
$126,950
10
$100,488
0
$0
0
$0
0
$0
Aggregated Statistics For Year 2006 (Based on 2 full and 2 partial tracts)
A) FHA, FSA/RHS & VA Home Purchase Loans
B) Conventional Home Purchase Loans
C) Refinancings
D) Home Improvement Loans
F) Non-occupant Loans on < 5 Family Dwellings (A B C & D)
G) Loans On Manufactured Home Dwelling (A B C & D)
Number
Average Value
Number
Average Value
Number
Average Value
Number
Average Value
Number
Average Value
Number
Average Value
LOANS ORIGINATED
11
$100,754
50
$91,409
98
$83,206
39
$33,516
13
$71,195
5
$112,520
APPLICATIONS APPROVED, NOT ACCEPTED
1
$130,580
9
$94,648
21
$83,858
3
$66,520
2
$59,875
2
$219,540
APPLICATIONS DENIED
0
$0
4
$62,538
129
$79,121
24
$46,400
10
$60,224
3
$89,193
APPLICATIONS WITHDRAWN
0
$0
5
$129,540
97
$77,899
8
$47,056
9
$39,854
0
$0
FILES CLOSED FOR INCOMPLETENESS
0
$0
0
$0
4
$111,100
1
$27,200
0
$0
0
$0
Aggregated Statistics For Year 2005 (Based on 2 full and 2 partial tracts)
A) FHA, FSA/RHS & VA Home Purchase Loans
B) Conventional Home Purchase Loans
C) Refinancings
D) Home Improvement Loans
F) Non-occupant Loans on < 5 Family Dwellings (A B C & D)
G) Loans On Manufactured Home Dwelling (A B C & D)
Number
Average Value
Number
Average Value
Number
Average Value
Number
Average Value
Number
Average Value
Number
Average Value
LOANS ORIGINATED
12
$83,855
38
$92,933
103
$67,537
33
$35,956
11
$86,870
2
$36,920
APPLICATIONS APPROVED, NOT ACCEPTED
0
$0
6
$64,693
13
$78,207
1
$5,440
2
$66,195
0
$0
APPLICATIONS DENIED
3
$120,273
17
$88,871
105
$77,623
19
$26,869
2
$14,510
13
$83,821
APPLICATIONS WITHDRAWN
0
$0
3
$62,887
94
$96,718
17
$91,961
4
$73,345
2
$77,835
FILES CLOSED FOR INCOMPLETENESS
0
$0
3
$121,547
14
$88,622
0
$0
0
$0
0
$0
Aggregated Statistics For Year 2004 (Based on 2 full and 2 partial tracts)
A) FHA, FSA/RHS & VA Home Purchase Loans
B) Conventional Home Purchase Loans
C) Refinancings
D) Home Improvement Loans
E) Loans on Dwellings For 5+ Families
F) Non-occupant Loans on < 5 Family Dwellings (A B C & D)
G) Loans On Manufactured Home Dwelling (A B C & D)
Number
Average Value
Number
Average Value
Number
Average Value
Number
Average Value
Number
Average Value
Number
Average Value
Number
Average Value
LOANS ORIGINATED
16
$70,102
45
$78,963
98
$79,314
32
$34,479
1
$651,080
7
$35,499
3
$112,780
APPLICATIONS APPROVED, NOT ACCEPTED
1
$28,110
8
$105,029
28
$79,977
0
$0
0
$0
0
$0
0
$0
APPLICATIONS DENIED
2
$57,580
8
$80,739
98
$71,022
29
$37,586
0
$0
3
$3,870
3
$80,733
APPLICATIONS WITHDRAWN
2
$66,860
5
$86,214
85
$80,778
9
$59,127
0
$0
1
$36,270
2
$98,790
FILES CLOSED FOR INCOMPLETENESS
0
$0
0
$0
10
$76,107
3
$14,817
0
$0
0
$0
0
$0
Aggregated Statistics For Year 2003 (Based on 2 full and 2 partial tracts)
A) FHA, FSA/RHS & VA Home Purchase Loans
B) Conventional Home Purchase Loans
C) Refinancings
D) Home Improvement Loans
F) Non-occupant Loans on < 5 Family Dwellings (A B C & D)
Number
Average Value
Number
Average Value
Number
Average Value
Number
Average Value
Number
Average Value
LOANS ORIGINATED
11
$58,139
28
$69,423
139
$86,292
16
$12,539
9
$55,680
APPLICATIONS APPROVED, NOT ACCEPTED
0
$0
3
$95,517
31
$109,022
0
$0
0
$0
APPLICATIONS DENIED
1
$194,060
13
$68,092
52
$76,201
14
$15,964
3
$112,120
APPLICATIONS WITHDRAWN
2
$71,850
0
$0
61
$85,138
2
$9,980
2
$9,980
FILES CLOSED FOR INCOMPLETENESS
0
$0
2
$59,875
6
$69,165
0
$0
0
$0
Aggregated Statistics For Year 2002 (Based on 2 full tracts)
A) FHA, FSA/RHS & VA Home Purchase Loans
B) Conventional Home Purchase Loans
C) Refinancings
D) Home Improvement Loans
F) Non-occupant Loans on < 5 Family Dwellings (A B C & D)
Number
Average Value
Number
Average Value
Number
Average Value
Number
Average Value
Number
Average Value
LOANS ORIGINATED
14
$70,994
20
$102,884
90
$55,261
26
$12,358
2
$86,815
APPLICATIONS APPROVED, NOT ACCEPTED
2
$48,895
8
$53,139
12
$47,067
2
$4,990
6
$29,605
APPLICATIONS DENIED
0
$0
18
$39,362
52
$78,642
8
$13,222
0
$0
APPLICATIONS WITHDRAWN
2
$46,900
8
$273,175
50
$76,200
0
$0
0
$0
FILES CLOSED FOR INCOMPLETENESS
0
$0
0
$0
10
$62,668
0
$0
0
$0
Aggregated Statistics For Year 2001 (Based on 2 full tracts)
A) FHA, FSA/RHS & VA Home Purchase Loans
B) Conventional Home Purchase Loans
C) Refinancings
D) Home Improvement Loans
F) Non-occupant Loans on < 5 Family Dwellings (A B C & D)
Number
Average Value
Number
Average Value
Number
Average Value
Number
Average Value
Number
Average Value
LOANS ORIGINATED
14
$63,866
18
$82,271
66
$57,152
22
$12,247
6
$67,192
APPLICATIONS APPROVED, NOT ACCEPTED
0
$0
2
$61,870
10
$58,078
0
$0
0
$0
APPLICATIONS DENIED
2
$48,895
8
$37,171
52
$52,735
16
$22,328
0
$0
APPLICATIONS WITHDRAWN
0
$0
0
$0
48
$83,075
4
$9,480
0
$0
FILES CLOSED FOR INCOMPLETENESS
0
$0
0
$0
10
$53,687
0
$0
0
$0
Aggregated Statistics For Year 2000 (Based on 2 full tracts)
A) FHA, FSA/RHS & VA Home Purchase Loans
B) Conventional Home Purchase Loans
C) Refinancings
D) Home Improvement Loans
F) Non-occupant Loans on < 5 Family Dwellings (A B C & D)
Number
Average Value
Number
Average Value
Number
Average Value
Number
Average Value
Number
Average Value
LOANS ORIGINATED
8
$62,868
20
$76,638
40
$40,166
38
$12,815
2
$61,870
APPLICATIONS APPROVED, NOT ACCEPTED
2
$76,840
2
$53,885
8
$75,840
6
$5,655
0
$0
APPLICATIONS DENIED
0
$0
10
$42,710
26
$37,920
16
$8,981
2
$5,985
APPLICATIONS WITHDRAWN
0
$0
4
$234,508
20
$54,685
0
$0
0
$0
FILES CLOSED FOR INCOMPLETENESS
0
$0
0
$0
2
$52,890
0
$0
0
$0
Aggregated Statistics For Year 1999 (Based on 2 full and 1 partial tracts)
A) FHA, FSA/RHS & VA Home Purchase Loans
B) Conventional Home Purchase Loans
C) Refinancings
D) Home Improvement Loans
F) Non-occupant Loans on < 5 Family Dwellings (A B C & D)
Detailed PMIC statistics for the following Tracts:0015.03
, 0016.00
2003 - 2018 National Fire Incident Reporting System (NFIRS) incidents
According to the data from the years 2003 - 2018 the average number of fire incidents per year is 13. The highest number of fires - 35 took place in 2009, and the least - 0 in 2006. The data has a rising trend.
When looking into fire subcategories, the most reports belonged to: Structure Fires (80.3%), and Outside Fires (11.3%).
Fire incident types reported to NFIRS in Zip Code 21545


 Nearest zip codes: 15564, 21524, 21529, 21502, 21543, 26767.
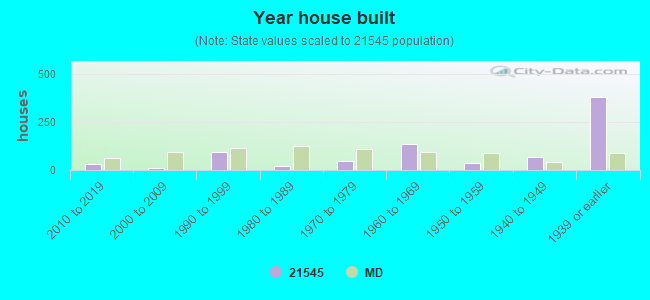


 According to the data from the years 2003 - 2018 the average number of fire incidents per year is 13. The highest number of fires - 35 took place in 2009, and the least - 0 in 2006. The data has a rising trend.
 When looking into fire subcategories, the most reports belonged to: Structure Fires (80.3%), and Outside Fires (11.3%).