Estimated zip code population in 2022: 1,782 Zip code population in 2010: 1,895 Zip code population in 2000: 2,093
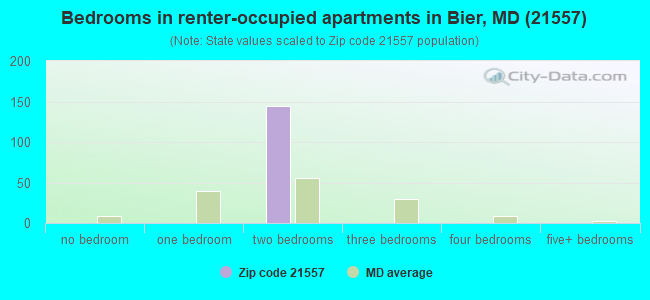
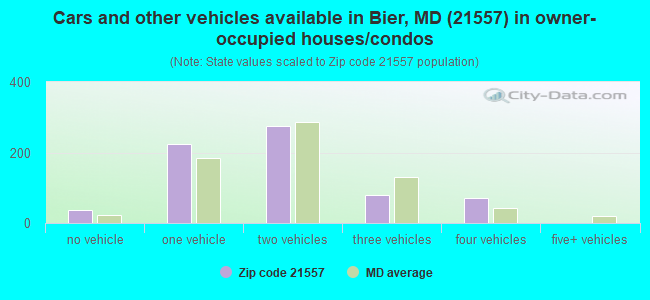
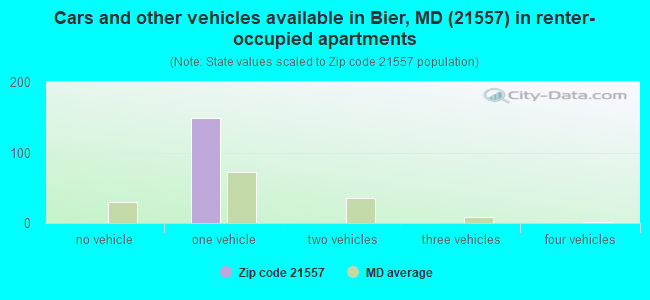
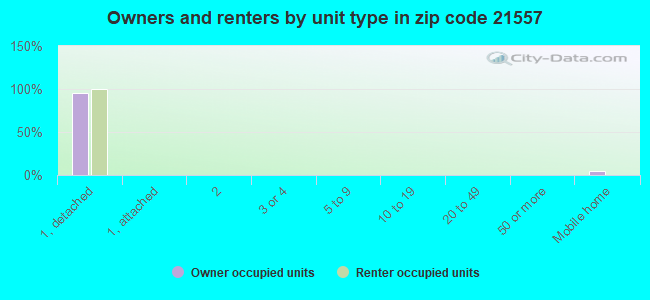
Houses and condos: 930 Renter-occupied apartments: 145
% of renters here:
18%
State:
32%
March 2022 cost of living index in zip code 21557: 89.7 (less than average, U.S. average is 100)
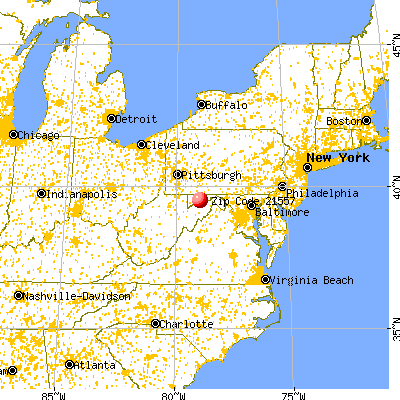
Land area: 26.9 sq. mi. Water area: 0.5 sq. mi.
Population density: 66 people per square mile
(very low).
OSM Map
General Map
Google Map
MSN Map
OSM Map
General Map
Google Map
MSN Map
OSM Map
General Map
Google Map
MSN Map
OSM Map
General Map
Google Map
MSN Map
Please wait while loading the map...
Real estate property taxes paid for housing units in 2022:
This zip code:
0.9% ($1,318)
Maryland:
0.9% ($3,777)
Median real estate property taxes paid for housing units with mortgages in 2022: $1,528 (1.0%) Median real estate property taxes paid for housing units with no mortgage in 2022: $1,022 (0.9%)
Business Search- 14 Million verified businesses
Males: 867
(48.6%)
Females: 915
(51.4%)
For population 25 years and over in 21557:
High school or higher: 85.9%
Bachelor's degree or higher: 20.4%
Graduate or professional degree: 7.9%
Unemployed: 0.6%
Mean travel time to work (commute): 26.7 minutes
For population 15 years and over in 21557:
Never married: 13.9%
Now married: 59.0%
Separated: 8.9%
Widowed: 9.5%
Divorced: 8.7%
Zip code 21557 compared to state average:
Median household income significantly below state average.
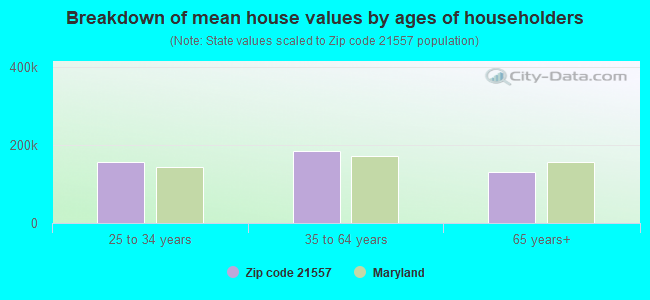
Median house value significantly below state average.
Unemployed percentage significantly below state average.
Black race population percentage significantly below state average.
Hispanic race population percentage significantly below state average.
Median age below state average.
Foreign-born population percentage significantly below state average.
Renting percentage below state average.
Length of stay since moving in above state average.
House age above state average.
Number of college students below state average.
Percentage of population with a bachelor's degree or higher below state average.
Averages for the 2020 tax year for zip code 21557, filed in 2021:
Average Adjusted Gross Income (AGI) in 2020: $51,251 (Individual Income Tax Returns)
Here:
$51,251
State:
$86,905
Salary/wage: $46,950 (reported on 77.1% of returns)
Here:
$46,950
State:
$73,953
(% of AGI for various income ranges: 1065.7% for AGIs below $25k, 3083.5% for AGIs $25k-50k, 5975.5% for AGIs $50k-75k, 8787.5% for AGIs $75k-100k, 22412.5% for AGIs $100k-200k)
Taxable interest for individuals: $619 (reported on 31.3% of returns)
This zip code:
$619
Maryland:
$1,528
(% of AGI for various income ranges: 16.2% for AGIs below $25k, 28.8% for AGIs $25k-50k, 20.9% for AGIs $50k-75k, 46.2% for AGIs $75k-100k, 45.0% for AGIs $100k-200k)
Ordinary dividends: $1,860 (reported on 12.0% of returns)
Here:
$1,860
State:
$8,028
(% of AGI for various income ranges: 39.4% for AGIs $25k-50k, 77.3% for AGIs $50k-75k, 42.5% for AGIs $75k-100k)
Net capital gain/loss in AGI: +$1,362 (reported on 9.6% of returns)
Here:
+$1,362
State:
+$25,238
(% of AGI for various income ranges: 60.0% for AGIs $25k-50k, 8.8% for AGIs $75k-100k)
Profit/loss from business: +$7,471 (reported on 8.4% of returns)
Here:
+$7,471
State:
+$11,398
(% of AGI for various income ranges: 70.5% for AGIs below $25k, 15.3% for AGIs $25k-50k, 436.2% for AGIs $75k-100k)
Taxable individual retirement arrangement distribution: $11,450 (reported on 9.6% of returns)
21557:
$11,450
Maryland:
$20,944
(% of AGI for various income ranges: 42.9% for AGIs below $25k, 125.9% for AGIs $25k-50k, 556.4% for AGIs $50k-75k)
Total itemized deductions: $24,525 (reported on 4.8% of returns)
Here:
$24,525
State:
$30,672
(% of AGI for various income ranges: 1226.2% for AGIs $75k-100k)
Charity contributions: $10,033 (reported on 3.6% of returns)
Here:
$10,033
State:
$9,065
(% of AGI for various income ranges: 273.6% for AGIs $50k-75k)
Taxes paid: $6,625 (reported on 4.8% of returns)
21557:
$6,625
State:
$8,475
(% of AGI for various income ranges: 331.2% for AGIs $75k-100k)
Earned income credit: $2,069 (reported on 15.7% of returns)
Here:
$2,069
State:
$2,151
(% of AGI for various income ranges: 81.0% for AGIs below $25k, 58.2% for AGIs $25k-50k)
Percentage of individuals using paid preparers for their 2020 taxes: 96.4%
Here:
96%
State:
90%
(% for various income ranges: 93.1% for AGIs below $25k, 100.0% for AGIs $25k-50k, 93.3% for AGIs $50k-75k, 100.0% for AGIs $75k-100k, 100.0% for AGIs $100k-200k)
Averages for the 2012 tax year for zip code 21557, filed in 2013:
Average Adjusted Gross Income (AGI) in 2012: $41,582 (Individual Income Tax Returns)
Here:
$41,582
State:
$72,703
Salary/wage: $39,858 (reported on 79.3% of returns)
Here:
$39,858
State:
$62,228
(% of AGI for various income ranges: 61.9% for AGIs below $25k, 68.9% for AGIs $25k-50k, 79.2% for AGIs $50k-75k, 84.1% for AGIs $75k-100k, 79.0% for AGIs $100k-200k)
Taxable interest for individuals: $752 (reported on 37.8% of returns)
This zip code:
$752
Maryland:
$1,413
(% of AGI for various income ranges: 1.2% for AGIs below $25k, 1.2% for AGIs $25k-50k, 0.6% for AGIs $50k-75k, 0.2% for AGIs $75k-100k, 0.5% for AGIs $100k-200k)
Ordinary dividends: $1,409 (reported on 13.4% of returns)
Here:
$1,409
State:
$6,933
(% of AGI for various income ranges: 0.8% for AGIs below $25k, 0.6% for AGIs $25k-50k, 0.3% for AGIs $50k-75k, 0.8% for AGIs $75k-100k)
Profit/loss from business: +$9,971 (reported on 8.5% of returns)
Here:
+$9,971
State:
+$12,606
Taxable individual retirement arrangement distribution: $10,133 (reported on 11.0% of returns)
21557:
$10,133
Maryland:
$17,065
(% of AGI for various income ranges: 2.2% for AGIs below $25k, 7.3% for AGIs $25k-50k, 5.2% for AGIs $75k-100k)
Total itemized deductions: $17,630 (24% of AGI, reported on 28.0% of returns)
Here:
$17,630
State:
$27,886
Here:
24.1% of AGI
State:
22.8% of AGI
(% of AGI for various income ranges: 13.9% for AGIs $25k-50k, 10.9% for AGIs $50k-75k, 15.8% for AGIs $75k-100k, 14.6% for AGIs $100k-200k)
Charity contributions: $2,861 (reported on 22.0% of returns)
Here:
$2,861
State:
$4,452
(% of AGI for various income ranges: 2.0% for AGIs $25k-50k, 1.2% for AGIs $50k-75k, 2.1% for AGIs $75k-100k, 1.7% for AGIs $100k-200k)
Taxes paid: $6,913 (reported on 28.0% of returns)
21557:
$6,913
State:
$11,690
(% of AGI for various income ranges: 3.3% for AGIs $25k-50k, 4.2% for AGIs $50k-75k, 6.4% for AGIs $75k-100k, 7.3% for AGIs $100k-200k)
Earned income credit: $2,064 (reported on 17.1% of returns)
Here:
$2,064
State:
$2,199
(% of AGI for various income ranges: 5.1% for AGIs below $25k, 1.0% for AGIs $25k-50k)
Percentage of individuals using paid preparers for their 2012 taxes: 61.0%
Here:
61%
State:
52%
(% for various income ranges: 58.3% for AGIs below $25k, 64.7% for AGIs $25k-50k, 64.3% for AGIs $50k-75k, 62.5% for AGIs $75k-100k, 57.1% for AGIs $100k-200k)
Averages for the 2004 tax year for zip code 21557, filed in 2005:
Average Adjusted Gross Income (AGI) in 2004: $36,228 (Individual Income Tax Returns)
Here:
$36,228
State:
$60,339
Salary/wage: $33,658 (reported on 84.1% of returns)
Here:
$33,658
State:
$52,211
(% of AGI for various income ranges: 96.1% for AGIs below $10k, 70.2% for AGIs $10k-25k, 77.7% for AGIs $25k-50k, 79.5% for AGIs $50k-75k, 84.4% for AGIs $75k-100k, 73.2% for AGIs over 100k)
Taxable interest for individuals: $766 (reported on 43.8% of returns)
This zip code:
$766
Maryland:
$1,701
(% of AGI for various income ranges: 2.6% for AGIs below $10k, 1.4% for AGIs $10k-25k, 1.0% for AGIs $25k-50k, 1.2% for AGIs $50k-75k, 0.4% for AGIs $75k-100k, 0.2% for AGIs over 100k)
Taxable dividends: $845 (reported on 15.7% of returns)
Here:
$845
State:
$4,235
(% of AGI for various income ranges: 0.8% for AGIs below $10k, 0.6% for AGIs $10k-25k, 0.6% for AGIs $25k-50k, 0.2% for AGIs $50k-75k, 0.2% for AGIs $75k-100k, 0.2% for AGIs over 100k)
Net capital gain/loss: +$302 (reported on 10.5% of returns)
Here:
+$302
State:
+$15,888
(% of AGI for various income ranges: -0.1% for AGIs $10k-25k, 0.1% for AGIs $25k-50k, 0.4% for AGIs $50k-75k, -0.2% for AGIs $75k-100k)
Profit/loss from business: +$8,154 (reported on 11.1% of returns)
Here:
+$8,154
State:
+$12,221
(% of AGI for various income ranges: 4.1% for AGIs below $10k, 3.1% for AGIs $10k-25k, 0.6% for AGIs $25k-50k, 4.2% for AGIs $50k-75k, 3.9% for AGIs $75k-100k)
IRA payment deduction: $2,250 (reported on 1.5% of returns)
21557:
$2,250
Maryland:
$2,968
Total itemized deductions: $14,597 (22% of AGI, reported on 27.6% of returns)
Here:
$14,597
State:
$22,960
Here:
21.6% of AGI
State:
23.3% of AGI
(% of AGI for various income ranges: 5.4% for AGIs $10k-25k, 8.8% for AGIs $25k-50k, 12.2% for AGIs $50k-75k, 14.7% for AGIs $75k-100k, 15.5% for AGIs over 100k)
Charity contributions deductions: $2,319 (3% of AGI, reported on 22.6% of returns)
Here:
$2,319
State:
$4,031
Here:
3.4% of AGI
State:
3.9% of AGI
(% of AGI for various income ranges: 1.2% for AGIs $10k-25k, 0.9% for AGIs $25k-50k, 1.8% for AGIs $50k-75k, 1.6% for AGIs $75k-100k, 2.0% for AGIs over 100k)
Total tax: $4,216 (reported on 73.3% of returns)
21557:
$4,216
State:
$10,167
(% of AGI for various income ranges: 2.0% for AGIs below $10k, 3.6% for AGIs $10k-25k, 6.2% for AGIs $25k-50k, 8.8% for AGIs $50k-75k, 9.8% for AGIs $75k-100k, 16.0% for AGIs over 100k)
Earned income credit: $1,519 (reported on 16.2% of returns)
Here:
$1,519
State:
$1,700
Percentage of individuals using paid preparers for their 2004 taxes: 58.7%
Here:
59%
State:
55%
(% for various income ranges: 55.8% for AGIs below $10k, 54.9% for AGIs $10k-25k, 59.3% for AGIs $25k-50k, 61.9% for AGIs $50k-75k, 69.4% for AGIs $75k-100k, 61.3% for AGIs over 100k)
Household received Food Stamps/SNAP in the past 12 months: 242 Household did not receive Food Stamps/SNAP in the past 12 months: 601
Women who did not have a birth in the past 12 months: 381 (240 now married, 141 unmarried)
Housing units in zip code 21557 with a mortgage: 376 (16 second mortgage, 17 both second mortgage and home equity loan) Median monthly owner costs for units with a mortgage: $1,039 Median monthly owner costs for units without a mortgage: $418
Residents with income below the poverty level in 2022:
This zip code:
13.5%
Whole state:
9.6%
Residents with income below 50% of the poverty level in 2022:
This zip code:
4.1%
Whole state:
4.7%
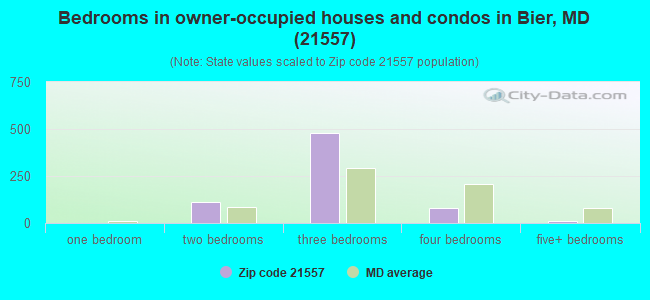
Median number of rooms in houses and condos:
Here:
6.4
State:
7.3
Notable locations in this zip code not listed on our city pages
Size of family households: 130 2-persons, 53 3-persons, 105 4-persons, 112 5-persons
Size of nonfamily households: 405 1-person, 19 2-persons
414 married couples with children.
21 single-parent households (21 women).
97.1% of residents of 21557 zip code speak English at home.
1.1% of residents speak Spanish at home (100% very well).
0.5% of residents speak other Indo-European language at home (100% very well).
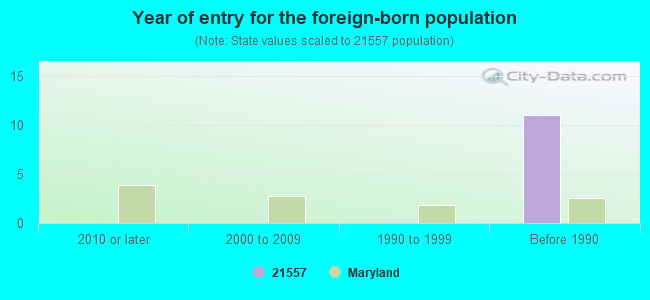
Foreign born population: 0 (0.0%)
:
0.0%
Whole state:
16.7%
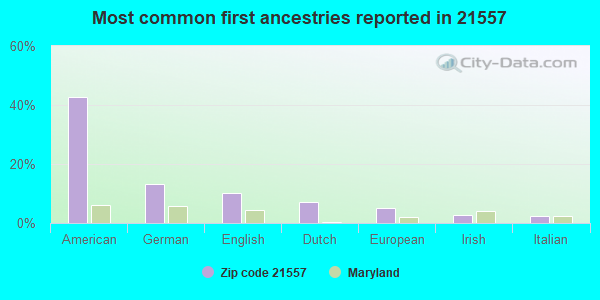
43%American
13%German
10%English
7%Dutch
5%European
3%Irish
3%Italian
Year of entry for the foreign-born population
02010 or later
02000 to 2009
01990 to 1999
11Before 1990
Facilities with environmental interests located in this zip code:
BIERS LANE WWTP (BIERS LANE in RAWLINGS, MD)
STATE MASTER (Maryland Permits tracking) - NPDES NON-MAJOR National Pollutant Discharge Elimination System NON-MAJOR (Tracking pollutant discharge elimination systems) - permit Business SIC classification: SEWERAGE SYSTEMS
RAWLINGS WWTP (CONDA WAY EXTENDED in RAWLINGS, MD)
STATE MASTER (Maryland Permits tracking) - NPDES NON-MAJOR National Pollutant Discharge Elimination System NON-MAJOR (Tracking pollutant discharge elimination systems) - permit Business SIC classification: SEWERAGE SYSTEMS Alternative names: RAWLINGS, IMPROVEMENT ASSOC.
MILLERS AUTOMOTIVE (19702 SW MC MULLEN HWY in RAWLINGS, MD)
Conditionally Exempt Small Quantity Generators, less than 100 kg/month of hazardous waste (Resource Conservation and Recovery Act (tracking hazardous waste)) - notification Organizations: JAMES MILLER (CONTACT/OWNER)
Housing units lacking complete plumbing facilities: 7.1% Housing units lacking complete kitchen facilities: 3.1%
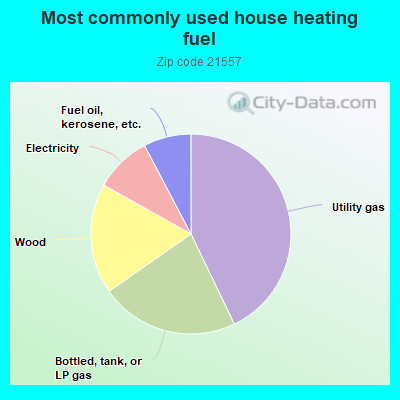
43.0%Utility gas
22.5%Bottled, tank, or LP gas
17.9%Wood
9.2%Electricity
7.7%Fuel oil, kerosene, etc.
Population in 1990: 1,919. Population change in the 1990s: +174 (+9.1%).
Place of birth for U.S.-born residents:
This state: 1,208
Northeast: 76
Midwest: 73
South: 365
West: 29
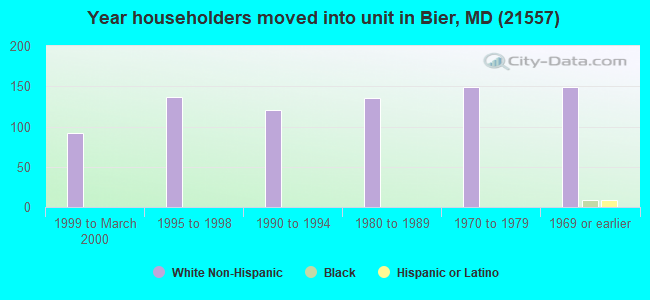
67% of the 21557 zip code residents lived in the same house 5 years ago. Out of people who lived in different houses, 62% lived in this county. Out of people who lived in different counties, 50% lived in Maryland.
100% of the 21557 zip code residents lived in the same house 1 year ago.
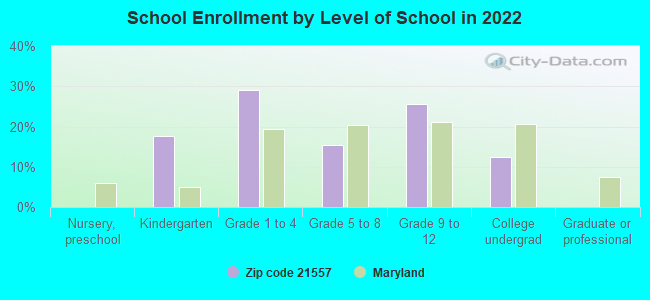
Private vs. public school enrollment:
Students in private schools in grades 1 to 8 (elementary and middle school):
Here:
0.0%
Maryland:
15.2%
Students in private schools in grades 9 to 12 (high school):
Here:
0.0%
Maryland:
14.4%
Students in private undergraduate colleges:
Here:
0.0%
Maryland:
20.2%
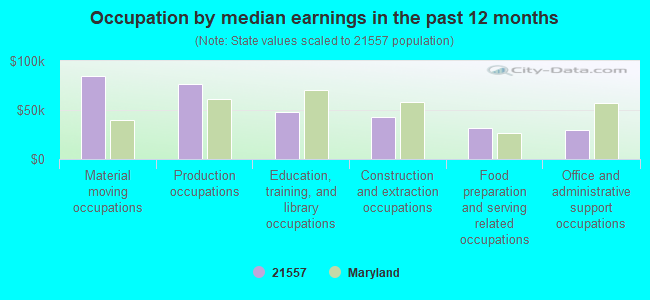
Occupation by median earnings in the past 12 months ($)
84,945Material moving occupations
76,584Production occupations
47,796Education, training, and library occupations
43,192Construction and extraction occupations
31,927Food preparation and serving related occupations
29,878Office and administrative support occupations
Top industries in this zip code by the number of employees in 2005:
Health Care and Social Assistance: Offices of Physicians (except Mental Health Specialists) (10-19 employees: 1 establishment, 1-4 employees: 1 establishment)
Arts, Entertainment, and Recreation: Golf Courses and Country Clubs (10-19: 1)
Other Services (except Public Administration): Commercial and Industrial Machinery and Equipment (except Automotive and Electronic) Repair and Maintenance (5-9: 1)
Professional, Scientific, and Technical Services: Veterinary Services (5-9: 1)
Other Services (except Public Administration): All Other Personal Services (5-9: 1)
Arts, Entertainment, and Recreation: Other Gambling Industries (5-9: 1)
Other Services (except Public Administration): Religious Organizations (1-4: 3)
Fatal accident statistics in 2012:
Fatal accident count: 1
Vehicles involved in fatal accidents: 2
Fatal accidents caused by drunken drivers: 0
Fatalities: 1
Persons involved in fatal accidents: 2
Pedestrians involved in fatal accidents: 0
Home Mortgage Disclosure Act Aggregated Statistics For Year 2009 (Based on 4 partial tracts)
A) FHA, FSA/RHS & VA Home Purchase Loans
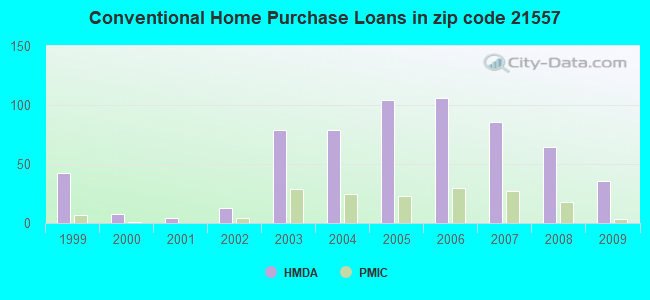
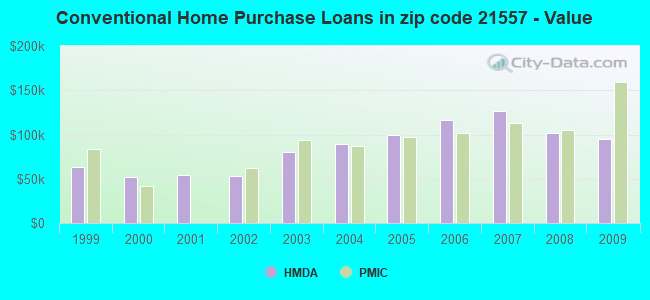
B) Conventional Home Purchase Loans
C) Refinancings
D) Home Improvement Loans
E) Loans on Dwellings For 5+ Families
F) Non-occupant Loans on < 5 Family Dwellings (A B C & D)
G) Loans On Manufactured Home Dwelling (A B C & D)
Number
Average Value
Number
Average Value
Number
Average Value
Number
Average Value
Number
Average Value
Number
Average Value
Number
Average Value
LOANS ORIGINATED
39
$115,197
36
$95,259
165
$125,871
31
$37,176
3
$183,037
3
$60,947
4
$44,692
APPLICATIONS APPROVED, NOT ACCEPTED
0
$0
2
$48,465
9
$159,780
0
$0
0
$0
0
$0
0
$0
APPLICATIONS DENIED
0
$0
7
$66,599
50
$112,058
10
$27,460
0
$0
5
$62,864
3
$77,303
APPLICATIONS WITHDRAWN
1
$201,250
0
$0
36
$104,760
0
$0
0
$0
1
$79,970
0
$0
FILES CLOSED FOR INCOMPLETENESS
0
$0
0
$0
2
$155,965
0
$0
0
$0
0
$0
0
$0
Aggregated Statistics For Year 2008 (Based on 4 partial tracts)
A) FHA, FSA/RHS & VA Home Purchase Loans
B) Conventional Home Purchase Loans
C) Refinancings
D) Home Improvement Loans
E) Loans on Dwellings For 5+ Families
F) Non-occupant Loans on < 5 Family Dwellings (A B C & D)
G) Loans On Manufactured Home Dwelling (A B C & D)
Number
Average Value
Number
Average Value
Number
Average Value
Number
Average Value
Number
Average Value
Number
Average Value
Number
Average Value
LOANS ORIGINATED
33
$124,192
64
$101,810
121
$128,410
41
$32,538
2
$2,019,380
8
$63,905
10
$50,289
APPLICATIONS APPROVED, NOT ACCEPTED
1
$83,700
10
$135,179
16
$139,060
3
$58,223
0
$0
0
$0
0
$0
APPLICATIONS DENIED
4
$105,118
15
$114,935
83
$121,136
27
$32,046
0
$0
2
$101,085
4
$27,148
APPLICATIONS WITHDRAWN
1
$251,900
6
$72,727
35
$128,821
6
$119,168
0
$0
0
$0
3
$37,763
FILES CLOSED FOR INCOMPLETENESS
2
$131,585
2
$169,895
8
$129,792
3
$30,653
0
$0
2
$99,775
0
$0
Aggregated Statistics For Year 2007 (Based on 4 partial tracts)
A) FHA, FSA/RHS & VA Home Purchase Loans
B) Conventional Home Purchase Loans
C) Refinancings
D) Home Improvement Loans
F) Non-occupant Loans on < 5 Family Dwellings (A B C & D)
G) Loans On Manufactured Home Dwelling (A B C & D)
Number
Average Value
Number
Average Value
Number
Average Value
Number
Average Value
Number
Average Value
Number
Average Value
LOANS ORIGINATED
16
$117,395
86
$126,074
145
$109,632
57
$29,970
17
$84,039
14
$47,529
APPLICATIONS APPROVED, NOT ACCEPTED
0
$0
8
$109,875
28
$136,283
5
$23,990
0
$0
1
$39,980
APPLICATIONS DENIED
3
$114,493
14
$79,555
136
$110,218
36
$66,455
2
$91,570
8
$60,590
APPLICATIONS WITHDRAWN
0
$0
7
$83,214
78
$116,625
7
$108,414
1
$39,980
4
$124,748
FILES CLOSED FOR INCOMPLETENESS
0
$0
3
$152,713
13
$188,367
2
$38,895
0
$0
0
$0
Aggregated Statistics For Year 2006 (Based on 4 partial tracts)
A) FHA, FSA/RHS & VA Home Purchase Loans
B) Conventional Home Purchase Loans
C) Refinancings
D) Home Improvement Loans
F) Non-occupant Loans on < 5 Family Dwellings (A B C & D)
G) Loans On Manufactured Home Dwelling (A B C & D)
Number
Average Value
Number
Average Value
Number
Average Value
Number
Average Value
Number
Average Value
Number
Average Value
LOANS ORIGINATED
20
$83,050
106
$116,048
147
$107,097
53
$33,517
17
$53,214
6
$105,530
APPLICATIONS APPROVED, NOT ACCEPTED
0
$0
14
$107,144
17
$116,208
8
$69,108
1
$174,600
3
$70,807
APPLICATIONS DENIED
0
$0
26
$93,720
145
$94,849
38
$46,926
8
$41,170
5
$131,884
APPLICATIONS WITHDRAWN
2
$89,350
9
$135,812
127
$112,973
5
$55,668
0
$0
1
$130,610
FILES CLOSED FOR INCOMPLETENESS
0
$0
4
$129,282
36
$123,155
1
$53,310
0
$0
1
$97,290
Aggregated Statistics For Year 2005 (Based on 4 partial tracts)
A) FHA, FSA/RHS & VA Home Purchase Loans
B) Conventional Home Purchase Loans
C) Refinancings
D) Home Improvement Loans
F) Non-occupant Loans on < 5 Family Dwellings (A B C & D)
G) Loans On Manufactured Home Dwelling (A B C & D)
Number
Average Value
Number
Average Value
Number
Average Value
Number
Average Value
Number
Average Value
Number
Average Value
LOANS ORIGINATED
17
$99,800
104
$99,031
171
$83,983
40
$30,166
16
$56,832
5
$62,908
APPLICATIONS APPROVED, NOT ACCEPTED
1
$117,290
12
$127,362
36
$93,202
7
$68,186
0
$0
4
$62,308
APPLICATIONS DENIED
5
$96,228
32
$58,031
147
$93,351
33
$40,286
7
$33,774
12
$38,962
APPLICATIONS WITHDRAWN
1
$203,920
16
$90,564
117
$94,988
17
$80,688
6
$74,330
1
$93,300
FILES CLOSED FOR INCOMPLETENESS
1
$197,250
4
$83,968
25
$114,882
0
$0
0
$0
0
$0
Aggregated Statistics For Year 2004 (Based on 4 partial tracts)
A) FHA, FSA/RHS & VA Home Purchase Loans
B) Conventional Home Purchase Loans
C) Refinancings
D) Home Improvement Loans
E) Loans on Dwellings For 5+ Families
F) Non-occupant Loans on < 5 Family Dwellings (A B C & D)
G) Loans On Manufactured Home Dwelling (A B C & D)
Number
Average Value
Number
Average Value
Number
Average Value
Number
Average Value
Number
Average Value
Number
Average Value
Number
Average Value
LOANS ORIGINATED
13
$88,815
79
$89,030
187
$74,488
38
$41,366
1
$1,865,920
11
$70,951
18
$51,587
APPLICATIONS APPROVED, NOT ACCEPTED
0
$0
11
$79,545
48
$91,687
5
$53,770
0
$0
0
$0
2
$75,845
APPLICATIONS DENIED
2
$40,230
34
$54,131
153
$80,212
30
$31,075
0
$0
5
$85,706
17
$27,875
APPLICATIONS WITHDRAWN
4
$61,872
10
$96,595
131
$91,315
4
$75,765
0
$0
7
$72,113
2
$44,680
FILES CLOSED FOR INCOMPLETENESS
0
$0
0
$0
15
$80,490
7
$51,286
0
$0
0
$0
0
$0
Aggregated Statistics For Year 2003 (Based on 4 partial tracts)
A) FHA, FSA/RHS & VA Home Purchase Loans
B) Conventional Home Purchase Loans
C) Refinancings
D) Home Improvement Loans
E) Loans on Dwellings For 5+ Families
F) Non-occupant Loans on < 5 Family Dwellings (A B C & D)
Number
Average Value
Number
Average Value
Number
Average Value
Number
Average Value
Number
Average Value
Number
Average Value
LOANS ORIGINATED
25
$92,486
79
$80,582
352
$82,424
25
$17,916
1
$230,570
12
$57,023
APPLICATIONS APPROVED, NOT ACCEPTED
3
$65,307
9
$87,629
49
$90,017
4
$24,990
0
$0
1
$58,640
APPLICATIONS DENIED
1
$38,290
16
$56,789
140
$79,340
15
$10,525
0
$0
4
$38,818
APPLICATIONS WITHDRAWN
0
$0
7
$80,139
68
$79,471
5
$26,506
0
$0
2
$38,890
FILES CLOSED FOR INCOMPLETENESS
0
$0
1
$171,930
11
$108,446
0
$0
0
$0
2
$66,670
Aggregated Statistics For Year 2002 (Based on 2 partial tracts)
A) FHA, FSA/RHS & VA Home Purchase Loans
B) Conventional Home Purchase Loans
C) Refinancings
D) Home Improvement Loans
F) Non-occupant Loans on < 5 Family Dwellings (A B C & D)
Number
Average Value
Number
Average Value
Number
Average Value
Number
Average Value
Number
Average Value
LOANS ORIGINATED
5
$64,644
13
$53,287
29
$59,089
6
$21,518
2
$28,050
APPLICATIONS APPROVED, NOT ACCEPTED
0
$0
0
$0
4
$90,488
1
$6,230
0
$0
APPLICATIONS DENIED
0
$0
3
$49,567
24
$56,002
3
$5,490
0
$0
APPLICATIONS WITHDRAWN
0
$0
0
$0
18
$57,752
0
$0
0
$0
FILES CLOSED FOR INCOMPLETENESS
0
$0
0
$0
1
$97,050
0
$0
0
$0
Aggregated Statistics For Year 2001 (Based on 2 partial tracts)
A) FHA, FSA/RHS & VA Home Purchase Loans
B) Conventional Home Purchase Loans
C) Refinancings
D) Home Improvement Loans
F) Non-occupant Loans on < 5 Family Dwellings (A B C & D)
Number
Average Value
Number
Average Value
Number
Average Value
Number
Average Value
Number
Average Value
LOANS ORIGINATED
5
$60,370
4
$54,648
18
$59,162
6
$11,055
1
$20,920
APPLICATIONS APPROVED, NOT ACCEPTED
0
$0
0
$0
2
$31,610
0
$0
0
$0
APPLICATIONS DENIED
1
$42,740
1
$26,270
15
$50,278
5
$7,746
0
$0
APPLICATIONS WITHDRAWN
0
$0
0
$0
12
$67,114
1
$30,270
0
$0
FILES CLOSED FOR INCOMPLETENESS
0
$0
0
$0
2
$50,755
0
$0
0
$0
Aggregated Statistics For Year 2000 (Based on 2 partial tracts)
A) FHA, FSA/RHS & VA Home Purchase Loans
B) Conventional Home Purchase Loans
C) Refinancings
D) Home Improvement Loans
F) Non-occupant Loans on < 5 Family Dwellings (A B C & D)
Number
Average Value
Number
Average Value
Number
Average Value
Number
Average Value
Number
Average Value
LOANS ORIGINATED
4
$60,435
8
$52,032
12
$49,306
8
$19,922
1
$44,070
APPLICATIONS APPROVED, NOT ACCEPTED
0
$0
1
$32,050
3
$55,203
1
$6,680
0
$0
APPLICATIONS DENIED
0
$0
3
$25,673
13
$48,732
5
$13,000
0
$0
APPLICATIONS WITHDRAWN
0
$0
0
$0
6
$48,155
0
$0
0
$0
FILES CLOSED FOR INCOMPLETENESS
0
$0
0
$0
2
$22,035
0
$0
0
$0
Aggregated Statistics For Year 1999 (Based on 2 partial tracts)
A) FHA, FSA/RHS & VA Home Purchase Loans
B) Conventional Home Purchase Loans
C) Refinancings
D) Home Improvement Loans
E) Loans on Dwellings For 5+ Families
F) Non-occupant Loans on < 5 Family Dwellings (A B C & D)
Detailed PMIC statistics for the following Tracts:0020.00
, 0022.00
2002 - 2018 National Fire Incident Reporting System (NFIRS) incidents
According to the data from the years 2002 - 2018 the average number of fire incidents per year is 13. The highest number of fires - 26 took place in 2016, and the least - 0 in 2006. The data has a constant trend.
When looking into fire subcategories, the most reports belonged to: Structure Fires (55.7%), and Outside Fires (28.5%).
Fire incident types reported to NFIRS in Zip Code 21557


 Nearest zip codes: 21539, 21542, 21521, 21562, 21543, 21532.
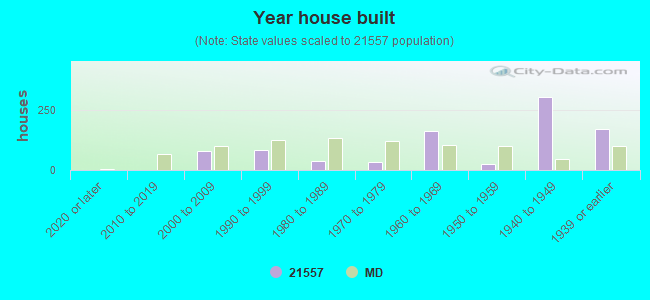


 According to the data from the years 2002 - 2018 the average number of fire incidents per year is 13. The highest number of fires - 26 took place in 2016, and the least - 0 in 2006. The data has a constant trend.
 When looking into fire subcategories, the most reports belonged to: Structure Fires (55.7%), and Outside Fires (28.5%).