Estimated zip code population in 2022: 1,685 Zip code population in 2010: 2,301 Zip code population in 2000: 2,265
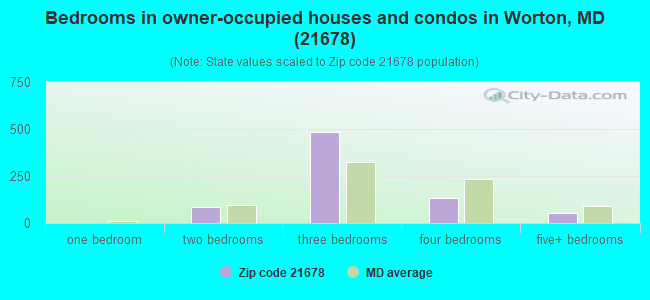
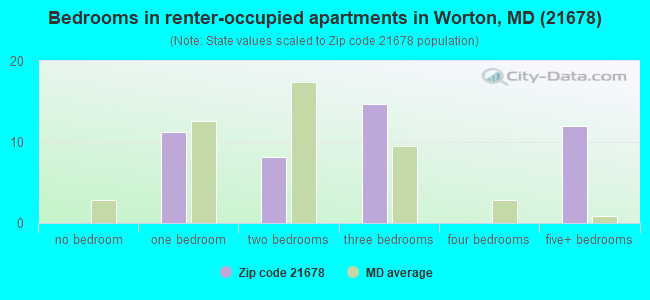
Houses and condos: 1,018 Renter-occupied apartments: 45
% of renters here:
6%
State:
32%
March 2022 cost of living index in zip code 21678: 90.4 (less than average, U.S. average is 100)
Land area: 37.6 sq. mi. Water area: 4.9 sq. mi.
Population density: 45 people per square mile
(very low).
OSM Map
General Map
Google Map
MSN Map
OSM Map
General Map
Google Map
MSN Map
OSM Map
General Map
Google Map
MSN Map
OSM Map
General Map
Google Map
MSN Map
Please wait while loading the map...
Real estate property taxes paid for housing units in 2022:
This zip code:
0.9% ($2,668)
Maryland:
0.9% ($3,777)
Median real estate property taxes paid for housing units with mortgages in 2022: $2,143 (0.7%) Median real estate property taxes paid for housing units with no mortgage in 2022: $3,619 (1.1%)
Averages for the 2020 tax year for zip code 21678, filed in 2021:
Average Adjusted Gross Income (AGI) in 2020: $69,457 (Individual Income Tax Returns)
Here:
$69,457
State:
$86,905
Salary/wage: $52,758 (reported on 79.5% of returns)
Here:
$52,758
State:
$73,953
(% of AGI for various income ranges: 1323.3% for AGIs below $25k, 3638.0% for AGIs $25k-50k, 6046.4% for AGIs $50k-75k, 10766.0% for AGIs $75k-100k, 15406.0% for AGIs $100k-200k)
Taxable interest for individuals: $1,019 (reported on 35.9% of returns)
This zip code:
$1,019
Maryland:
$1,528
(% of AGI for various income ranges: 10.5% for AGIs below $25k, 15.6% for AGIs $25k-50k, 85.5% for AGIs $50k-75k, 48.0% for AGIs $75k-100k, 218.0% for AGIs $100k-200k)
Ordinary dividends: $4,816 (reported on 21.4% of returns)
Here:
$4,816
State:
$8,028
(% of AGI for various income ranges: 30.0% for AGIs below $25k, 36.8% for AGIs $25k-50k, 115.5% for AGIs $50k-75k, 300.0% for AGIs $75k-100k, 358.0% for AGIs $100k-200k)
Net capital gain/loss in AGI: +$7,291 (reported on 18.8% of returns)
Here:
+$7,291
State:
+$25,238
(% of AGI for various income ranges: 11.0% for AGIs below $25k, 11.6% for AGIs $25k-50k, 35.5% for AGIs $50k-75k, 424.0% for AGIs $75k-100k, 549.0% for AGIs $100k-200k)
Profit/loss from business: +$14,664 (reported on 18.8% of returns)
Here:
+$14,664
State:
+$11,398
(% of AGI for various income ranges: 109.5% for AGIs below $25k, 46.8% for AGIs $25k-50k, 494.5% for AGIs $50k-75k, 1460.0% for AGIs $75k-100k, 1605.0% for AGIs $100k-200k)
Taxable individual retirement arrangement distribution: $23,764 (reported on 12.0% of returns)
21678:
$23,764
Maryland:
$20,944
(% of AGI for various income ranges: 133.2% for AGIs $25k-50k, 640.9% for AGIs $50k-75k, 2289.0% for AGIs $100k-200k)
Total itemized deductions: $27,131 (reported on 11.1% of returns)
Here:
$27,131
State:
$30,672
(% of AGI for various income ranges: 830.9% for AGIs $50k-75k, 1090.0% for AGIs $75k-100k, 1263.0% for AGIs $100k-200k)
Charity contributions: $5,982 (reported on 9.4% of returns)
Here:
$5,982
State:
$9,065
(% of AGI for various income ranges: 179.1% for AGIs $50k-75k, 292.0% for AGIs $100k-200k)
Taxes paid: $8,500 (reported on 11.1% of returns)
21678:
$8,500
State:
$8,475
(% of AGI for various income ranges: 46.7% for AGIs below $25k, 143.6% for AGIs $50k-75k, 372.0% for AGIs $75k-100k, 425.0% for AGIs $100k-200k)
Earned income credit: $2,013 (reported on 13.7% of returns)
Here:
$2,013
State:
$2,151
(% of AGI for various income ranges: 87.6% for AGIs below $25k, 55.2% for AGIs $25k-50k)
Percentage of individuals using paid preparers for their 2020 taxes: 91.5%
Here:
91%
State:
90%
(% for various income ranges: 88.6% for AGIs below $25k, 93.8% for AGIs $25k-50k, 93.8% for AGIs $50k-75k, 90.0% for AGIs $75k-100k, 94.4% for AGIs $100k-200k, 83.3% for AGIs over 200k)
Averages for the 2012 tax year for zip code 21678, filed in 2013:
Average Adjusted Gross Income (AGI) in 2012: $60,000 (Individual Income Tax Returns)
Here:
$60,000
State:
$72,703
Salary/wage: $40,232 (reported on 80.8% of returns)
Here:
$40,232
State:
$62,228
(% of AGI for various income ranges: 69.7% for AGIs below $25k, 77.2% for AGIs $25k-50k, 64.7% for AGIs $50k-75k, 70.8% for AGIs $75k-100k, 73.7% for AGIs $100k-200k)
Taxable interest for individuals: $1,250 (reported on 38.5% of returns)
This zip code:
$1,250
Maryland:
$1,413
(% of AGI for various income ranges: 1.4% for AGIs below $25k, 0.2% for AGIs $25k-50k, 1.0% for AGIs $50k-75k, 0.4% for AGIs $75k-100k, 0.6% for AGIs $100k-200k, 1.3% for AGIs over 200k)
Ordinary dividends: $5,713 (reported on 22.1% of returns)
Here:
$5,713
State:
$6,933
(% of AGI for various income ranges: 1.5% for AGIs below $25k, 0.3% for AGIs $25k-50k, 2.7% for AGIs $50k-75k, 2.1% for AGIs $75k-100k, 5.2% for AGIs $100k-200k)
Net capital gain/loss in AGI: +$5,388 (reported on 15.4% of returns)
Here:
+$5,388
State:
+$14,830
(% of AGI for various income ranges: 0.3% for AGIs $50k-75k, 0.6% for AGIs $75k-100k, 5.2% for AGIs $100k-200k)
Profit/loss from business: +$12,090 (reported on 19.2% of returns)
Here:
+$12,090
State:
+$12,606
(% of AGI for various income ranges: 7.9% for AGIs below $25k, 5.8% for AGIs $25k-50k, 3.0% for AGIs $50k-75k, 1.5% for AGIs $75k-100k, 7.0% for AGIs $100k-200k)
Taxable individual retirement arrangement distribution: $29,743 (reported on 13.5% of returns)
21678:
$29,743
Maryland:
$17,065
(% of AGI for various income ranges: 3.3% for AGIs below $25k, 2.2% for AGIs $25k-50k, 8.0% for AGIs $50k-75k, 20.1% for AGIs $100k-200k)
Total itemized deductions: $23,012 (21% of AGI, reported on 38.5% of returns)
Here:
$23,012
State:
$27,886
Here:
20.9% of AGI
State:
22.8% of AGI
(% of AGI for various income ranges: 9.0% for AGIs below $25k, 12.8% for AGIs $25k-50k, 17.8% for AGIs $50k-75k, 15.8% for AGIs $75k-100k, 17.5% for AGIs $100k-200k, 12.8% for AGIs over 200k)
Charity contributions: $3,850 (reported on 30.8% of returns)
Here:
$3,850
State:
$4,452
(% of AGI for various income ranges: 1.3% for AGIs below $25k, 1.6% for AGIs $25k-50k, 2.0% for AGIs $50k-75k, 1.2% for AGIs $75k-100k, 2.2% for AGIs $100k-200k, 2.6% for AGIs over 200k)
Taxes paid: $10,675 (reported on 38.5% of returns)
21678:
$10,675
State:
$11,690
(% of AGI for various income ranges: 2.4% for AGIs below $25k, 3.3% for AGIs $25k-50k, 6.6% for AGIs $50k-75k, 6.8% for AGIs $75k-100k, 8.1% for AGIs $100k-200k, 9.4% for AGIs over 200k)
Earned income credit: $2,137 (reported on 18.3% of returns)
Here:
$2,137
State:
$2,199
(% of AGI for various income ranges: 6.2% for AGIs below $25k, 1.1% for AGIs $25k-50k)
Percentage of individuals using paid preparers for their 2012 taxes: 54.8%
Here:
55%
State:
52%
(% for various income ranges: 47.4% for AGIs below $25k, 50.0% for AGIs $25k-50k, 69.2% for AGIs $50k-75k, 60.0% for AGIs $75k-100k, 66.7% for AGIs $100k-200k, 66.7% for AGIs over 200k)
Averages for the 2004 tax year for zip code 21678, filed in 2005:
Average Adjusted Gross Income (AGI) in 2004: $44,208 (Individual Income Tax Returns)
Here:
$44,208
State:
$60,339
Salary/wage: $34,746 (reported on 83.6% of returns)
Here:
$34,746
State:
$52,211
(% of AGI for various income ranges: 108.3% for AGIs below $10k, 72.7% for AGIs $10k-25k, 79.8% for AGIs $25k-50k, 77.8% for AGIs $50k-75k, 78.6% for AGIs $75k-100k, 42.3% for AGIs over 100k)
Taxable interest for individuals: $1,924 (reported on 49.7% of returns)
This zip code:
$1,924
Maryland:
$1,701
(% of AGI for various income ranges: 4.1% for AGIs below $10k, 3.3% for AGIs $10k-25k, 1.6% for AGIs $25k-50k, 1.1% for AGIs $50k-75k, 0.8% for AGIs $75k-100k, 3.2% for AGIs over 100k)
Taxable dividends: $3,965 (reported on 27.0% of returns)
Here:
$3,965
State:
$4,235
(% of AGI for various income ranges: 3.9% for AGIs below $10k, 1.9% for AGIs $10k-25k, 1.4% for AGIs $25k-50k, 1.6% for AGIs $50k-75k, 2.5% for AGIs $75k-100k, 3.4% for AGIs over 100k)
Net capital gain/loss: +$10,665 (reported on 19.9% of returns)
Here:
+$10,665
State:
+$15,888
(% of AGI for various income ranges: -2.0% for AGIs below $10k, 0.6% for AGIs $10k-25k, 0.2% for AGIs $25k-50k, 2.3% for AGIs $50k-75k, 2.0% for AGIs $75k-100k, 11.3% for AGIs over 100k)
Profit/loss from business: +$19,006 (reported on 15.0% of returns)
Here:
+$19,006
State:
+$12,221
(% of AGI for various income ranges: 5.6% for AGIs below $10k, 8.2% for AGIs $10k-25k, 2.6% for AGIs $25k-50k, 4.1% for AGIs $50k-75k, 3.2% for AGIs $75k-100k, 10.6% for AGIs over 100k)
IRA payment deduction: $3,364 (reported on 3.1% of returns)
21678:
$3,364
Maryland:
$2,968
Self-employed pension: $14,333 (reported on 1.1% of returns)
Here:
$14,333
Maryland:
$17,155
Total itemized deductions: $18,326 (23% of AGI, reported on 37.5% of returns)
Here:
$18,326
State:
$22,960
Here:
23.3% of AGI
State:
23.3% of AGI
(% of AGI for various income ranges: 13.7% for AGIs below $10k, 12.3% for AGIs $10k-25k, 14.4% for AGIs $25k-50k, 16.0% for AGIs $50k-75k, 15.9% for AGIs $75k-100k, 16.8% for AGIs over 100k)
Charity contributions deductions: $3,275 (4% of AGI, reported on 31.4% of returns)
Here:
$3,275
State:
$4,031
Here:
3.9% of AGI
State:
3.9% of AGI
(% of AGI for various income ranges: 1.1% for AGIs $10k-25k, 1.7% for AGIs $25k-50k, 2.2% for AGIs $50k-75k, 2.0% for AGIs $75k-100k, 3.3% for AGIs over 100k)
Total tax: $6,303 (reported on 76.6% of returns)
21678:
$6,303
State:
$10,167
(% of AGI for various income ranges: 3.5% for AGIs below $10k, 4.5% for AGIs $10k-25k, 6.9% for AGIs $25k-50k, 8.8% for AGIs $50k-75k, 9.7% for AGIs $75k-100k, 16.8% for AGIs over 100k)
Earned income credit: $1,708 (reported on 15.1% of returns)
Here:
$1,708
State:
$1,700
Percentage of individuals using paid preparers for their 2004 taxes: 61.5%
Here:
61%
State:
55%
(% for various income ranges: 52.3% for AGIs below $10k, 62.5% for AGIs $10k-25k, 59.8% for AGIs $25k-50k, 62.3% for AGIs $50k-75k, 61.9% for AGIs $75k-100k, 81.0% for AGIs over 100k)
Likely homosexual households (counted as self-reported same-sex unmarried-partner households)
Lesbian couples: 1.7% of all households
Gay men: 0.0% of all households
Household received Food Stamps/SNAP in the past 12 months: 43 Household did not receive Food Stamps/SNAP in the past 12 months: 752
Women who had a birth in the past 12 months: 5 (5 now married, 0 unmarried) Women who did not have a birth in the past 12 months: 376 (192 now married, 184 unmarried)
Housing units in zip code 21678 with a mortgage: 505 (18 second mortgage, 6 home equity loan, 12 both second mortgage and home equity loan) Median monthly owner costs for units with a mortgage: $1,401 Median monthly owner costs for units without a mortgage: $773
Residents with income below the poverty level in 2022:
This zip code:
8.6%
Whole state:
9.6%
Residents with income below 50% of the poverty level in 2022:
This zip code:
1.7%
Whole state:
4.7%
Median number of rooms in houses and condos:
Here:
6.4
State:
7.3
Median number of rooms in apartments:
Here:
7.2
State:
4.2
Notable locations in this zip code not listed on our city pages
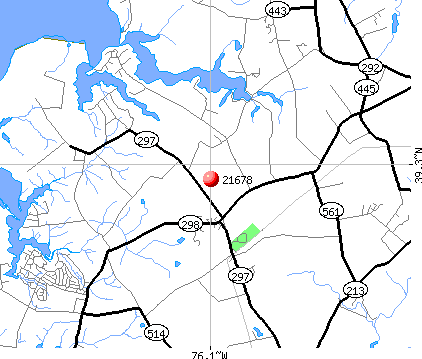
Notable locations in zip code 21678: Camp Echo Hill (A), Fishing Valley Landing (B), Gales Wharf (C), Blooming Turkey Farm (D), Camp TockwoghYMCA (E), Churn Creek Farm (F), Harris Wharf (G), Still Pond Station (H), Easton Volunteer Fire Department (I), Camp Tockwogh Maintenance Office (J). Display/hide their locations on the map
Churches in zip code 21678 include: Christ Church (A), Fountain Church (B), Mount Olive Church (C), Saint Georges Church (D), Saint James Church (E), Union Church (F), Lynch United Methodist Church (G). Display/hide their locations on the map
In group quarters: 49 (-1 institutionalized population)
Size of family households: 281 2-persons, 141 3-persons, 84 4-persons
Size of nonfamily households: 231 1-person, 68 2-persons
112 married couples with children.
102 single-parent households (20 men, 82 women).
97.6% of residents of 21678 zip code speak English at home.
0.7% of residents speak Spanish at home (100% very well).
0.5% of residents speak other Indo-European language at home (100% very well).
0.5% of residents speak Asian or Pacific Island language at home (100% well).
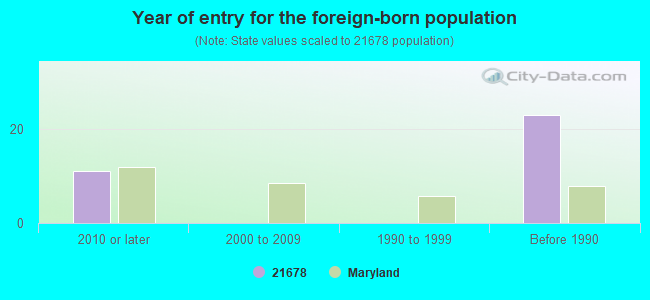
Foreign born population: 13 (0.8%) (30.9% of them are naturalized citizens)
This zip code:
0.8%
Whole state:
16.7%
69%China, excluding Hong Kong and Taiwan
31%Honduras
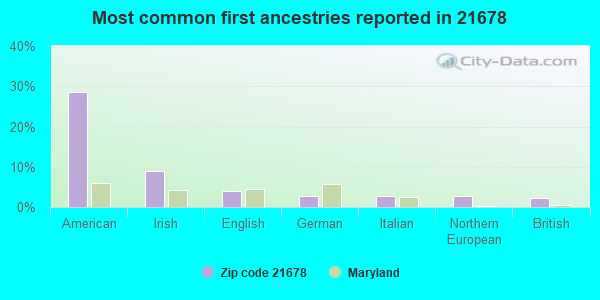
29%American
9%Irish
4%English
3%German
3%Italian
3%Northern European
2%British
Year of entry for the foreign-born population
112010 or later
02000 to 2009
01990 to 1999
23Before 1990
Facilities with environmental interests located in this zip code:
KENT COUNTY HIGH SCHOOL (25301 LAMBS MEADOW ROAD in WORTON, MD)
AIR MINOR (AIRS/AFS) ENFORCEMENT/COMPLIANCE ACTIVITY (Integrated Compliance Information System) STATE MASTER (Maryland Air Emissions Database) - AIR MINOR (National Center for Education Statistics) - STATE ID-140301 Business SIC classification: ELEMENTARY AND SECONDARY SCHOOLS Organizations: BOARD OF EDUCATION OF KENT COUNTY (SCHOOL DISTRICT)
PERDUE-SOUTHERN STATES (ROUTE 561 in LYNCH, MD)
AIR MINOR (AIRS/AFS) Business SIC classification: CROP PREPARATION SERVICES FOR MARKET, EXCEPT COTTON GINNING Alternative names: SOUTHERN STATES GRAIN MARKETING
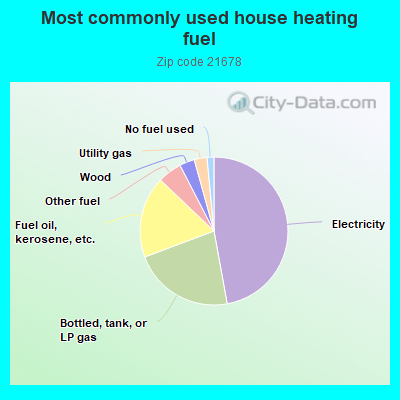
47.3%Electricity
22.2%Bottled, tank, or LP gas
17.9%Fuel oil, kerosene, etc.
5.3%Other fuel
3.3%Wood
2.8%Utility gas
1.5%No fuel used
Population in 1990: 1,680. Population change in the 1990s: +585 (+34.8%).
Place of birth for U.S.-born residents:
This state: 1,022
Northeast: 357
Midwest: 25
South: 193
West: 33
64% of the 21678 zip code residents lived in the same house 5 years ago. Out of people who lived in different houses, 60% lived in this county. Out of people who lived in different counties, 50% lived in Maryland.
87% of the 21678 zip code residents lived in the same house 1 year ago. Out of people who lived in different houses, 12% moved from this county. Out of people who lived in different houses, 43% moved from different county within same state. Out of people who lived in different houses, 43% moved from different state.
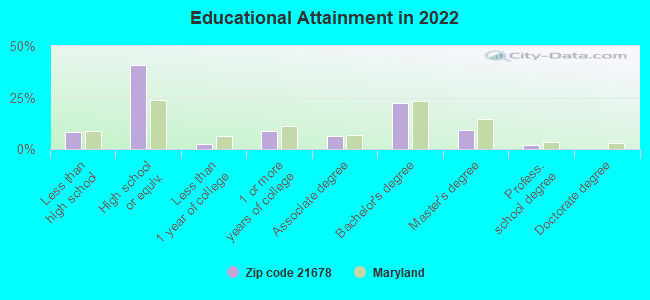
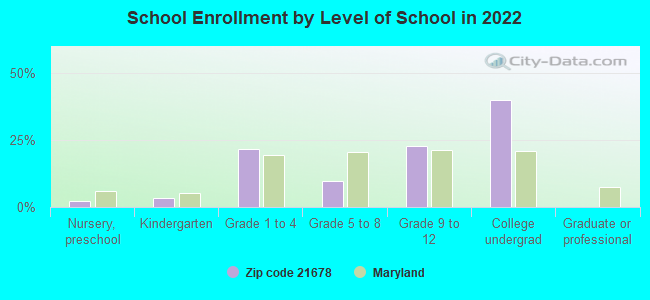
Private vs. public school enrollment:
Students in private schools in grades 1 to 8 (elementary and middle school): 39
Here:
35.3%
Maryland:
15.2%
Students in private schools in grades 9 to 12 (high school): 10
Here:
13.0%
Maryland:
14.4%
Students in private undergraduate colleges: 28
Here:
20.5%
Maryland:
20.2%
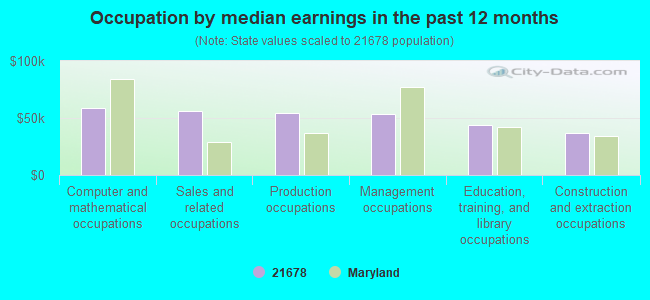
Occupation by median earnings in the past 12 months ($)
58,630Computer and mathematical occupations
56,421Sales and related occupations
54,786Production occupations
53,091Management occupations
44,014Education, training, and library occupations
36,937Construction and extraction occupations
Top industries in this zip code by the number of employees in 2005:
Health Care and Social Assistance: Services for the Elderly and Persons with Disabilities (20-49 employees: 2 establishments)
Educational Services: All Other Miscellaneous Schools and Instruction (20-49: 1)
Accommodation and Food Services: Recreational and Vacation Camps (except Campgrounds) (10-19: 1, 5-9: 1)
Construction: Site Preparation Contractors (10-19: 1)
Construction: New Single-Family Housing Construction (except Operative Builders) (5-9: 1, 1-4: 2)
Construction: Masonry Contractors (5-9: 1)
Health Care and Social Assistance: Child Day Care Services (5-9: 1)
People in group quarters in 2010:
27 people in workers' group living quarters and job corps centers
9 people in college/university student housing
People in group quarters in 2000:
21 people in other nonhousehold living situations
4 people in nursing homes
2 people in homes for the mentally ill
2 people in other noninstitutional group quarters
2002 - 2018 National Fire Incident Reporting System (NFIRS) incidents
According to the data from the years 2002 - 2018 the average number of fires per year is 15. The highest number of reported fire incidents - 32 took place in 2005, and the least - 4 in 2002. The data has an increasing trend.
When looking into fire subcategories, the most incidents belonged to: Structure Fires (62.3%), and Outside Fires (25.3%).
Fire incident types reported to NFIRS in Zip Code 21678

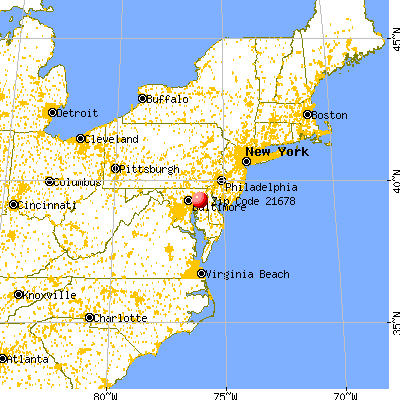


 Nearest zip codes: 21610, 21667, 21620, 21645, 21005, 21130.


 According to the data from the years 2002 - 2018 the average number of fires per year is 15. The highest number of reported fire incidents - 32 took place in 2005, and the least - 4 in 2002. The data has an increasing trend.
 When looking into fire subcategories, the most incidents belonged to: Structure Fires (62.3%), and Outside Fires (25.3%).