Estimated zip code population in 2022: 689 Zip code population in 2010: 803 Zip code population in 2000: 424
Houses and condos: 242 Renter-occupied apartments: 8
% of renters here:
3%
State:
32%
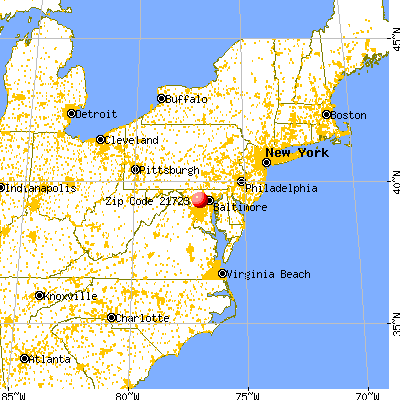
March 2022 cost of living index in zip code 21723: 97.2 (near average, U.S. average is 100)
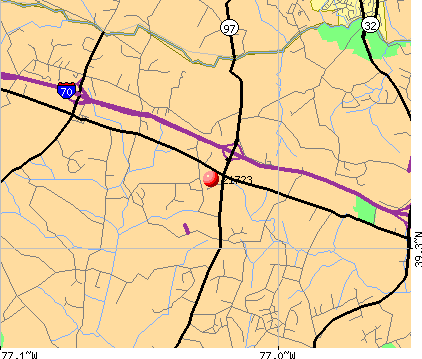
Land area: 3.1 sq. mi. Water area: 0.0 sq. mi.
Population density: 226 people per square mile
(very low).
OSM Map
General Map
Google Map
MSN Map
OSM Map
General Map
Google Map
MSN Map
OSM Map
General Map
Google Map
MSN Map
OSM Map
General Map
Google Map
MSN Map
Please wait while loading the map...
Real estate property taxes paid for housing units in 2022:
This zip code:
1.1% ($9,735)
Maryland:
0.9% ($3,777)
Median real estate property taxes paid for housing units with mortgages in 2022: $9,731 (1.0%) Median real estate property taxes paid for housing units with no mortgage in 2022: $9,750 (1.2%)
Business Search- 14 Million verified businesses
Males: 341
(49.5%)
Females: 348
(50.5%)
For population 25 years and over in 21723:
High school or higher: 87.2%
Bachelor's degree or higher: 73.3%
Graduate or professional degree: 24.9%
Unemployed: 3.1%
Mean travel time to work (commute): 37.3 minutes
For population 15 years and over in 21723:
Never married: 24.6%
Now married: 75.4%
Separated: 0.0%
Widowed: 0.0%
Divorced: 0.0%
Zip code 21723 compared to state average:
Median household income significantly above state average.
Median house value above state average.
Black race population percentage significantly below state average.
Hispanic race population percentage significantly below state average.
Median age significantly above state average.
Foreign-born population percentage significantly above state average.
Renting percentage significantly below state average.
Length of stay since moving in significantly above state average.
Number of rooms per house significantly above state average.
House age significantly below state average.
Percentage of population with a bachelor's degree or higher above state average.
Estimated median house/condo value in 2022: $891,828
21723:
$891,828
Maryland:
$398,100
Median resident age:
This zip code:
53.2 years
Maryland median age:
39.7 years
Average household size:
This zip code:
2.8 people
Maryland:
2.5 people
Averages for the 2020 tax year for zip code 21723, filed in 2021:
Average Adjusted Gross Income (AGI) in 2020: $165,448 (Individual Income Tax Returns)
Here:
$165,448
State:
$86,905
Salary/wage: $145,905 (reported on 82.6% of returns)
Here:
$145,905
State:
$73,953
(% of AGI for various income ranges: 1005.0% for AGIs below $25k, 3503.3% for AGIs $25k-50k, 3666.0% for AGIs $50k-75k, 22094.0% for AGIs $100k-200k, 96667.5% for AGIs over 200k)
Taxable interest for individuals: $883 (reported on 52.2% of returns)
This zip code:
$883
Maryland:
$1,528
(% of AGI for various income ranges: 31.7% for AGIs below $25k, 34.0% for AGIs $50k-75k, 52.0% for AGIs $100k-200k, 375.0% for AGIs over 200k)
Ordinary dividends: $4,629 (reported on 30.4% of returns)
Here:
$4,629
State:
$8,028
(% of AGI for various income ranges: 45.0% for AGIs below $25k, 43.3% for AGIs $25k-50k, 178.0% for AGIs $100k-200k, 1297.5% for AGIs over 200k)
Net capital gain/loss in AGI: +$32,214 (reported on 30.4% of returns)
Here:
+$32,214
State:
+$25,238
(% of AGI for various income ranges: 23.3% for AGIs below $25k, 8.0% for AGIs $50k-75k, 574.0% for AGIs $100k-200k, 10512.5% for AGIs over 200k)
Profit/loss from business: +$23,529 (reported on 15.2% of returns)
Here:
+$23,529
State:
+$11,398
(% of AGI for various income ranges: 205.0% for AGIs below $25k, 176.7% for AGIs $25k-50k, 3677.5% for AGIs over 200k)
Taxable individual retirement arrangement distribution: $26,767 (reported on 6.5% of returns)
21723:
$26,767
Maryland:
$20,944
(% of AGI for various income ranges: )
Total itemized deductions: $36,119 (reported on 34.8% of returns)
Here:
$36,119
State:
$30,672
(% of AGI for various income ranges: 1440.0% for AGIs $50k-75k, 3146.0% for AGIs $100k-200k, 8715.0% for AGIs over 200k)
Charity contributions: $6,500 (reported on 28.3% of returns)
Here:
$6,500
State:
$9,065
(% of AGI for various income ranges: 106.0% for AGIs $50k-75k, 324.0% for AGIs $100k-200k, 1575.0% for AGIs over 200k)
Taxes paid: $9,662 (reported on 34.8% of returns)
21723:
$9,662
State:
$8,475
(% of AGI for various income ranges: 472.0% for AGIs $50k-75k, 1008.0% for AGIs $100k-200k, 2015.0% for AGIs over 200k)
Percentage of individuals using paid preparers for their 2020 taxes: 89.1%
Here:
89%
State:
90%
(% for various income ranges: 90.9% for AGIs below $25k, 80.0% for AGIs $25k-50k, 75.0% for AGIs $50k-75k, 100.0% for AGIs $75k-100k, 90.0% for AGIs $100k-200k, 91.7% for AGIs over 200k)
Averages for the 2012 tax year for zip code 21723, filed in 2013:
Average Adjusted Gross Income (AGI) in 2012: $125,961 (Individual Income Tax Returns)
Here:
$125,961
State:
$72,703
Salary/wage: $113,894 (reported on 81.6% of returns)
Here:
$113,894
State:
$62,228
(% of AGI for various income ranges: 72.2% for AGIs below $25k, 75.9% for AGIs $25k-50k, 59.0% for AGIs $50k-75k, 67.9% for AGIs $75k-100k, 81.9% for AGIs $100k-200k, 71.8% for AGIs over 200k)
Taxable interest for individuals: $950 (reported on 63.2% of returns)
This zip code:
$950
Maryland:
$1,413
(% of AGI for various income ranges: 0.9% for AGIs below $25k, 1.8% for AGIs $25k-50k, 0.4% for AGIs $75k-100k, 0.3% for AGIs $100k-200k, 0.5% for AGIs over 200k)
Ordinary dividends: $5,525 (reported on 31.6% of returns)
Here:
$5,525
State:
$6,933
(% of AGI for various income ranges: 1.7% for AGIs $50k-75k, 1.5% for AGIs $100k-200k, 1.6% for AGIs over 200k)
Net capital gain/loss in AGI: +$5,350 (reported on 26.3% of returns)
Here:
+$5,350
State:
+$14,830
(% of AGI for various income ranges: 2.6% for AGIs below $25k, 0.6% for AGIs $100k-200k, 1.7% for AGIs over 200k)
Profit/loss from business: +$14,300 (reported on 13.2% of returns)
Here:
+$14,300
State:
+$12,606
Taxable individual retirement arrangement distribution: $7,167 (reported on 7.9% of returns)
21723:
$7,167
Maryland:
$17,065
Total itemized deductions: $40,832 (23% of AGI, reported on 65.8% of returns)
Here:
$40,832
State:
$27,886
Here:
22.9% of AGI
State:
22.8% of AGI
(% of AGI for various income ranges: 33.6% for AGIs $25k-50k, 28.1% for AGIs $50k-75k, 25.0% for AGIs $75k-100k, 25.4% for AGIs $100k-200k, 17.9% for AGIs over 200k)
Charity contributions: $3,373 (reported on 57.9% of returns)
Here:
$3,373
State:
$4,452
(% of AGI for various income ranges: 2.7% for AGIs $50k-75k, 1.3% for AGIs $75k-100k, 1.9% for AGIs $100k-200k, 1.5% for AGIs over 200k)
Taxes paid: $18,920 (reported on 65.8% of returns)
21723:
$18,920
State:
$11,690
(% of AGI for various income ranges: 8.9% for AGIs $25k-50k, 10.7% for AGIs $50k-75k, 9.9% for AGIs $75k-100k, 11.0% for AGIs $100k-200k, 9.6% for AGIs over 200k)
Percentage of individuals using paid preparers for their 2012 taxes: 55.3%
Here:
55%
State:
52%
(% for various income ranges: 50.0% for AGIs below $25k, 40.0% for AGIs $25k-50k, 60.0% for AGIs $50k-75k, 75.0% for AGIs $75k-100k, 55.6% for AGIs $100k-200k, 57.1% for AGIs over 200k)
Averages for the 2004 tax year for zip code 21723, filed in 2005:
Average Adjusted Gross Income (AGI) in 2004: $113,626 (Individual Income Tax Returns)
Here:
$113,626
State:
$60,339
Salary/wage: $97,899 (reported on 88.0% of returns)
Here:
$97,899
State:
$52,211
(% of AGI for various income ranges: 87.0% for AGIs below $10k, 66.7% for AGIs $10k-25k, 74.8% for AGIs $25k-50k, 80.9% for AGIs $50k-75k, 82.7% for AGIs $75k-100k, 75.0% for AGIs over 100k)
Taxable interest for individuals: $827 (reported on 69.0% of returns)
This zip code:
$827
Maryland:
$1,701
(% of AGI for various income ranges: 1.1% for AGIs below $10k, 1.5% for AGIs $10k-25k, 0.9% for AGIs $25k-50k, 1.8% for AGIs $50k-75k, 0.3% for AGIs $75k-100k, 0.4% for AGIs over 100k)
Taxable dividends: $3,083 (reported on 40.5% of returns)
Here:
$3,083
State:
$4,235
(% of AGI for various income ranges: 3.3% for AGIs below $10k, 0.7% for AGIs $25k-50k, 0.1% for AGIs $50k-75k, 0.1% for AGIs $75k-100k, 1.3% for AGIs over 100k)
Net capital gain/loss: +$7,973 (reported on 34.0% of returns)
Here:
+$7,973
State:
+$15,888
(% of AGI for various income ranges: -6.5% for AGIs below $10k, 0.0% for AGIs $50k-75k, 3.0% for AGIs over 100k)
Profit/loss from business: +$25,778 (reported on 16.6% of returns)
Here:
+$25,778
State:
+$12,221
Total itemized deductions: $37,014 (23% of AGI, reported on 67.5% of returns)
Here:
$37,014
State:
$22,960
Here:
23.4% of AGI
State:
23.3% of AGI
(% of AGI for various income ranges: 21.7% for AGIs $25k-50k, 31.7% for AGIs $50k-75k, 29.6% for AGIs $75k-100k, 21.0% for AGIs over 100k)
Charity contributions deductions: $4,325 (3% of AGI, reported on 62.3% of returns)
Here:
$4,325
State:
$4,031
Here:
2.7% of AGI
State:
3.9% of AGI
(% of AGI for various income ranges: 2.7% for AGIs $25k-50k, 1.3% for AGIs $50k-75k, 3.0% for AGIs $75k-100k, 2.4% for AGIs over 100k)
Total tax: $20,377 (reported on 86.2% of returns)
21723:
$20,377
State:
$10,167
(% of AGI for various income ranges: 1.6% for AGIs below $10k, 4.4% for AGIs $10k-25k, 7.7% for AGIs $25k-50k, 8.1% for AGIs $50k-75k, 7.8% for AGIs $75k-100k, 17.5% for AGIs over 100k)
Percentage of individuals using paid preparers for their 2004 taxes: 57.4%
Here:
57%
State:
55%
(% for various income ranges: 37.8% for AGIs below $10k, 48.1% for AGIs $10k-25k, 60.0% for AGIs $25k-50k, 63.9% for AGIs $50k-75k, 50.0% for AGIs $75k-100k, 64.7% for AGIs over 100k)
Size of family households: 106 2-persons, 88 3-persons, 42 4-persons
Size of nonfamily households: 8 1-person
84 married couples with children.
0 single-parent households ().
75.2% of residents of 21723 zip code speak English at home.
23.6% of residents speak Asian or Pacific Island language at home (81% very well, 19% well).
Foreign born population: 262 (38.1%) (80.2% of them are naturalized citizens)
This zip code:
38.1%
Whole state:
16.7%
43%Japan
13%France
8%Indonesia
7%Bhutan
6%Romania
3%Malaysia
8%Polish
6%Irish
4%Hungarian
3%Scandinavian
2%French Canadian
2%Italian
2%American
Year of entry for the foreign-born population
112010 or later
342000 to 2009
381990 to 1999
161Before 1990
Facilities with environmental interests located in this zip code:
HIGH S STORE - 2147 ROXBURY MILLS RD (2147 ROXBURY MILLS ROAD in COOKSVILLE, MD)
AIR MINOR (AIRS/AFS) STATE MASTER (Maryland Air Emissions Database) - AIR MINOR Business SIC classification: GROCERY STORES Alternative names: HIGHS 2147 ROXBURY MILLS ROAD
HOWARD CTY EQUIP STORAGE & REPAIR (14200/20 FREDERICK ROAD in COOKSVILLE, MD)
AIR MINOR (AIRS/AFS) STATE MASTER (Maryland Air Emissions Database) - AIR MINOR Business SIC classification: REPAIR SHOPS AND RELATED SERVICES
COOKSVILLE MAINTENANCE SHOP (14212 FREDERICK RD in COOKSVILLE, MD)
Conditionally Exempt Small Quantity Generators, less than 100 kg/month of hazardous waste (Resource Conservation and Recovery Act (tracking hazardous waste)) - notification Organizations: HOWARD COUNTY MARYLAND (CONTACT/OWNER)
44.9%Electricity
42.8%Utility gas
9.7%Fuel oil, kerosene, etc.
3.4%Bottled, tank, or LP gas
Population in 1990: 353. Population change in the 1990s: +71 (+20.1%).
Place of birth for U.S.-born residents:
This state: 285
Northeast: 67
Midwest: 38
South: 46
42% of the 21723 zip code residents lived in the same house 5 years ago. Out of people who lived in different houses, 47% lived in this county. Out of people who lived in different counties, 50% lived in Maryland.
94% of the 21723 zip code residents lived in the same house 1 year ago. Out of people who lived in different houses, 46% moved from different county within same state. Out of people who lived in different houses, 77% moved from abroad.
Private vs. public school enrollment:
Students in private schools in grades 1 to 8 (elementary and middle school):
Here:
0.0%
Maryland:
15.2%
Students in private schools in grades 9 to 12 (high school):
Here:
0.0%
Maryland:
14.4%
Students in private undergraduate colleges:
Here:
0.0%
Maryland:
20.2%
Occupation by median earnings in the past 12 months ($)
137,909Health diagnosing and treating practitioners and other technical occupations
126,749Computer and mathematical occupations
117,042Sales and related occupations
79,793Business and financial operations occupations
Top industries in this zip code by the number of employees in 2005:
Construction: Other Building Equipment Contractors (50-99 employees: 1 establishment)
Educational Services: Fine Arts Schools (20-49: 1)
Health Care and Social Assistance: Child Day Care Services (10-19: 1)
Construction: New Single-Family Housing Construction (except Operative Builders) (10-19: 1)
Other Services (except Public Administration): General Automotive Repair (10-19: 1)
Other Services (except Public Administration): Automotive Body, Paint, and Interior Repair and Maintenance (10-19: 1)
Construction: Site Preparation Contractors (5-9: 1, 1-4: 1)
Fatal accident statistics in 2012:
Fatal accident count: 1
Vehicles involved in fatal accidents: 1
Fatal accidents caused by drunken drivers: 0
Fatalities: 1
Persons involved in fatal accidents: 2
Pedestrians involved in fatal accidents: 0
Fatal accident statistics in 2010:
Fatal accident count: 1
Vehicles involved in fatal accidents: 4
Fatal accidents caused by drunken drivers: 0
Fatalities: 1
Persons involved in fatal accidents: 3
Pedestrians involved in fatal accidents: 0
Home Mortgage Disclosure Act Aggregated Statistics For Year 2009 (Based on 4 partial tracts)
A) FHA, FSA/RHS & VA Home Purchase Loans
B) Conventional Home Purchase Loans
C) Refinancings
D) Home Improvement Loans
Number
Average Value
Number
Average Value
Number
Average Value
Number
Average Value
LOANS ORIGINATED
2
$469,745
8
$577,271
64
$353,231
2
$195,265
APPLICATIONS APPROVED, NOT ACCEPTED
1
$364,430
1
$954,030
3
$404,353
0
$0
APPLICATIONS DENIED
0
$0
2
$583,815
16
$445,224
1
$52,040
APPLICATIONS WITHDRAWN
0
$0
1
$855,570
9
$428,859
1
$177,760
FILES CLOSED FOR INCOMPLETENESS
0
$0
0
$0
1
$568,450
0
$0
Aggregated Statistics For Year 2008 (Based on 4 partial tracts)
B) Conventional Home Purchase Loans
C) Refinancings
D) Home Improvement Loans
F) Non-occupant Loans on < 5 Family Dwellings (A B C & D)
Number
Average Value
Number
Average Value
Number
Average Value
Number
Average Value
LOANS ORIGINATED
14
$576,088
20
$323,106
3
$136,950
1
$960,800
APPLICATIONS APPROVED, NOT ACCEPTED
1
$749,510
2
$530,210
0
$0
0
$0
APPLICATIONS DENIED
3
$665,920
8
$521,825
2
$41,050
1
$409,370
APPLICATIONS WITHDRAWN
2
$445,875
4
$446,412
0
$0
0
$0
FILES CLOSED FOR INCOMPLETENESS
0
$0
1
$660,970
0
$0
0
$0
Aggregated Statistics For Year 2007 (Based on 4 partial tracts)
B) Conventional Home Purchase Loans
C) Refinancings
D) Home Improvement Loans
F) Non-occupant Loans on < 5 Family Dwellings (A B C & D)
Number
Average Value
Number
Average Value
Number
Average Value
Number
Average Value
LOANS ORIGINATED
16
$484,439
25
$445,941
4
$302,480
1
$180,890
APPLICATIONS APPROVED, NOT ACCEPTED
2
$701,110
4
$495,228
0
$0
0
$0
APPLICATIONS DENIED
2
$536,570
7
$649,614
2
$308,595
1
$252,260
APPLICATIONS WITHDRAWN
1
$453,640
5
$547,770
0
$0
0
$0
FILES CLOSED FOR INCOMPLETENESS
0
$0
2
$382,520
0
$0
0
$0
Aggregated Statistics For Year 2006 (Based on 4 partial tracts)
B) Conventional Home Purchase Loans
C) Refinancings
D) Home Improvement Loans
F) Non-occupant Loans on < 5 Family Dwellings (A B C & D)
Number
Average Value
Number
Average Value
Number
Average Value
Number
Average Value
LOANS ORIGINATED
20
$591,788
26
$415,853
3
$220,653
1
$273,740
APPLICATIONS APPROVED, NOT ACCEPTED
3
$512,230
4
$262,750
1
$90,030
0
$0
APPLICATIONS DENIED
3
$726,550
10
$663,840
1
$388,220
0
$0
APPLICATIONS WITHDRAWN
4
$560,110
9
$436,330
1
$209,310
0
$0
FILES CLOSED FOR INCOMPLETENESS
0
$0
2
$533,925
0
$0
0
$0
Aggregated Statistics For Year 2005 (Based on 4 partial tracts)
B) Conventional Home Purchase Loans
C) Refinancings
D) Home Improvement Loans
Number
Average Value
Number
Average Value
Number
Average Value
LOANS ORIGINATED
26
$503,606
40
$404,406
5
$253,880
APPLICATIONS APPROVED, NOT ACCEPTED
2
$482,795
4
$437,738
1
$159,250
APPLICATIONS DENIED
4
$567,710
10
$507,775
2
$116,795
APPLICATIONS WITHDRAWN
4
$525,832
10
$418,435
1
$156,440
FILES CLOSED FOR INCOMPLETENESS
0
$0
2
$638,085
0
$0
Aggregated Statistics For Year 2004 (Based on 4 partial tracts)
B) Conventional Home Purchase Loans
C) Refinancings
D) Home Improvement Loans
F) Non-occupant Loans on < 5 Family Dwellings (A B C & D)
Number
Average Value
Number
Average Value
Number
Average Value
Number
Average Value
LOANS ORIGINATED
27
$423,634
50
$365,594
5
$161,896
2
$353,365
APPLICATIONS APPROVED, NOT ACCEPTED
2
$478,750
7
$341,209
1
$251,100
0
$0
APPLICATIONS DENIED
4
$427,538
10
$326,055
1
$136,950
0
$0
APPLICATIONS WITHDRAWN
4
$328,748
9
$309,438
1
$199,730
0
$0
FILES CLOSED FOR INCOMPLETENESS
0
$0
2
$467,680
0
$0
0
$0
Aggregated Statistics For Year 2003 (Based on 4 partial tracts)
B) Conventional Home Purchase Loans
C) Refinancings
D) Home Improvement Loans
F) Non-occupant Loans on < 5 Family Dwellings (A B C & D)
Number
Average Value
Number
Average Value
Number
Average Value
Number
Average Value
LOANS ORIGINATED
23
$428,910
143
$288,691
4
$82,600
1
$199,230
APPLICATIONS APPROVED, NOT ACCEPTED
1
$363,940
15
$275,256
1
$164,870
0
$0
APPLICATIONS DENIED
1
$505,840
12
$333,732
1
$59,970
0
$0
APPLICATIONS WITHDRAWN
4
$320,158
12
$346,067
0
$0
0
$0
FILES CLOSED FOR INCOMPLETENESS
0
$0
4
$403,295
0
$0
0
$0
Aggregated Statistics For Year 1999 (Based on 2 partial tracts)


 Nearest zip codes: 21794, 21738, 21797, 21784, 21737, 21104.


