Estimated zip code population in 2022: 1,731 Zip code population in 2010: 983 Zip code population in 2000: 718
Houses and condos: 582 Renter-occupied apartments: 193
% of renters here:
34%
State:
32%
March 2022 cost of living index in zip code 21779: 135.3 (high, U.S. average is 100)
Land area: 9.0 sq. mi. Water area: 0.0 sq. mi.
Population density: 193 people per square mile
(very low).
OSM Map
General Map
Google Map
MSN Map
OSM Map
General Map
Google Map
MSN Map
OSM Map
General Map
Google Map
MSN Map
OSM Map
General Map
Google Map
MSN Map
Please wait while loading the map...
Real estate property taxes paid for housing units in 2022:
This zip code:
0.8% ($3,751)
Maryland:
0.9% ($3,777)
Median real estate property taxes paid for housing units with mortgages in 2022: $3,807 (0.7%) Median real estate property taxes paid for housing units with no mortgage in 2022: $3,623 (0.9%)
Business Search- 14 Million verified businesses
Males: 701
(40.5%)
Females: 1,030
(59.5%)
For population 25 years and over in 21779:
High school or higher: 90.1%
Bachelor's degree or higher: 38.2%
Graduate or professional degree: 8.8%
Mean travel time to work (commute): 36.5 minutes
For population 15 years and over in 21779:
Never married: 34.9%
Now married: 52.3%
Separated: 7.9%
Widowed: 2.7%
Divorced: 2.2%
Zip code 21779 compared to state average:
Unemployed percentage significantly below state average.
Black race population percentage significantly below state average.
Hispanic race population percentage significantly below state average.
Median age significantly below state average.
Foreign-born population percentage significantly below state average.
Length of stay since moving in above state average.
Estimated median house/condo value in 2022: $453,342
21779:
$453,342
Maryland:
$398,100
Median resident age:
This zip code:
28.2 years
Maryland median age:
39.7 years
Average household size:
This zip code:
3.0 people
Maryland:
2.5 people
Averages for the 2020 tax year for zip code 21779, filed in 2021:
Average Adjusted Gross Income (AGI) in 2020: $88,054 (Individual Income Tax Returns)
Here:
$88,054
State:
$86,905
Salary/wage: $78,592 (reported on 77.1% of returns)
Here:
$78,592
State:
$73,953
(% of AGI for various income ranges: 1027.1% for AGIs below $25k, 3394.3% for AGIs $25k-50k, 6636.7% for AGIs $50k-75k, 9245.0% for AGIs $75k-100k, 14733.3% for AGIs $100k-200k)
Taxable interest for individuals: $1,095 (reported on 39.6% of returns)
This zip code:
$1,095
Maryland:
$1,528
(% of AGI for various income ranges: 45.7% for AGIs $25k-50k, 76.7% for AGIs $50k-75k, 106.7% for AGIs $100k-200k)
Ordinary dividends: $3,817 (reported on 25.0% of returns)
Here:
$3,817
State:
$8,028
(% of AGI for various income ranges: 84.3% for AGIs below $25k, 136.7% for AGIs $50k-75k, 277.8% for AGIs $100k-200k)
Net capital gain/loss in AGI: +$8,989 (reported on 18.8% of returns)
Here:
+$8,989
State:
+$25,238
(% of AGI for various income ranges: 85.7% for AGIs $25k-50k, 832.2% for AGIs $100k-200k)
Profit/loss from business: +$7,122 (reported on 18.8% of returns)
Here:
+$7,122
State:
+$11,398
(% of AGI for various income ranges: 278.6% for AGIs below $25k, 142.9% for AGIs $25k-50k, 384.4% for AGIs $100k-200k)
Taxable individual retirement arrangement distribution: $18,660 (reported on 10.4% of returns)
21779:
$18,660
Maryland:
$20,944
(% of AGI for various income ranges: 325.7% for AGIs below $25k, 783.3% for AGIs $100k-200k)
Total itemized deductions: $26,120 (reported on 20.8% of returns)
Here:
$26,120
State:
$30,672
(% of AGI for various income ranges: 2293.3% for AGIs $50k-75k, 2137.8% for AGIs $100k-200k)
Charity contributions: $6,343 (reported on 14.6% of returns)
Here:
$6,343
State:
$9,065
(% of AGI for various income ranges: 493.3% for AGIs $100k-200k)
Taxes paid: $8,520 (reported on 20.8% of returns)
21779:
$8,520
State:
$8,475
(% of AGI for various income ranges: 650.0% for AGIs $50k-75k, 730.0% for AGIs $100k-200k)
Earned income credit: $1,750 (reported on 8.3% of returns)
Here:
$1,750
State:
$2,151
(% of AGI for various income ranges: 100.0% for AGIs $25k-50k)
Percentage of individuals using paid preparers for their 2020 taxes: 93.8%
Here:
94%
State:
90%
(% for various income ranges: 81.8% for AGIs below $25k, 100.0% for AGIs $25k-50k, 100.0% for AGIs $50k-75k, 100.0% for AGIs $75k-100k, 100.0% for AGIs $100k-200k, 75.0% for AGIs over 200k)
Averages for the 2012 tax year for zip code 21779, filed in 2013:
Average Adjusted Gross Income (AGI) in 2012: $63,994 (Individual Income Tax Returns)
Here:
$63,994
State:
$72,703
Salary/wage: $58,641 (reported on 78.7% of returns)
Here:
$58,641
State:
$62,228
(% of AGI for various income ranges: 72.6% for AGIs below $25k, 60.5% for AGIs $25k-50k, 69.6% for AGIs $50k-75k, 69.8% for AGIs $75k-100k, 75.9% for AGIs $100k-200k)
Taxable interest for individuals: $695 (reported on 42.6% of returns)
This zip code:
$695
Maryland:
$1,413
(% of AGI for various income ranges: 0.2% for AGIs below $25k, 1.3% for AGIs $25k-50k, 0.3% for AGIs $50k-75k, 0.4% for AGIs $75k-100k, 0.4% for AGIs $100k-200k)
Ordinary dividends: $1,870 (reported on 21.3% of returns)
Here:
$1,870
State:
$6,933
(% of AGI for various income ranges: 1.2% for AGIs $25k-50k, 0.5% for AGIs $50k-75k, 0.7% for AGIs $100k-200k)
Net capital gain/loss in AGI: +$1,557 (reported on 14.9% of returns)
Here:
+$1,557
State:
+$14,830
Profit/loss from business: +$9,043 (reported on 14.9% of returns)
Here:
+$9,043
State:
+$12,606
Taxable individual retirement arrangement distribution: $10,840 (reported on 10.6% of returns)
21779:
$10,840
Maryland:
$17,065
Total itemized deductions: $24,805 (24% of AGI, reported on 46.8% of returns)
Here:
$24,805
State:
$27,886
Here:
24.4% of AGI
State:
22.8% of AGI
(% of AGI for various income ranges: 37.1% for AGIs $25k-50k, 14.5% for AGIs $50k-75k, 17.2% for AGIs $75k-100k, 17.3% for AGIs $100k-200k)
Charity contributions: $2,522 (reported on 38.3% of returns)
Here:
$2,522
State:
$4,452
(% of AGI for various income ranges: 2.1% for AGIs $25k-50k, 0.8% for AGIs $50k-75k, 1.2% for AGIs $75k-100k, 1.8% for AGIs $100k-200k)
Taxes paid: $9,223 (reported on 46.8% of returns)
21779:
$9,223
State:
$11,690
(% of AGI for various income ranges: 5.8% for AGIs $25k-50k, 4.8% for AGIs $50k-75k, 7.4% for AGIs $75k-100k, 8.1% for AGIs $100k-200k)
Earned income credit: $1,740 (reported on 10.6% of returns)
Here:
$1,740
State:
$2,199
(% of AGI for various income ranges: 5.1% for AGIs below $25k)
Percentage of individuals using paid preparers for their 2012 taxes: 55.3%
Here:
55%
State:
52%
(% for various income ranges: 50.0% for AGIs below $25k, 50.0% for AGIs $25k-50k, 62.5% for AGIs $50k-75k, 75.0% for AGIs $75k-100k, 54.5% for AGIs $100k-200k)
Averages for the 2004 tax year for zip code 21779, filed in 2005:
Average Adjusted Gross Income (AGI) in 2004: $57,632 (Individual Income Tax Returns)
Here:
$57,632
State:
$60,339
Salary/wage: $54,861 (reported on 85.2% of returns)
Here:
$54,861
State:
$52,211
(% of AGI for various income ranges: 83.0% for AGIs below $10k, 94.7% for AGIs $10k-25k, 72.7% for AGIs $25k-50k, 83.5% for AGIs $50k-75k, 82.6% for AGIs $75k-100k, 80.7% for AGIs over 100k)
Taxable interest for individuals: $1,640 (reported on 54.6% of returns)
This zip code:
$1,640
Maryland:
$1,701
(% of AGI for various income ranges: 4.3% for AGIs below $10k, 1.6% for AGIs $10k-25k, 3.6% for AGIs $25k-50k, 0.5% for AGIs $50k-75k, 0.8% for AGIs $75k-100k, 1.5% for AGIs over 100k)
Taxable dividends: $1,331 (reported on 27.3% of returns)
Here:
$1,331
State:
$4,235
(% of AGI for various income ranges: 1.6% for AGIs $10k-25k, 0.7% for AGIs $25k-50k, 0.6% for AGIs $50k-75k, 0.4% for AGIs $75k-100k, 0.6% for AGIs over 100k)
Net capital gain/loss: +$6,524 (reported on 19.4% of returns)
Here:
+$6,524
State:
+$15,888
(% of AGI for various income ranges: -8.7% for AGIs below $10k, 0.0% for AGIs $25k-50k, 0.2% for AGIs $50k-75k, -0.3% for AGIs $75k-100k, 5.9% for AGIs over 100k)
Profit/loss from business: +$7,145 (reported on 12.7% of returns)
Here:
+$7,145
State:
+$12,221
(% of AGI for various income ranges: 14.3% for AGIs below $10k, 4.4% for AGIs $25k-50k, -0.3% for AGIs $50k-75k, 2.0% for AGIs over 100k)
IRA payment deduction: $3,800 (reported on 2.3% of returns)
21779:
$3,800
Maryland:
$2,968
Total itemized deductions: $20,447 (24% of AGI, reported on 50.7% of returns)
Here:
$20,447
State:
$22,960
Here:
23.9% of AGI
State:
23.3% of AGI
(% of AGI for various income ranges: 20.9% for AGIs $10k-25k, 13.8% for AGIs $25k-50k, 19.8% for AGIs $50k-75k, 21.0% for AGIs $75k-100k, 17.4% for AGIs over 100k)
Charity contributions deductions: $2,803 (3% of AGI, reported on 44.7% of returns)
Here:
$2,803
State:
$4,031
Here:
3.1% of AGI
State:
3.9% of AGI
(% of AGI for various income ranges: 1.3% for AGIs $10k-25k, 1.6% for AGIs $25k-50k, 2.1% for AGIs $50k-75k, 2.2% for AGIs $75k-100k, 2.6% for AGIs over 100k)
Total tax: $7,628 (reported on 82.9% of returns)
21779:
$7,628
State:
$10,167
(% of AGI for various income ranges: 2.6% for AGIs below $10k, 4.5% for AGIs $10k-25k, 7.6% for AGIs $25k-50k, 8.2% for AGIs $50k-75k, 9.9% for AGIs $75k-100k, 15.4% for AGIs over 100k)
Earned income credit: $1,448 (reported on 6.7% of returns)
Here:
$1,448
State:
$1,700
Percentage of individuals using paid preparers for their 2004 taxes: 59.7%
Here:
60%
State:
55%
(% for various income ranges: 47.2% for AGIs below $10k, 62.7% for AGIs $10k-25k, 65.1% for AGIs $25k-50k, 63.6% for AGIs $50k-75k, 59.3% for AGIs $75k-100k, 53.1% for AGIs over 100k)
Household received Food Stamps/SNAP in the past 12 months: 41 Household did not receive Food Stamps/SNAP in the past 12 months: 523
Women who did not have a birth in the past 12 months: 597 (190 now married, 407 unmarried)
Housing units in zip code 21779 with a mortgage: 291 (22 second mortgage, 5 both second mortgage and home equity loan) Median monthly owner costs for units with a mortgage: $2,172 Median monthly owner costs for units without a mortgage: $468
Residents with income below the poverty level in 2022:
This zip code:
9.6%
Whole state:
9.6%
Residents with income below 50% of the poverty level in 2022:
This zip code:
9.6%
Whole state:
4.7%
Median number of rooms in houses and condos:
Here:
7.7
State:
7.3
Median number of rooms in apartments:
Here:
6.0
State:
4.2
Notable locations in this zip code not listed on our city pages
Notable locations in zip code 21779: Bent Willow Farm (A), Beelers Summit (B), Boonsboro Volunteer Fire Company 8 Substation (C). Display/hide their locations on the map
Size of family households: 54 2-persons, 145 3-persons, 185 4-persons, 19 5-persons, 22 6-persons, 22 7-or-more-persons
Size of nonfamily households: 71 1-person, 40 2-persons
366 married couples with children.
89 single-parent households (89 women).
96.1% of residents of 21779 zip code speak English at home.
2.1% of residents speak other Indo-European language at home (100% very well).
Foreign born population: 0 (0.0%)
:
0.0%
Whole state:
16.7%
22%English
22%American
19%Irish
9%European
9%German
8%Italian
6%Polish
Year of entry for the foreign-born population
752010 or later
02000 to 2009
01990 to 1999
0Before 1990
57.5%Electricity
15.8%Utility gas
11.8%Fuel oil, kerosene, etc.
10.0%Wood
5.4%Bottled, tank, or LP gas
Population in 1990: 200. Population change in the 1990s: +518 (+259.0%).
Place of birth for U.S.-born residents:
This state: 982
Northeast: 195
Midwest: 33
South: 420
West: 13
59% of the 21779 zip code residents lived in the same house 5 years ago. Out of people who lived in different houses, 38% lived in this county. Out of people who lived in different counties, 50% lived in Maryland.
101% of the 21779 zip code residents lived in the same house 1 year ago.
Private vs. public school enrollment:
Students in private schools in grades 1 to 8 (elementary and middle school): 23
Here:
13.4%
Maryland:
15.2%
Students in private schools in grades 9 to 12 (high school): 61
Here:
65.8%
Maryland:
14.4%
Students in private undergraduate colleges: 83
Here:
91.5%
Maryland:
20.2%
Occupation by median earnings in the past 12 months ($)
91,545Management occupations
14,239Sales and related occupations
Top industries in this zip code by the number of employees in 2005:
Construction: All Other Specialty Trade Contractors (20-49 employees: 1 establishment)
Construction: Electrical Contractors (10-19: 1)
Other Services (except Public Administration): Religious Organizations (1-4: 5)
Construction: Masonry Contractors (5-9: 1)
Construction: Residential Remodelers (1-4: 2)
Arts, Entertainment, and Recreation: Independent Artists, Writers, and Performers (1-4: 1)
Professional, Scientific, and Technical Services: Other Management Consulting Services (1-4: 1)
Construction: Flooring Contractors (1-4: 1)
Professional, Scientific, and Technical Services: Administrative Management and General Management Consulting Services (1-4: 1)
Professional, Scientific, and Technical Services: Tax Preparation Services (1-4: 1)
Home Mortgage Disclosure Act Aggregated Statistics For Year 2009 (Based on 2 partial tracts)
A) FHA, FSA/RHS & VA Home Purchase Loans
B) Conventional Home Purchase Loans
C) Refinancings
D) Home Improvement Loans
F) Non-occupant Loans on < 5 Family Dwellings (A B C & D)
G) Loans On Manufactured Home Dwelling (A B C & D)
Number
Average Value
Number
Average Value
Number
Average Value
Number
Average Value
Number
Average Value
Number
Average Value
LOANS ORIGINATED
7
$245,131
9
$220,878
64
$238,453
5
$126,218
4
$211,268
1
$80,690
APPLICATIONS APPROVED, NOT ACCEPTED
0
$0
0
$0
7
$203,736
0
$0
0
$0
0
$0
APPLICATIONS DENIED
1
$115,240
2
$176,335
23
$260,008
3
$21,483
1
$67,800
1
$50,270
APPLICATIONS WITHDRAWN
0
$0
1
$254,450
18
$250,782
2
$292,345
0
$0
0
$0
FILES CLOSED FOR INCOMPLETENESS
0
$0
1
$155,970
5
$210,880
0
$0
0
$0
0
$0
Aggregated Statistics For Year 2008 (Based on 2 partial tracts)
A) FHA, FSA/RHS & VA Home Purchase Loans
B) Conventional Home Purchase Loans
C) Refinancings
D) Home Improvement Loans
F) Non-occupant Loans on < 5 Family Dwellings (A B C & D)
G) Loans On Manufactured Home Dwelling (A B C & D)
Number
Average Value
Number
Average Value
Number
Average Value
Number
Average Value
Number
Average Value
Number
Average Value
LOANS ORIGINATED
4
$300,272
12
$254,707
43
$233,099
9
$73,960
3
$161,900
1
$35,320
APPLICATIONS APPROVED, NOT ACCEPTED
0
$0
1
$207,530
10
$231,195
2
$33,385
1
$30,160
0
$0
APPLICATIONS DENIED
2
$289,380
1
$225,830
29
$262,698
5
$84,506
1
$39,700
1
$124,780
APPLICATIONS WITHDRAWN
1
$153,130
3
$234,253
15
$254,930
1
$42,280
1
$183,550
1
$86,360
FILES CLOSED FOR INCOMPLETENESS
0
$0
0
$0
2
$290,410
0
$0
0
$0
0
$0
Aggregated Statistics For Year 2007 (Based on 2 partial tracts)
A) FHA, FSA/RHS & VA Home Purchase Loans
B) Conventional Home Purchase Loans
C) Refinancings
D) Home Improvement Loans
F) Non-occupant Loans on < 5 Family Dwellings (A B C & D)
G) Loans On Manufactured Home Dwelling (A B C & D)
Number
Average Value
Number
Average Value
Number
Average Value
Number
Average Value
Number
Average Value
Number
Average Value
LOANS ORIGINATED
1
$285,900
22
$224,626
67
$237,099
10
$110,828
6
$198,978
1
$62,130
APPLICATIONS APPROVED, NOT ACCEPTED
0
$0
3
$186,303
9
$245,454
3
$65,823
1
$120,910
0
$0
APPLICATIONS DENIED
0
$0
3
$213,030
34
$263,350
7
$135,087
1
$99,770
1
$83,530
APPLICATIONS WITHDRAWN
0
$0
2
$157,130
21
$199,820
2
$179,040
0
$0
0
$0
FILES CLOSED FOR INCOMPLETENESS
0
$0
0
$0
4
$296,340
1
$59,290
0
$0
0
$0
Aggregated Statistics For Year 2006 (Based on 2 partial tracts)
A) FHA, FSA/RHS & VA Home Purchase Loans
B) Conventional Home Purchase Loans
C) Refinancings
D) Home Improvement Loans
F) Non-occupant Loans on < 5 Family Dwellings (A B C & D)
G) Loans On Manufactured Home Dwelling (A B C & D)
Number
Average Value
Number
Average Value
Number
Average Value
Number
Average Value
Number
Average Value
Number
Average Value
LOANS ORIGINATED
1
$201,080
36
$251,527
76
$209,083
16
$80,756
5
$163,032
2
$152,100
APPLICATIONS APPROVED, NOT ACCEPTED
0
$0
5
$330,396
13
$231,326
3
$52,590
1
$132,770
0
$0
APPLICATIONS DENIED
1
$209,850
4
$220,225
30
$211,955
10
$82,728
1
$46,150
2
$150,295
APPLICATIONS WITHDRAWN
0
$0
3
$255,307
28
$221,422
5
$167,776
1
$133,280
0
$0
FILES CLOSED FOR INCOMPLETENESS
0
$0
1
$353,190
8
$239,400
1
$37,380
0
$0
0
$0
Aggregated Statistics For Year 2005 (Based on 2 partial tracts)
A) FHA, FSA/RHS & VA Home Purchase Loans
B) Conventional Home Purchase Loans
C) Refinancings
D) Home Improvement Loans
F) Non-occupant Loans on < 5 Family Dwellings (A B C & D)
G) Loans On Manufactured Home Dwelling (A B C & D)
Number
Average Value
Number
Average Value
Number
Average Value
Number
Average Value
Number
Average Value
Number
Average Value
LOANS ORIGINATED
1
$209,330
59
$238,972
97
$219,430
15
$141,377
5
$166,230
1
$136,380
APPLICATIONS APPROVED, NOT ACCEPTED
0
$0
5
$243,312
12
$198,742
3
$72,700
0
$0
0
$0
APPLICATIONS DENIED
1
$121,680
7
$231,357
33
$186,319
9
$87,996
2
$178,400
2
$69,735
APPLICATIONS WITHDRAWN
0
$0
6
$190,643
42
$199,488
4
$175,305
1
$102,090
0
$0
FILES CLOSED FOR INCOMPLETENESS
0
$0
1
$166,800
8
$228,089
1
$109,820
0
$0
0
$0
Aggregated Statistics For Year 2004 (Based on 2 partial tracts)
A) FHA, FSA/RHS & VA Home Purchase Loans
B) Conventional Home Purchase Loans
C) Refinancings
D) Home Improvement Loans
F) Non-occupant Loans on < 5 Family Dwellings (A B C & D)
G) Loans On Manufactured Home Dwelling (A B C & D)
Number
Average Value
Number
Average Value
Number
Average Value
Number
Average Value
Number
Average Value
Number
Average Value
LOANS ORIGINATED
2
$244,265
59
$200,027
87
$181,962
18
$85,976
4
$209,140
1
$49,240
APPLICATIONS APPROVED, NOT ACCEPTED
0
$0
5
$220,832
12
$178,075
3
$87,137
1
$64,450
1
$91,260
APPLICATIONS DENIED
0
$0
4
$132,702
32
$167,127
9
$65,051
1
$29,390
1
$35,320
APPLICATIONS WITHDRAWN
0
$0
7
$178,471
42
$173,383
3
$79,060
1
$136,630
1
$85,070
FILES CLOSED FOR INCOMPLETENESS
0
$0
1
$157,770
4
$251,678
1
$131,480
0
$0
0
$0
Aggregated Statistics For Year 2003 (Based on 2 partial tracts)
A) FHA, FSA/RHS & VA Home Purchase Loans
B) Conventional Home Purchase Loans
C) Refinancings
D) Home Improvement Loans
F) Non-occupant Loans on < 5 Family Dwellings (A B C & D)
Number
Average Value
Number
Average Value
Number
Average Value
Number
Average Value
Number
Average Value
LOANS ORIGINATED
3
$183,897
44
$179,101
155
$154,617
8
$41,796
4
$122,325
APPLICATIONS APPROVED, NOT ACCEPTED
0
$0
2
$286,160
18
$133,727
1
$15,470
0
$0
APPLICATIONS DENIED
0
$0
4
$128,643
29
$161,738
2
$33,515
1
$20,880
APPLICATIONS WITHDRAWN
1
$70,640
4
$181,490
37
$154,129
1
$35,320
1
$90,490
FILES CLOSED FOR INCOMPLETENESS
0
$0
1
$34,800
4
$184,972
1
$23,200
0
$0
Aggregated Statistics For Year 2002 (Based on 2 partial tracts)
A) FHA, FSA/RHS & VA Home Purchase Loans
B) Conventional Home Purchase Loans
C) Refinancings
D) Home Improvement Loans
F) Non-occupant Loans on < 5 Family Dwellings (A B C & D)
Number
Average Value
Number
Average Value
Number
Average Value
Number
Average Value
Number
Average Value
LOANS ORIGINATED
4
$143,402
27
$155,482
101
$137,933
6
$47,993
2
$70,120
APPLICATIONS APPROVED, NOT ACCEPTED
0
$0
3
$153,307
11
$138,392
2
$16,500
0
$0
APPLICATIONS DENIED
0
$0
4
$80,562
24
$142,015
3
$15,123
1
$70,120
APPLICATIONS WITHDRAWN
0
$0
4
$211,782
28
$145,390
1
$25,780
1
$124,780
FILES CLOSED FOR INCOMPLETENESS
0
$0
1
$145,910
5
$151,432
0
$0
0
$0
Aggregated Statistics For Year 2001 (Based on 2 partial tracts)
A) FHA, FSA/RHS & VA Home Purchase Loans
B) Conventional Home Purchase Loans
C) Refinancings
D) Home Improvement Loans
F) Non-occupant Loans on < 5 Family Dwellings (A B C & D)
Number
Average Value
Number
Average Value
Number
Average Value
Number
Average Value
Number
Average Value
LOANS ORIGINATED
4
$160,415
24
$140,963
67
$131,713
7
$36,166
1
$171,440
APPLICATIONS APPROVED, NOT ACCEPTED
0
$0
2
$147,975
7
$119,030
1
$18,050
0
$0
APPLICATIONS DENIED
0
$0
4
$60,390
23
$128,003
4
$19,335
1
$19,340
APPLICATIONS WITHDRAWN
1
$93,580
4
$152,425
21
$127,562
2
$44,855
0
$0
FILES CLOSED FOR INCOMPLETENESS
0
$0
0
$0
5
$126,528
0
$0
0
$0
Aggregated Statistics For Year 2000 (Based on 2 partial tracts)
A) FHA, FSA/RHS & VA Home Purchase Loans
B) Conventional Home Purchase Loans
C) Refinancings
D) Home Improvement Loans
F) Non-occupant Loans on < 5 Family Dwellings (A B C & D)
Number
Average Value
Number
Average Value
Number
Average Value
Number
Average Value
Number
Average Value
LOANS ORIGINATED
5
$115,958
22
$120,756
21
$110,522
8
$20,656
2
$91,390
APPLICATIONS APPROVED, NOT ACCEPTED
1
$60,580
2
$112,790
5
$86,312
2
$34,030
0
$0
APPLICATIONS DENIED
0
$0
5
$104,306
14
$99,676
6
$22,128
1
$18,820
APPLICATIONS WITHDRAWN
0
$0
4
$120,845
6
$87,652
1
$26,040
1
$51,560
FILES CLOSED FOR INCOMPLETENESS
0
$0
1
$58,260
2
$96,415
0
$0
0
$0
Aggregated Statistics For Year 1999 (Based on 1 partial tract)
A) FHA, FSA/RHS & VA Home Purchase Loans
B) Conventional Home Purchase Loans
C) Refinancings
D) Home Improvement Loans
F) Non-occupant Loans on < 5 Family Dwellings (A B C & D)
Detailed PMIC statistics for the following Tracts:0115.00
2002 - 2018 National Fire Incident Reporting System (NFIRS) incidents
According to the data from the years 2002 - 2018 the average number of fires per year is 18. The highest number of reported fires - 44 took place in 2002, and the least - 5 in 2017. The data has a declining trend.
When looking into fire subcategories, the most incidents belonged to: Structure Fires (47.0%), and Outside Fires (34.9%).
Fire incident types reported to NFIRS in Zip Code 21779

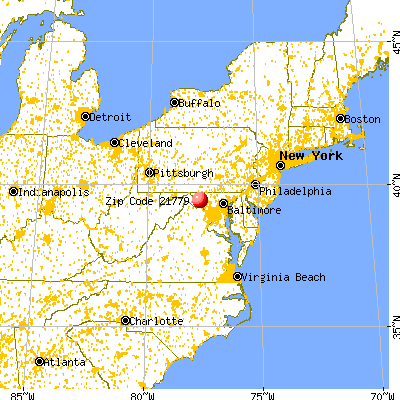


 Nearest zip codes: 21718, 21756, 21758, 21769, 21713, 21755.


 According to the data from the years 2002 - 2018 the average number of fires per year is 18. The highest number of reported fires - 44 took place in 2002, and the least - 5 in 2017. The data has a declining trend.
 When looking into fire subcategories, the most incidents belonged to: Structure Fires (47.0%), and Outside Fires (34.9%).