Estimated zip code population in 2022: 2,223 Zip code population in 2010: 2,210 Zip code population in 2000: 2,158
Houses and condos: 824 Renter-occupied apartments: 180
% of renters here:
23%
State:
32%
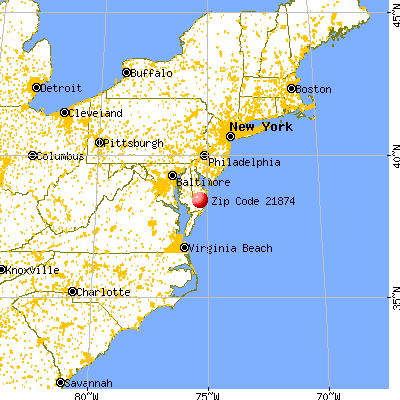
March 2022 cost of living index in zip code 21874: 91.5 (less than average, U.S. average is 100)
Land area: 26.8 sq. mi. Water area: 0.0 sq. mi.
Population density: 83 people per square mile
(very low).
OSM Map
General Map
Google Map
MSN Map
OSM Map
General Map
Google Map
MSN Map
OSM Map
General Map
Google Map
MSN Map
OSM Map
General Map
Google Map
MSN Map
Please wait while loading the map...
Real estate property taxes paid for housing units in 2022:
This zip code:
1.1% ($2,157)
Maryland:
0.9% ($3,777)
Median real estate property taxes paid for housing units with mortgages in 2022: $2,214 (1.1%) Median real estate property taxes paid for housing units with no mortgage in 2022: $2,002 (1.0%)
Business Search- 14 Million verified businesses
Males: 1,092
(49.1%)
Females: 1,130
(50.9%)
For population 25 years and over in 21874:
High school or higher: 84.6%
Bachelor's degree or higher: 20.9%
Graduate or professional degree: 8.9%
Unemployed: 5.2%
Mean travel time to work (commute): 23.5 minutes
For population 15 years and over in 21874:
Never married: 37.4%
Now married: 42.5%
Separated: 1.8%
Widowed: 4.1%
Divorced: 14.1%
Zip code 21874 compared to state average:
Median house value below state average.
Black race population percentage significantly below state average.
Foreign-born population percentage below state average.
Length of stay since moving in significantly above state average.
Percentage of population with a bachelor's degree or higher significantly below state average.
Averages for the 2020 tax year for zip code 21874, filed in 2021:
Average Adjusted Gross Income (AGI) in 2020: $51,108 (Individual Income Tax Returns)
Here:
$51,108
State:
$86,905
Salary/wage: $46,552 (reported on 84.4% of returns)
Here:
$46,552
State:
$73,953
(% of AGI for various income ranges: 1246.5% for AGIs below $25k, 3749.2% for AGIs $25k-50k, 6770.8% for AGIs $50k-75k, 10490.0% for AGIs $75k-100k, 22323.3% for AGIs $100k-200k)
Taxable interest for individuals: $644 (reported on 29.4% of returns)
This zip code:
$644
Maryland:
$1,528
(% of AGI for various income ranges: 12.6% for AGIs below $25k, 8.8% for AGIs $25k-50k, 36.9% for AGIs $50k-75k, 16.2% for AGIs $75k-100k, 156.7% for AGIs $100k-200k)
Ordinary dividends: $1,800 (reported on 11.9% of returns)
Here:
$1,800
State:
$8,028
(% of AGI for various income ranges: 3.9% for AGIs below $25k, 14.8% for AGIs $25k-50k, 43.8% for AGIs $50k-75k, 218.3% for AGIs $100k-200k)
Net capital gain/loss in AGI: +$1,467 (reported on 8.3% of returns)
Here:
+$1,467
State:
+$25,238
(% of AGI for various income ranges: 10.0% for AGIs below $25k, 30.8% for AGIs $50k-75k, 115.0% for AGIs $100k-200k)
Profit/loss from business: +$7,455 (reported on 18.3% of returns)
Here:
+$7,455
State:
+$11,398
(% of AGI for various income ranges: 207.0% for AGIs below $25k, 186.0% for AGIs $25k-50k, 331.5% for AGIs $50k-75k, 198.3% for AGIs $100k-200k)
Taxable individual retirement arrangement distribution: $15,725 (reported on 7.3% of returns)
21874:
$15,725
Maryland:
$20,944
(% of AGI for various income ranges: 127.6% for AGIs $25k-50k, 252.3% for AGIs $50k-75k, 1018.3% for AGIs $100k-200k)
Total itemized deductions: $24,550 (reported on 7.3% of returns)
Here:
$24,550
State:
$30,672
(% of AGI for various income ranges: 171.7% for AGIs below $25k, 713.8% for AGIs $50k-75k, 1068.3% for AGIs $100k-200k)
Charity contributions: $2,850 (reported on 5.5% of returns)
Here:
$2,850
State:
$9,065
(% of AGI for various income ranges: 42.3% for AGIs $50k-75k, 145.0% for AGIs $75k-100k)
Taxes paid: $7,838 (reported on 7.3% of returns)
21874:
$7,838
State:
$8,475
(% of AGI for various income ranges: 43.5% for AGIs below $25k, 243.1% for AGIs $50k-75k, 351.7% for AGIs $100k-200k)
Earned income credit: $2,010 (reported on 18.3% of returns)
Here:
$2,010
State:
$2,151
(% of AGI for various income ranges: 101.3% for AGIs below $25k, 67.6% for AGIs $25k-50k)
Percentage of individuals using paid preparers for their 2020 taxes: 93.6%
Here:
94%
State:
90%
(% for various income ranges: 88.6% for AGIs below $25k, 93.9% for AGIs $25k-50k, 94.1% for AGIs $50k-75k, 100.0% for AGIs $75k-100k, 100.0% for AGIs $100k-200k)
Averages for the 2012 tax year for zip code 21874, filed in 2013:
Average Adjusted Gross Income (AGI) in 2012: $42,881 (Individual Income Tax Returns)
Here:
$42,881
State:
$72,703
Salary/wage: $37,760 (reported on 86.4% of returns)
Here:
$37,760
State:
$62,228
(% of AGI for various income ranges: 78.5% for AGIs below $25k, 82.3% for AGIs $25k-50k, 79.5% for AGIs $50k-75k, 80.3% for AGIs $75k-100k, 66.5% for AGIs $100k-200k)
Taxable interest for individuals: $641 (reported on 33.0% of returns)
This zip code:
$641
Maryland:
$1,413
(% of AGI for various income ranges: 0.5% for AGIs below $25k, 0.7% for AGIs $25k-50k, 0.3% for AGIs $50k-75k, 0.3% for AGIs $75k-100k, 0.6% for AGIs $100k-200k)
Ordinary dividends: $750 (reported on 11.7% of returns)
Here:
$750
State:
$6,933
(% of AGI for various income ranges: 0.2% for AGIs below $25k, 0.4% for AGIs $25k-50k, 0.3% for AGIs $50k-75k)
Net capital gain/loss in AGI: +$2,443 (reported on 6.8% of returns)
Here:
+$2,443
State:
+$14,830
Profit/loss from business: +$5,281 (reported on 15.5% of returns)
Here:
+$5,281
State:
+$12,606
(% of AGI for various income ranges: 5.9% for AGIs below $25k, 2.7% for AGIs $25k-50k, 1.4% for AGIs $50k-75k, 0.8% for AGIs $100k-200k)
Taxable individual retirement arrangement distribution: $13,500 (reported on 8.7% of returns)
21874:
$13,500
Maryland:
$17,065
(% of AGI for various income ranges: 2.9% for AGIs below $25k, 1.8% for AGIs $25k-50k, 2.6% for AGIs $50k-75k, 10.2% for AGIs $75k-100k)
Total itemized deductions: $19,985 (26% of AGI, reported on 32.0% of returns)
Here:
$19,985
State:
$27,886
Here:
25.7% of AGI
State:
22.8% of AGI
(% of AGI for various income ranges: 7.0% for AGIs below $25k, 11.8% for AGIs $25k-50k, 14.8% for AGIs $50k-75k, 19.5% for AGIs $75k-100k, 18.6% for AGIs $100k-200k)
Charity contributions: $2,728 (reported on 24.3% of returns)
Here:
$2,728
State:
$4,452
(% of AGI for various income ranges: 0.5% for AGIs below $25k, 0.8% for AGIs $25k-50k, 1.5% for AGIs $50k-75k, 2.5% for AGIs $75k-100k, 2.1% for AGIs $100k-200k)
Taxes paid: $6,858 (reported on 32.0% of returns)
21874:
$6,858
State:
$11,690
(% of AGI for various income ranges: 1.2% for AGIs below $25k, 3.0% for AGIs $25k-50k, 5.1% for AGIs $50k-75k, 6.3% for AGIs $75k-100k, 7.9% for AGIs $100k-200k)
Earned income credit: $2,208 (reported on 23.3% of returns)
Here:
$2,208
State:
$2,199
(% of AGI for various income ranges: 6.6% for AGIs below $25k, 1.4% for AGIs $25k-50k)
Percentage of individuals using paid preparers for their 2012 taxes: 52.4%
Here:
52%
State:
52%
(% for various income ranges: 48.9% for AGIs below $25k, 44.4% for AGIs $25k-50k, 60.0% for AGIs $50k-75k, 71.4% for AGIs $75k-100k, 66.7% for AGIs $100k-200k)
Averages for the 2004 tax year for zip code 21874, filed in 2005:
Average Adjusted Gross Income (AGI) in 2004: $34,541 (Individual Income Tax Returns)
Here:
$34,541
State:
$60,339
Salary/wage: $32,600 (reported on 89.7% of returns)
Here:
$32,600
State:
$52,211
(% of AGI for various income ranges: 120.9% for AGIs below $10k, 83.7% for AGIs $10k-25k, 88.8% for AGIs $25k-50k, 86.3% for AGIs $50k-75k, 84.9% for AGIs $75k-100k, 66.8% for AGIs over 100k)
Taxable interest for individuals: $1,043 (reported on 37.4% of returns)
This zip code:
$1,043
Maryland:
$1,701
(% of AGI for various income ranges: 5.3% for AGIs below $10k, 1.2% for AGIs $10k-25k, 1.1% for AGIs $25k-50k, 0.7% for AGIs $50k-75k, 0.4% for AGIs $75k-100k, 2.4% for AGIs over 100k)
Taxable dividends: $902 (reported on 17.3% of returns)
Here:
$902
State:
$4,235
(% of AGI for various income ranges: 1.6% for AGIs below $10k, 0.8% for AGIs $10k-25k, 0.4% for AGIs $25k-50k, 0.3% for AGIs $50k-75k, 0.4% for AGIs $75k-100k, 0.3% for AGIs over 100k)
Net capital gain/loss: +$3,464 (reported on 10.3% of returns)
Here:
+$3,464
State:
+$15,888
(% of AGI for various income ranges: -1.3% for AGIs below $10k, 0.6% for AGIs $10k-25k, -0.1% for AGIs $25k-50k, 0.1% for AGIs $50k-75k, 0.2% for AGIs $75k-100k, 7.6% for AGIs over 100k)
Profit/loss from business: +$6,232 (reported on 14.6% of returns)
Here:
+$6,232
State:
+$12,221
(% of AGI for various income ranges: 11.4% for AGIs below $10k, 6.0% for AGIs $10k-25k, 2.9% for AGIs $25k-50k, 1.5% for AGIs $50k-75k, 1.8% for AGIs $75k-100k)
Profit/loss from farming: +$628 (reported on 4.0% of returns)
Here:
+$628
State:
-$4,771
IRA payment deduction: $3,030 (reported on 3.1% of returns)
21874:
$3,030
Maryland:
$2,968
Total itemized deductions: $14,150 (24% of AGI, reported on 32.0% of returns)
Here:
$14,150
State:
$22,960
Here:
24.0% of AGI
State:
23.3% of AGI
(% of AGI for various income ranges: 7.4% for AGIs $10k-25k, 12.4% for AGIs $25k-50k, 14.3% for AGIs $50k-75k, 17.1% for AGIs $75k-100k, 15.7% for AGIs over 100k)
Charity contributions deductions: $1,905 (3% of AGI, reported on 26.7% of returns)
Here:
$1,905
State:
$4,031
Here:
3.1% of AGI
State:
3.9% of AGI
(% of AGI for various income ranges: 0.8% for AGIs $10k-25k, 1.0% for AGIs $25k-50k, 1.3% for AGIs $50k-75k, 2.5% for AGIs $75k-100k, 2.5% for AGIs over 100k)
Total tax: $3,850 (reported on 73.9% of returns)
21874:
$3,850
State:
$10,167
(% of AGI for various income ranges: 4.3% for AGIs below $10k, 4.5% for AGIs $10k-25k, 6.7% for AGIs $25k-50k, 8.2% for AGIs $50k-75k, 10.1% for AGIs $75k-100k, 14.6% for AGIs over 100k)
Earned income credit: $1,839 (reported on 17.5% of returns)
Here:
$1,839
State:
$1,700
Percentage of individuals using paid preparers for their 2004 taxes: 57.3%
Here:
57%
State:
55%
(% for various income ranges: 49.0% for AGIs below $10k, 50.2% for AGIs $10k-25k, 59.9% for AGIs $25k-50k, 65.6% for AGIs $50k-75k, 70.8% for AGIs $75k-100k, 84.8% for AGIs over 100k)
Likely homosexual households (counted as self-reported same-sex unmarried-partner households)
Lesbian couples: 0.3% of all households
Gay men: 0.0% of all households
Household received Food Stamps/SNAP in the past 12 months: 201 Household did not receive Food Stamps/SNAP in the past 12 months: 597
Women who had a birth in the past 12 months: 42 (4 now married, 37 unmarried) Women who did not have a birth in the past 12 months: 528 (180 now married, 347 unmarried)
Housing units in zip code 21874 with a mortgage: 417 (43 second mortgage, 36 both second mortgage and home equity loan) Median monthly owner costs for units with a mortgage: $1,352 Median monthly owner costs for units without a mortgage: $530
Residents with income below the poverty level in 2022:
This zip code:
18.7%
Whole state:
9.6%
Residents with income below 50% of the poverty level in 2022:
This zip code:
15.6%
Whole state:
4.7%
Median number of rooms in houses and condos:
Here:
6.5
State:
7.3
Median number of rooms in apartments:
Here:
4.4
State:
4.2
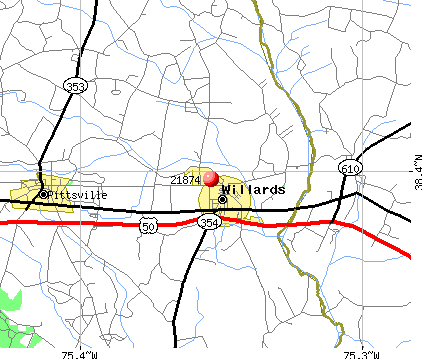
Notable locations in this zip code not listed on our city pages
Churches in zip code 21874 include: New Hope Church (A), Eden Presbyterian Church (B), Mount Pleasant Church (C), New Hope United Methodist Church (D). Display/hide their locations on the map
In group quarters: 3 (-1 institutionalized population)
Size of family households: 218 2-persons, 220 3-persons, 69 4-persons, 38 5-persons, 51 7-or-more-persons
Size of nonfamily households: 162 1-person, 18 2-persons, 7 3-persons
131 married couples with children.
356 single-parent households (58 men, 298 women).
84.0% of residents of 21874 zip code speak English at home.
12.0% of residents speak Spanish at home (66% very well, 27% well, 8% not well).
1.0% of residents speak other Indo-European language at home (100% very well).
0.2% of residents speak Asian or Pacific Island language at home (100% very well).
1.2% of residents speak other language at home (100% well).
Foreign born population: 194 (8.8%) (38.9% of them are naturalized citizens)
This zip code:
8.8%
Whole state:
16.7%
60%Honduras
8%El Salvador
3%Poland
2%Indonesia
2%Dominica
15%Irish
15%English
11%Palestinian
9%American
3%German
2%Polish
1%British
Year of entry for the foreign-born population
52010 or later
1352000 to 2009
441990 to 1999
26Before 1990
Facilities with environmental interests located in this zip code:
MD SHA BRIDGE 2200103 (US 50 EB OVER POCOMOKE RIVER in WILLARDS, MD)
Large Quantity Generators, more that 1000 kg of hazardous waste/month (Resource Conservation and Recovery Act (tracking hazardous waste)) Organizations: MD STATE HWY ADMIN (CONTACT/OPERATOR)
, STATE OF MARYLAND (CONTACT/OWNER)
MD SHA BRIDGE 2201100 (MD 346 OVER POKOMOKE RIVER in WILLARDS, MD)
Large Quantity Generators, more that 1000 kg of hazardous waste/month (Resource Conservation and Recovery Act (tracking hazardous waste)) Organizations: MD STATE HWY ADMIN (CONTACT/OPERATOR)
, STATE OF MARYLAND (CONTACT/OWNER)
MD SHA BRIDGE 2203101 (US 13 NB OVER NORFOLK SOUTHERN in WILLARDS, MD)
Large Quantity Generators, more that 1000 kg of hazardous waste/month (Resource Conservation and Recovery Act (tracking hazardous waste)) Organizations: MD STATE HWY ADMIN (CONTACT/OPERATOR)
, STATE OF MARYLAND (CONTACT/OWNER)
MD SHA BRIDGE 2203102 (US 13 SB OVER NORFOLK SOUTHERN in SALISBURY, MD)
Large Quantity Generators, more that 1000 kg of hazardous waste/month (Resource Conservation and Recovery Act (tracking hazardous waste)) Organizations: MD STATE HWY ADMIN (CONTACT/OPERATOR)
, STAET OF MARYLAND (CONTACT/OWNER)
BRADFORD ENTERPRISES - TEMP PLANT (RICHLAND ROAD in WILLARDS, MD)
AIR MINOR (AIRS/AFS) Business SIC classification: CUT STONE AND STONE PRODUCTS
Housing units lacking complete plumbing facilities: 0.7%
62.6%Electricity
22.6%Bottled, tank, or LP gas
6.7%Wood
5.5%Fuel oil, kerosene, etc.
1.6%Utility gas
0.9%Other fuel
Population in 1990: 1,895. Population change in the 1990s: +263 (+13.9%).
Place of birth for U.S.-born residents:
This state: 1,545
Northeast: 146
Midwest: 132
South: 158
West: 11
64% of the 21874 zip code residents lived in the same house 5 years ago. Out of people who lived in different houses, 47% lived in this county. Out of people who lived in different counties, 50% lived in Maryland.
95% of the 21874 zip code residents lived in the same house 1 year ago. Out of people who lived in different houses, 81% moved from this county. Out of people who lived in different houses, 21% moved from different county within same state. Out of people who lived in different houses, 3% moved from abroad.
Private vs. public school enrollment:
Students in private schools in grades 1 to 8 (elementary and middle school): 41
Here:
12.9%
Maryland:
15.2%
Students in private schools in grades 9 to 12 (high school): 2
Here:
1.2%
Maryland:
14.4%
Students in private undergraduate colleges:
Here:
0.0%
Maryland:
20.2%
Occupation by median earnings in the past 12 months ($)
84,120Business and financial operations occupations
77,036Management occupations
73,499Health diagnosing and treating practitioners and other technical occupations
69,337Installation, maintenance, and repair occupations
60,313Construction and extraction occupations
58,578Law enforcement workers including supervisors
Top industries in this zip code by the number of employees in 2005:
Finance and Insurance: Insurance Agencies and Brokerages (50-99 employees: 1 establishment)
Finance and Insurance: Commercial Banking (20-49: 1, 5-9: 1)
Construction: Power and Communication Line and Related Structures Construction (20-49: 1)
Administrative and Support and Waste Management and Remediation Services: All Other Support Services (10-19: 1, 5-9: 1)
Administrative and Support and Waste Management and Remediation Services: Other Services to Buildings and Dwellings (5-9: 1, 1-4: 1)
Construction: Masonry Contractors (5-9: 1)
Construction: Other Foundation, Structure, and Building Exterior Contractors (5-9: 1)
Fatal accident statistics in 2012:
Fatal accident count: 1
Vehicles involved in fatal accidents: 1
Fatal accidents caused by drunken drivers: 0
Fatalities: 1
Persons involved in fatal accidents: 1
Pedestrians involved in fatal accidents: 0
Fatal accident statistics in 2010:
Fatal accident count: 1
Vehicles involved in fatal accidents: 2
Fatal accidents caused by drunken drivers: 1
Fatalities: 2
Persons involved in fatal accidents: 3
Pedestrians involved in fatal accidents: 0
Home Mortgage Disclosure Act Aggregated Statistics For Year 2009 (Based on 4 partial tracts)
A) FHA, FSA/RHS & VA Home Purchase Loans
B) Conventional Home Purchase Loans
C) Refinancings
D) Home Improvement Loans
F) Non-occupant Loans on < 5 Family Dwellings (A B C & D)
G) Loans On Manufactured Home Dwelling (A B C & D)
Number
Average Value
Number
Average Value
Number
Average Value
Number
Average Value
Number
Average Value
Number
Average Value
LOANS ORIGINATED
36
$182,736
25
$159,782
153
$171,185
10
$59,284
18
$148,527
18
$96,502
APPLICATIONS APPROVED, NOT ACCEPTED
1
$159,810
1
$126,250
13
$185,239
2
$17,920
0
$0
0
$0
APPLICATIONS DENIED
1
$238,720
17
$98,466
77
$192,367
4
$59,958
7
$169,497
12
$65,866
APPLICATIONS WITHDRAWN
3
$197,180
1
$215,860
55
$168,701
3
$177,393
3
$215,017
2
$158,780
FILES CLOSED FOR INCOMPLETENESS
1
$112,390
1
$124,180
15
$154,437
1
$179,720
1
$95,460
3
$157,350
Aggregated Statistics For Year 2008 (Based on 4 partial tracts)
A) FHA, FSA/RHS & VA Home Purchase Loans
B) Conventional Home Purchase Loans
C) Refinancings
D) Home Improvement Loans
F) Non-occupant Loans on < 5 Family Dwellings (A B C & D)
G) Loans On Manufactured Home Dwelling (A B C & D)
Number
Average Value
Number
Average Value
Number
Average Value
Number
Average Value
Number
Average Value
Number
Average Value
LOANS ORIGINATED
19
$179,911
59
$163,023
136
$163,406
17
$93,059
17
$152,271
24
$107,352
APPLICATIONS APPROVED, NOT ACCEPTED
0
$0
2
$116,075
23
$144,330
3
$100,567
1
$30,370
4
$107,470
APPLICATIONS DENIED
3
$164,480
21
$125,435
89
$171,583
21
$83,318
2
$132,975
17
$129,846
APPLICATIONS WITHDRAWN
4
$180,992
11
$193,080
37
$175,312
5
$94,612
1
$145,020
3
$121,493
FILES CLOSED FOR INCOMPLETENESS
0
$0
1
$129,260
10
$177,381
0
$0
1
$223,640
0
$0
Aggregated Statistics For Year 2007 (Based on 4 partial tracts)
A) FHA, FSA/RHS & VA Home Purchase Loans
B) Conventional Home Purchase Loans
C) Refinancings
D) Home Improvement Loans
F) Non-occupant Loans on < 5 Family Dwellings (A B C & D)
G) Loans On Manufactured Home Dwelling (A B C & D)
Number
Average Value
Number
Average Value
Number
Average Value
Number
Average Value
Number
Average Value
Number
Average Value
LOANS ORIGINATED
11
$196,008
106
$156,916
166
$161,074
39
$89,187
23
$127,926
23
$89,735
APPLICATIONS APPROVED, NOT ACCEPTED
0
$0
12
$131,717
25
$140,648
9
$109,942
1
$97,890
6
$72,977
APPLICATIONS DENIED
2
$115,935
31
$106,787
112
$154,057
26
$100,362
5
$126,318
24
$82,225
APPLICATIONS WITHDRAWN
1
$277,650
10
$161,920
71
$158,296
7
$103,764
5
$125,992
1
$157,710
FILES CLOSED FOR INCOMPLETENESS
0
$0
3
$164,977
18
$173,591
2
$123,365
0
$0
1
$105,140
Aggregated Statistics For Year 2006 (Based on 4 partial tracts)
A) FHA, FSA/RHS & VA Home Purchase Loans
B) Conventional Home Purchase Loans
C) Refinancings
D) Home Improvement Loans
F) Non-occupant Loans on < 5 Family Dwellings (A B C & D)
G) Loans On Manufactured Home Dwelling (A B C & D)
Number
Average Value
Number
Average Value
Number
Average Value
Number
Average Value
Number
Average Value
Number
Average Value
LOANS ORIGINATED
12
$164,787
136
$149,236
210
$138,883
28
$82,860
34
$112,110
23
$89,488
APPLICATIONS APPROVED, NOT ACCEPTED
1
$196,270
7
$140,544
40
$144,944
2
$22,380
2
$89,670
3
$133,487
APPLICATIONS DENIED
2
$183,580
28
$135,498
105
$150,353
28
$58,169
12
$111,339
13
$91,246
APPLICATIONS WITHDRAWN
0
$0
15
$161,019
114
$151,825
6
$86,020
7
$160,090
3
$93,317
FILES CLOSED FOR INCOMPLETENESS
1
$80,820
3
$138,423
21
$179,042
1
$61,640
0
$0
1
$108,770
Aggregated Statistics For Year 2005 (Based on 4 partial tracts)
A) FHA, FSA/RHS & VA Home Purchase Loans
B) Conventional Home Purchase Loans
C) Refinancings
D) Home Improvement Loans
F) Non-occupant Loans on < 5 Family Dwellings (A B C & D)
G) Loans On Manufactured Home Dwelling (A B C & D)
Number
Average Value
Number
Average Value
Number
Average Value
Number
Average Value
Number
Average Value
Number
Average Value
LOANS ORIGINATED
12
$160,027
150
$134,663
199
$134,956
28
$78,101
41
$143,111
31
$80,078
APPLICATIONS APPROVED, NOT ACCEPTED
1
$148,650
21
$103,967
35
$123,164
3
$38,647
4
$89,960
16
$80,716
APPLICATIONS DENIED
2
$71,605
46
$80,225
110
$129,297
30
$51,079
4
$108,415
37
$65,533
APPLICATIONS WITHDRAWN
0
$0
27
$133,598
99
$140,287
13
$91,848
5
$101,628
2
$142,480
FILES CLOSED FOR INCOMPLETENESS
0
$0
4
$103,845
21
$131,315
2
$34,860
1
$90,640
0
$0
Aggregated Statistics For Year 2004 (Based on 4 partial tracts)
A) FHA, FSA/RHS & VA Home Purchase Loans
B) Conventional Home Purchase Loans
C) Refinancings
D) Home Improvement Loans
F) Non-occupant Loans on < 5 Family Dwellings (A B C & D)
G) Loans On Manufactured Home Dwelling (A B C & D)
Detailed PMIC statistics for the following Tracts:0106.02
, 0106.04
2002 - 2018 National Fire Incident Reporting System (NFIRS) incidents
Based on the data from the years 2002 - 2018 the average number of fire incidents per year is 17. The highest number of fire incidents - 31 took place in 2006, and the least - 1 in 2002. The data has a rising trend.
When looking into fire subcategories, the most reports belonged to: Structure Fires (46.0%), and Outside Fires (31.4%).
Fire incident types reported to NFIRS in Zip Code 21874


+$628
-$4,771
 Nearest zip codes: 21850, 21872, 21849, 21862, 21811, 21841.


 Based on the data from the years 2002 - 2018 the average number of fire incidents per year is 17. The highest number of fire incidents - 31 took place in 2006, and the least - 1 in 2002. The data has a rising trend.
 When looking into fire subcategories, the most reports belonged to: Structure Fires (46.0%), and Outside Fires (31.4%).