Estimated zip code population in 2022: 3,768 Zip code population in 2010: 3,187 Zip code population in 2000: 2,375
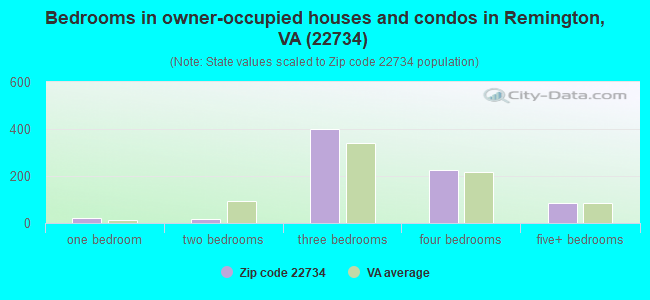
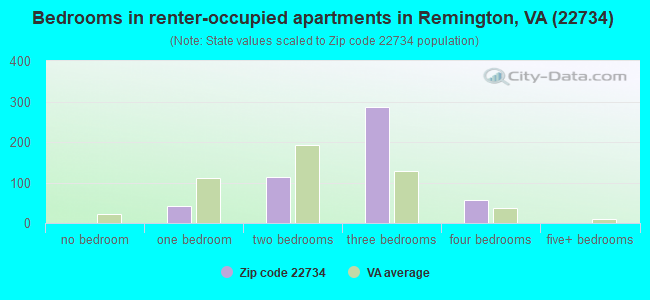
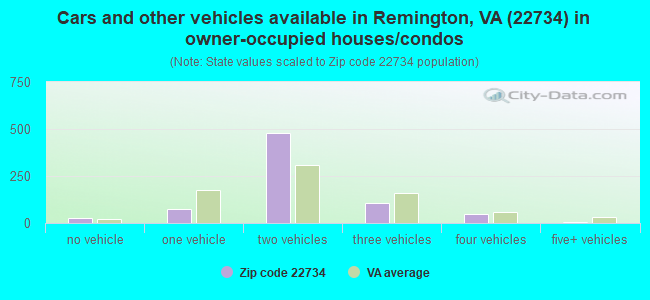
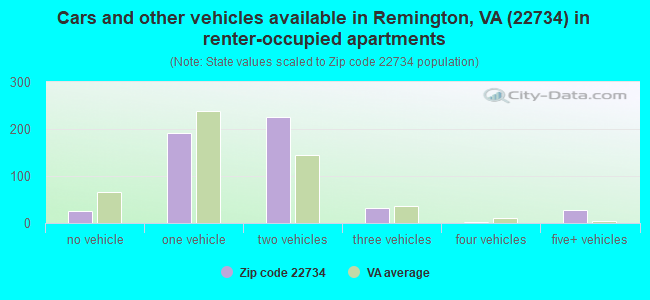
Houses and condos: 1,340 Renter-occupied apartments: 505
% of renters here:
40%
State:
33%
March 2022 cost of living index in zip code 22734: 159.6 (very high, U.S. average is 100)
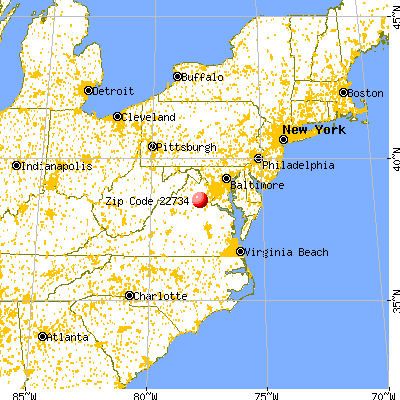
Land area: 30.0 sq. mi. Water area: 0.3 sq. mi.
Population density: 125 people per square mile
(very low).
OSM Map
General Map
Google Map
MSN Map
OSM Map
General Map
Google Map
MSN Map
OSM Map
General Map
Google Map
MSN Map
OSM Map
General Map
Google Map
MSN Map
Please wait while loading the map...
Real estate property taxes paid for housing units in 2022:
This zip code:
0.7% ($2,340)
Virginia:
0.7% ($2,617)
Median real estate property taxes paid for housing units with mortgages in 2022: $2,349 (0.7%) Median real estate property taxes paid for housing units with no mortgage in 2022: $2,341 (0.7%)
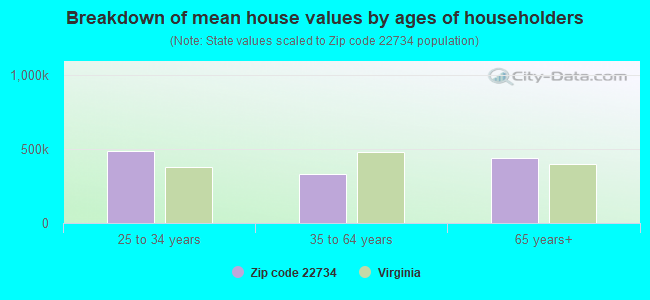
Estimated median house/condo value in 2022: $357,305
22734:
$357,305
Virginia:
$365,700
According to our research of Virginia and other state lists, there were 9 registered sex offenders living in 22734 zip code as of May 23, 2024. The ratio of all residents to sex offenders in zip code 22734 is 384 to 1. The ratio of registered sex offenders to all residents in this zip code is near the state average.
Median resident age:
This zip code:
32.6 years
Virginia median age:
39.0 years
Average household size:
This zip code:
3.0 people
Virginia:
2.5 people
Averages for the 2020 tax year for zip code 22734, filed in 2021:
Average Adjusted Gross Income (AGI) in 2020: $62,547 (Individual Income Tax Returns)
Here:
$62,547
State:
$86,446
Salary/wage: $58,130 (reported on 87.2% of returns)
Here:
$58,130
State:
$71,185
(% of AGI for various income ranges: 1215.3% for AGIs below $25k, 4114.5% for AGIs $25k-50k, 7054.2% for AGIs $50k-75k, 10841.7% for AGIs $75k-100k, 16764.7% for AGIs $100k-200k)
Taxable interest for individuals: $700 (reported on 21.3% of returns)
This zip code:
$700
Virginia:
$1,805
(% of AGI for various income ranges: 5.6% for AGIs below $25k, 10.3% for AGIs $25k-50k, 16.3% for AGIs $50k-75k, 20.8% for AGIs $75k-100k, 45.8% for AGIs $100k-200k)
Ordinary dividends: $2,773 (reported on 13.4% of returns)
Here:
$2,773
State:
$8,327
(% of AGI for various income ranges: 19.7% for AGIs below $25k, 35.2% for AGIs $25k-50k, 35.8% for AGIs $50k-75k, 55.8% for AGIs $75k-100k, 69.5% for AGIs $100k-200k)
Net capital gain/loss in AGI: +$7,400 (reported on 11.0% of returns)
Here:
+$7,400
State:
+$24,644
(% of AGI for various income ranges: 3.9% for AGIs below $25k, 27.9% for AGIs $25k-50k, 42.6% for AGIs $50k-75k, 43.3% for AGIs $75k-100k, 581.1% for AGIs $100k-200k)
Profit/loss from business: +$9,436 (reported on 17.1% of returns)
Here:
+$9,436
State:
+$12,836
(% of AGI for various income ranges: 165.8% for AGIs below $25k, 125.2% for AGIs $25k-50k, 331.1% for AGIs $50k-75k, 145.0% for AGIs $75k-100k, 462.6% for AGIs $100k-200k)
Taxable individual retirement arrangement distribution: $12,038 (reported on 4.9% of returns)
22734:
$12,038
Virginia:
$21,535
(% of AGI for various income ranges: 56.9% for AGIs below $25k, 145.8% for AGIs $50k-75k, 253.2% for AGIs $100k-200k)
Total itemized deductions: $24,677 (reported on 13.4% of returns)
Here:
$24,677
State:
$33,287
(% of AGI for various income ranges: 174.5% for AGIs $25k-50k, 444.7% for AGIs $50k-75k, 861.7% for AGIs $75k-100k, 1194.7% for AGIs $100k-200k)
Charity contributions: $5,340 (reported on 9.1% of returns)
Here:
$5,340
State:
$10,381
(% of AGI for various income ranges: 58.4% for AGIs $50k-75k, 122.5% for AGIs $75k-100k, 285.8% for AGIs $100k-200k)
Taxes paid: $6,932 (reported on 13.4% of returns)
22734:
$6,932
State:
$8,284
(% of AGI for various income ranges: 32.1% for AGIs $25k-50k, 137.9% for AGIs $50k-75k, 237.5% for AGIs $75k-100k, 360.5% for AGIs $100k-200k)
Earned income credit: $2,325 (reported on 14.6% of returns)
Here:
$2,325
State:
$2,214
(% of AGI for various income ranges: 95.6% for AGIs below $25k, 73.8% for AGIs $25k-50k)
Percentage of individuals using paid preparers for their 2020 taxes: 92.1%
Here:
92%
State:
92%
(% for various income ranges: 91.7% for AGIs below $25k, 92.1% for AGIs $25k-50k, 96.2% for AGIs $50k-75k, 88.9% for AGIs $75k-100k, 93.1% for AGIs $100k-200k, 80.0% for AGIs over 200k)
Averages for the 2012 tax year for zip code 22734, filed in 2013:
Average Adjusted Gross Income (AGI) in 2012: $53,568 (Individual Income Tax Returns)
Here:
$53,568
State:
$71,192
Salary/wage: $47,985 (reported on 91.6% of returns)
Here:
$47,985
State:
$59,229
(% of AGI for various income ranges: 81.1% for AGIs below $25k, 87.8% for AGIs $25k-50k, 84.1% for AGIs $50k-75k, 85.8% for AGIs $75k-100k, 76.6% for AGIs $100k-200k)
Taxable interest for individuals: $644 (reported on 23.8% of returns)
This zip code:
$644
Virginia:
$1,600
(% of AGI for various income ranges: 0.5% for AGIs below $25k, 0.3% for AGIs $25k-50k, 0.3% for AGIs $50k-75k, 0.2% for AGIs $75k-100k, 0.3% for AGIs $100k-200k)
Ordinary dividends: $1,840 (reported on 14.0% of returns)
Here:
$1,840
State:
$6,959
(% of AGI for various income ranges: 0.4% for AGIs below $25k, 0.2% for AGIs $25k-50k, 0.6% for AGIs $50k-75k, 0.3% for AGIs $75k-100k, 0.7% for AGIs $100k-200k)
Net capital gain/loss in AGI: +$2,700 (reported on 8.4% of returns)
Here:
+$2,700
State:
+$16,672
(% of AGI for various income ranges: 0.3% for AGIs $75k-100k, 1.0% for AGIs $100k-200k)
Profit/loss from business: +$11,155 (reported on 14.0% of returns)
Here:
+$11,155
State:
+$14,116
(% of AGI for various income ranges: 9.1% for AGIs below $25k, 3.6% for AGIs $25k-50k, 2.9% for AGIs $50k-75k, 2.4% for AGIs $75k-100k, 1.6% for AGIs $100k-200k)
Taxable individual retirement arrangement distribution: $15,025 (reported on 5.6% of returns)
22734:
$15,025
Virginia:
$16,667
Total itemized deductions: $22,433 (24% of AGI, reported on 36.4% of returns)
Here:
$22,433
State:
$26,596
Here:
24.2% of AGI
State:
20.1% of AGI
(% of AGI for various income ranges: 7.1% for AGIs below $25k, 9.2% for AGIs $25k-50k, 13.7% for AGIs $50k-75k, 18.5% for AGIs $75k-100k, 18.9% for AGIs $100k-200k)
Charity contributions: $3,181 (reported on 25.9% of returns)
Here:
$3,181
State:
$4,443
(% of AGI for various income ranges: 0.9% for AGIs $25k-50k, 1.2% for AGIs $50k-75k, 1.6% for AGIs $75k-100k, 2.3% for AGIs $100k-200k)
Taxes paid: $6,737 (reported on 36.4% of returns)
22734:
$6,737
State:
$9,951
(% of AGI for various income ranges: 1.0% for AGIs below $25k, 2.2% for AGIs $25k-50k, 3.8% for AGIs $50k-75k, 5.5% for AGIs $75k-100k, 6.3% for AGIs $100k-200k)
Earned income credit: $2,040 (reported on 17.5% of returns)
Here:
$2,040
State:
$2,211
(% of AGI for various income ranges: 6.4% for AGIs below $25k, 1.0% for AGIs $25k-50k)
Percentage of individuals using paid preparers for their 2012 taxes: 42.7%
Here:
43%
State:
46%
(% for various income ranges: 41.7% for AGIs below $25k, 41.7% for AGIs $25k-50k, 45.8% for AGIs $50k-75k, 43.8% for AGIs $75k-100k, 42.1% for AGIs $100k-200k)
Averages for the 2004 tax year for zip code 22734, filed in 2005:
Average Adjusted Gross Income (AGI) in 2004: $47,058 (Individual Income Tax Returns)
Here:
$47,058
State:
$56,704
Salary/wage: $43,299 (reported on 89.7% of returns)
Here:
$43,299
State:
$48,441
(% of AGI for various income ranges: 85.4% for AGIs below $10k, 82.3% for AGIs $10k-25k, 87.3% for AGIs $25k-50k, 91.3% for AGIs $50k-75k, 93.5% for AGIs $75k-100k, 60.7% for AGIs over 100k)
Taxable interest for individuals: $891 (reported on 33.9% of returns)
This zip code:
$891
Virginia:
$1,688
(% of AGI for various income ranges: 2.2% for AGIs below $10k, 0.9% for AGIs $10k-25k, 0.6% for AGIs $25k-50k, 0.3% for AGIs $50k-75k, 0.1% for AGIs $75k-100k, 1.2% for AGIs over 100k)
Taxable dividends: $1,836 (reported on 17.7% of returns)
Here:
$1,836
State:
$4,028
(% of AGI for various income ranges: 1.8% for AGIs below $10k, 0.4% for AGIs $10k-25k, 0.5% for AGIs $25k-50k, 0.6% for AGIs $50k-75k, 0.5% for AGIs $75k-100k, 1.1% for AGIs over 100k)
Net capital gain/loss: +$7,375 (reported on 10.7% of returns)
Here:
+$7,375
State:
+$14,375
(% of AGI for various income ranges: 0.3% for AGIs below $10k, 0.8% for AGIs $25k-50k, 0.4% for AGIs $50k-75k, 0.3% for AGIs $75k-100k, 5.5% for AGIs over 100k)
Profit/loss from business: +$9,404 (reported on 15.2% of returns)
Here:
+$9,404
State:
+$13,342
(% of AGI for various income ranges: 3.5% for AGIs below $10k, 6.8% for AGIs $10k-25k, 4.7% for AGIs $25k-50k, 0.6% for AGIs $50k-75k, -0.1% for AGIs $75k-100k, 5.2% for AGIs over 100k)
IRA payment deduction: $2,190 (reported on 1.7% of returns)
22734:
$2,190
Virginia:
$2,943
Total itemized deductions: $16,597 (24% of AGI, reported on 42.1% of returns)
Here:
$16,597
State:
$21,492
Here:
24.3% of AGI
State:
21.0% of AGI
(% of AGI for various income ranges: 10.7% for AGIs below $10k, 10.7% for AGIs $10k-25k, 12.0% for AGIs $25k-50k, 18.9% for AGIs $50k-75k, 18.4% for AGIs $75k-100k, 12.1% for AGIs over 100k)
Charity contributions deductions: $1,998 (3% of AGI, reported on 33.2% of returns)
Here:
$1,998
State:
$3,794
Here:
2.8% of AGI
State:
3.5% of AGI
(% of AGI for various income ranges: 0.7% for AGIs $10k-25k, 0.8% for AGIs $25k-50k, 1.6% for AGIs $50k-75k, 1.9% for AGIs $75k-100k, 1.7% for AGIs over 100k)
Total tax: $5,718 (reported on 80.3% of returns)
22734:
$5,718
State:
$9,537
(% of AGI for various income ranges: 3.0% for AGIs below $10k, 4.3% for AGIs $10k-25k, 7.5% for AGIs $25k-50k, 8.2% for AGIs $50k-75k, 9.1% for AGIs $75k-100k, 15.9% for AGIs over 100k)
Earned income credit: $1,704 (reported on 14.9% of returns)
Here:
$1,704
State:
$1,734
Percentage of individuals using paid preparers for their 2004 taxes: 51.8%
Here:
52%
State:
52%
(% for various income ranges: 47.5% for AGIs below $10k, 58.7% for AGIs $10k-25k, 49.7% for AGIs $25k-50k, 54.7% for AGIs $50k-75k, 43.8% for AGIs $75k-100k, 51.7% for AGIs over 100k)
Household received Food Stamps/SNAP in the past 12 months: 156 Household did not receive Food Stamps/SNAP in the past 12 months: 1,103
Women who had a birth in the past 12 months: 48 (49 now married, 0 unmarried) Women who did not have a birth in the past 12 months: 853 (304 now married, 551 unmarried)
Housing units in zip code 22734 with a mortgage: 537 (34 second mortgage, 29 both second mortgage and home equity loan) Median monthly owner costs for units with a mortgage: $1,920 Median monthly owner costs for units without a mortgage: $508
Residents with income below the poverty level in 2022:
This zip code:
5.7%
Whole state:
10.6%
Residents with income below 50% of the poverty level in 2022:
This zip code:
1.9%
Whole state:
5.2%
Median number of rooms in houses and condos:
Here:
6.8
State:
7.0
Median number of rooms in apartments:
Here:
5.2
State:
4.3
Notable locations in this zip code not listed on our city pages
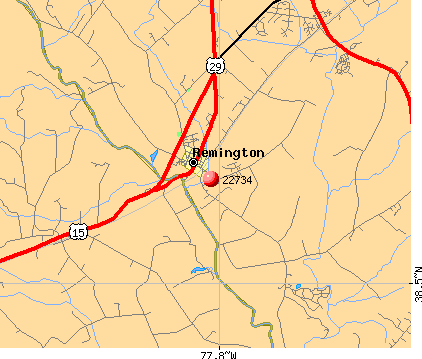
Notable locations in zip code 22734: Woodward Turf Farms (A), Remington Volunteer Fire and Rescue Department Fire Company 2 Rescue Company 14 (B). Display/hide their locations on the map
Churches in zip code 22734 include: Remington United Methodist Church (A), Saint Lukes Episcopal Church (B), Providence Church (C), Crossroads Community Church (D). Display/hide their locations on the map
Streams, rivers, and creeks: Tinpot Run (A), Mountain Run (B), Merry Run (C), Marsh Run (D), Hubbard Run (E), Craig Run (F), Bee Branch (G), Beales Branch (H). Display/hide their locations on the map
In group quarters: 10 (-1 institutionalized population)
Size of family households: 384 2-persons, 237 3-persons, 222 4-persons, 65 5-persons, 85 6-persons
Size of nonfamily households: 146 1-person, 114 2-persons
519 married couples with children.
466 single-parent households (153 men, 313 women).
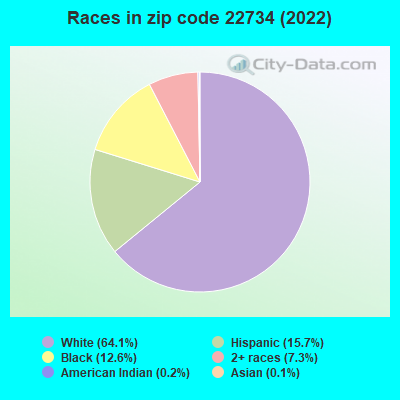
84.3% of residents of 22734 zip code speak English at home.
12.5% of residents speak Spanish at home (49% very well, 36% well, 14% not well).
1.1% of residents speak Asian or Pacific Island language at home (49% very well, 51% not well).
0.9% of residents speak other language at home (100% very well).
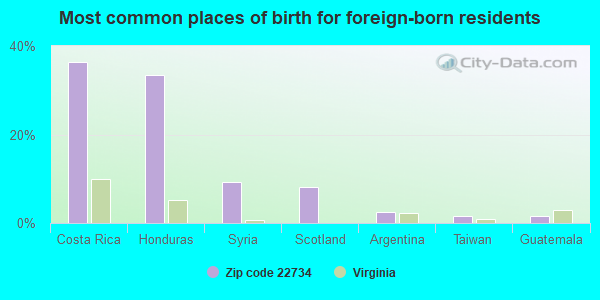
Foreign born population: 311 (8.3%) (25.3% of them are naturalized citizens)
This zip code:
8.3%
Whole state:
12.7%
36%Costa Rica
34%Honduras
9%Syria
8%Scotland
2%Argentina
2%Taiwan
2%Guatemala
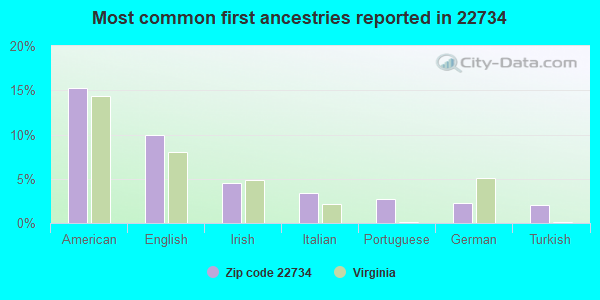
15%American
10%English
5%Irish
3%Italian
3%Portuguese
2%German
2%Turkish
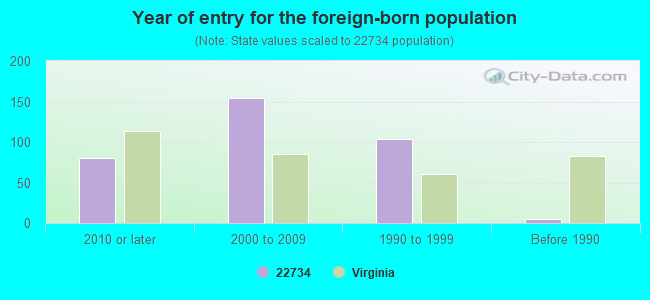
Year of entry for the foreign-born population
802010 or later
1542000 to 2009
1041990 to 1999
5Before 1990
Facilities with environmental interests located in this zip code:
DOMINION - REMINGTON COMBUSTION TURBINE (12025 LUCKY HILL ROAD in REMINGTON, VA)
AIR MAJOR (AIRS/AFS) AIR PROGRAM (Clean Air Markets Division Business System) STATE MASTER (Virginia pollutants databases) - CEDS-40961, AIR PROGRAM OIL CONTROL (Facility Response Plan for oil discharge) CRITERIA AND HAZARDOUS AIR POLLUTANT INVENTORY (Inventory of air pollution sources) National Pollutant Discharge Elimination System NON-MAJOR (Tracking pollutant discharge elimination systems) - permit AIR MAJOR ("Best Available" air pollution technologies tracking) Business SIC classification: ELECTRIC SERVICES Business NAICS classification: FOSSIL FUEL ELECTRIC POWER GENERATION. Organizations: DOMINION ENERGY (CONTACT/GENERAL)
, DOMINION GENERATION (CONTACT/OPERATOR)
, VIRGINIA ELECTRIC & POWER COMPANY (CONTACT/OPERATOR)
, DOMINION GENERATION (CONTACT/OWNER)
, VIRGINIA ELECTRIC & POWER COMPANY (CONTACT/OWNER)
Alternative names: DOMINION electric REMINGTON COMBUSTION TURBINE, DOMINION REMINGTON COMBUSTION TURBINE STATION, DOMINION REMINGTON COMBUSTION TURBINE STATION, REMINGTON COMBUSTION TURBINE STATION , VIRGINIA POWER-REMINGTON
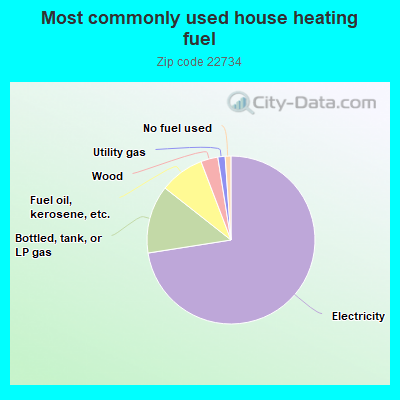
72.6%Electricity
13.1%Bottled, tank, or LP gas
8.6%Fuel oil, kerosene, etc.
3.3%Wood
1.4%Utility gas
1.1%No fuel used
Population in 1990: 2,377.
Place of birth for U.S.-born residents:
This state: 2,510
Northeast: 328
Midwest: 98
South: 377
West: 90
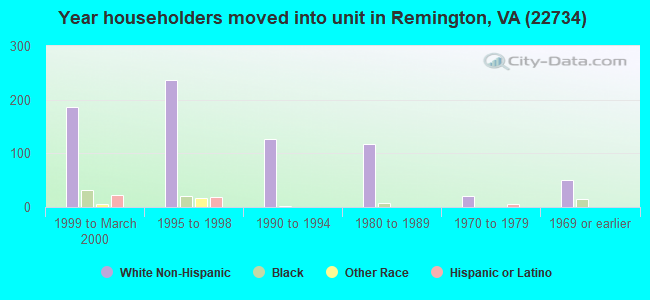
46% of the 22734 zip code residents lived in the same house 5 years ago. Out of people who lived in different houses, 42% lived in this county. Out of people who lived in different counties, 50% lived in Virginia.
84% of the 22734 zip code residents lived in the same house 1 year ago. Out of people who lived in different houses, 41% moved from this county. Out of people who lived in different houses, 48% moved from different county within same state. Out of people who lived in different houses, 5% moved from different state. Out of people who lived in different houses, 2% moved from abroad.
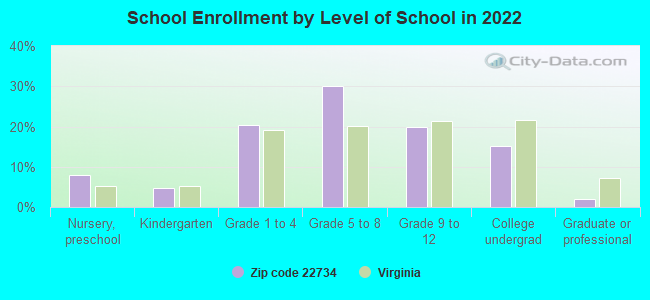
Private vs. public school enrollment:
Students in private schools in grades 1 to 8 (elementary and middle school): 7
Here:
1.6%
Virginia:
13.2%
Students in private schools in grades 9 to 12 (high school): 7
Here:
3.8%
Virginia:
10.2%
Students in private undergraduate colleges: 10
Here:
7.4%
Virginia:
18.7%
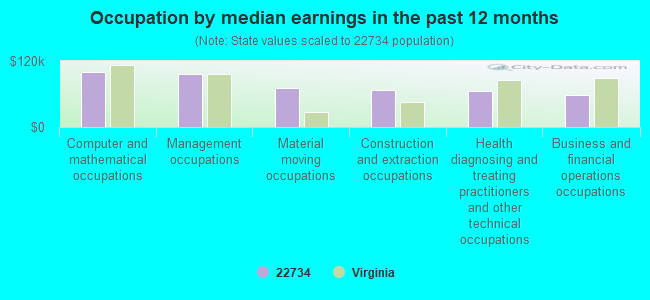
Occupation by median earnings in the past 12 months ($)
99,509Computer and mathematical occupations
96,922Management occupations
70,010Material moving occupations
66,707Construction and extraction occupations
66,309Health diagnosing and treating practitioners and other technical occupations
57,328Business and financial operations occupations
Companies with federal contracts located in this zip code:
ATEC INC (101 WEST MARSHALL STREET in REMINGTON, VA; small business) : $6,126,617 in 45 contractsfrom 2000 to 2006
Contracts for Engineering and Technical Services, Maintenance, Repair and Rebuilding of Equipment -- Communication, Detection, and Coherent Radiation Equipment, Other Administrative Support Services, Installation of Equipment -- Electrical and Electronic Equipment Components, and moreby Navy, Army, Department of Defense, U.S. Coast Guard, and others Signed by year:2000: $98,205; 2001: $1,084,642; 2002: $2,137,123; 2003: $744,581; 2004: $1,133,412; 2005: $751,578; 2006: $177,076.
Biggest contracts:
$875,000 with Navy for Engineering and Technical Services. Taking place in SC. Signed on 2002-08-16. Completion date: 2002-09-30.
$845,072, same as above.Signed on 2001-05-09. Completion date: 2002-05-08.
$400,000, same as above.Signed on 2002-08-29. Completion date: 2002-09-30.
$347,738, same as above.Signed on 2002-09-30. Completion date: 2003-01-30.
Top industries in this zip code by the number of employees in 2005:
Accommodation and Food Services: Bed-and-Breakfast Inns (20-49 employees: 1 establishment)
Health Care and Social Assistance: Vocational Rehabilitation Services (20-49: 1)
Finance and Insurance: Commercial Banking (10-19: 1)
Other Services (except Public Administration): Beauty Salons (5-9: 1, 1-4: 2)
People in group quarters in 2010:
6 people in group homes intended for adults
People in group quarters in 2000:
7 people in homes for the mentally retarded
Fatal accident statistics in 2014:
Fatal accident count: 1
Vehicles involved in fatal accidents: 2
Fatal accidents caused by drunken drivers: 0
Fatalities: 2
Persons involved in fatal accidents: 5
Pedestrians involved in fatal accidents: 0
Home Mortgage Disclosure Act Aggregated Statistics For Year 2009 (Based on 2 partial tracts)
A) FHA, FSA/RHS & VA Home Purchase Loans
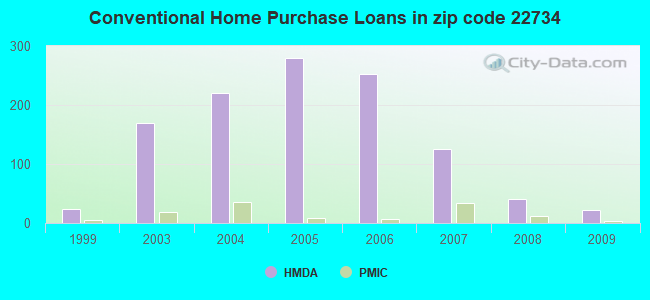
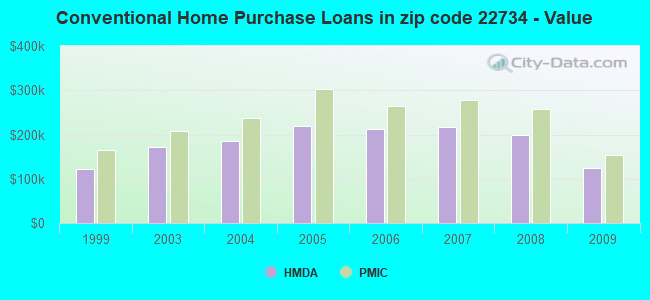
B) Conventional Home Purchase Loans
C) Refinancings
D) Home Improvement Loans
F) Non-occupant Loans on < 5 Family Dwellings (A B C & D)
G) Loans On Manufactured Home Dwelling (A B C & D)
Number
Average Value
Number
Average Value
Number
Average Value
Number
Average Value
Number
Average Value
Number
Average Value
LOANS ORIGINATED
69
$187,696
22
$124,908
113
$203,775
8
$91,260
12
$140,602
6
$46,188
APPLICATIONS APPROVED, NOT ACCEPTED
1
$285,280
4
$178,445
13
$232,656
1
$8,150
3
$242,583
2
$51,525
APPLICATIONS DENIED
9
$235,661
2
$255,005
70
$234,801
9
$76,398
8
$151,954
1
$67,540
APPLICATIONS WITHDRAWN
9
$207,716
8
$143,002
36
$261,828
1
$6,400
2
$109,745
0
$0
FILES CLOSED FOR INCOMPLETENESS
1
$260,240
0
$0
10
$219,897
1
$82,090
0
$0
1
$29,110
Aggregated Statistics For Year 2008 (Based on 2 partial tracts)
A) FHA, FSA/RHS & VA Home Purchase Loans
B) Conventional Home Purchase Loans
C) Refinancings
D) Home Improvement Loans
F) Non-occupant Loans on < 5 Family Dwellings (A B C & D)
G) Loans On Manufactured Home Dwelling (A B C & D)
Number
Average Value
Number
Average Value
Number
Average Value
Number
Average Value
Number
Average Value
Number
Average Value
LOANS ORIGINATED
64
$229,642
41
$199,680
80
$217,743
13
$72,193
13
$204,128
1
$38,430
APPLICATIONS APPROVED, NOT ACCEPTED
2
$243,360
7
$210,507
20
$230,813
1
$14,550
3
$121,487
1
$87,910
APPLICATIONS DENIED
9
$242,066
16
$170,876
103
$264,969
13
$111,066
5
$192,242
7
$50,236
APPLICATIONS WITHDRAWN
5
$220,886
6
$221,042
48
$234,736
4
$139,292
2
$186,015
0
$0
FILES CLOSED FOR INCOMPLETENESS
1
$122,260
1
$381,340
6
$226,378
2
$53,855
1
$58,220
0
$0
Aggregated Statistics For Year 2007 (Based on 2 partial tracts)
A) FHA, FSA/RHS & VA Home Purchase Loans
B) Conventional Home Purchase Loans
C) Refinancings
D) Home Improvement Loans
F) Non-occupant Loans on < 5 Family Dwellings (A B C & D)
G) Loans On Manufactured Home Dwelling (A B C & D)
Number
Average Value
Number
Average Value
Number
Average Value
Number
Average Value
Number
Average Value
Number
Average Value
LOANS ORIGINATED
11
$301,050
126
$215,839
172
$219,510
22
$63,883
16
$159,814
6
$48,128
APPLICATIONS APPROVED, NOT ACCEPTED
1
$89,080
11
$165,345
26
$220,609
5
$116,440
2
$311,475
1
$40,170
APPLICATIONS DENIED
2
$167,380
38
$143,788
167
$264,796
34
$95,310
6
$198,337
17
$46,713
APPLICATIONS WITHDRAWN
0
$0
16
$231,606
66
$261,275
8
$212,649
5
$201,558
1
$48,320
FILES CLOSED FOR INCOMPLETENESS
1
$183,390
2
$326,325
17
$263,086
0
$0
2
$72,775
0
$0
Aggregated Statistics For Year 2006 (Based on 2 partial tracts)
A) FHA, FSA/RHS & VA Home Purchase Loans
B) Conventional Home Purchase Loans
C) Refinancings
D) Home Improvement Loans
F) Non-occupant Loans on < 5 Family Dwellings (A B C & D)
G) Loans On Manufactured Home Dwelling (A B C & D)
Number
Average Value
Number
Average Value
Number
Average Value
Number
Average Value
Number
Average Value
Number
Average Value
LOANS ORIGINATED
8
$303,254
253
$211,385
267
$238,364
48
$104,978
30
$304,510
4
$52,690
APPLICATIONS APPROVED, NOT ACCEPTED
0
$0
37
$216,767
33
$235,703
2
$100,430
2
$132,160
4
$51,232
APPLICATIONS DENIED
0
$0
48
$209,095
149
$233,364
29
$109,815
13
$179,945
11
$46,841
APPLICATIONS WITHDRAWN
2
$220,945
38
$212,579
104
$226,336
11
$127,502
6
$182,713
1
$13,970
FILES CLOSED FOR INCOMPLETENESS
0
$0
7
$169,587
12
$279,553
2
$75,975
0
$0
0
$0
Aggregated Statistics For Year 2005 (Based on 2 partial tracts)
A) FHA, FSA/RHS & VA Home Purchase Loans
B) Conventional Home Purchase Loans
C) Refinancings
D) Home Improvement Loans
F) Non-occupant Loans on < 5 Family Dwellings (A B C & D)
G) Loans On Manufactured Home Dwelling (A B C & D)
Number
Average Value
Number
Average Value
Number
Average Value
Number
Average Value
Number
Average Value
Number
Average Value
LOANS ORIGINATED
3
$278,873
280
$219,591
344
$214,615
43
$126,690
40
$195,430
6
$57,055
APPLICATIONS APPROVED, NOT ACCEPTED
0
$0
35
$195,736
37
$196,894
10
$109,745
4
$247,290
8
$60,258
APPLICATIONS DENIED
0
$0
61
$216,540
114
$209,955
29
$51,816
10
$199,229
15
$46,848
APPLICATIONS WITHDRAWN
1
$157,780
36
$207,668
98
$218,759
12
$153,264
12
$148,801
2
$118,480
FILES CLOSED FOR INCOMPLETENESS
0
$0
7
$228,887
17
$212,161
5
$115,160
2
$186,885
0
$0
Aggregated Statistics For Year 2004 (Based on 2 partial tracts)
A) FHA, FSA/RHS & VA Home Purchase Loans
B) Conventional Home Purchase Loans
C) Refinancings
D) Home Improvement Loans
E) Loans on Dwellings For 5+ Families
F) Non-occupant Loans on < 5 Family Dwellings (A B C & D)
G) Loans On Manufactured Home Dwelling (A B C & D)
Number
Average Value
Number
Average Value
Number
Average Value
Number
Average Value
Number
Average Value
Number
Average Value
Number
Average Value
LOANS ORIGINATED
23
$217,388
220
$186,079
289
$178,488
37
$80,863
1
$1,601,050
25
$161,246
5
$39,474
APPLICATIONS APPROVED, NOT ACCEPTED
0
$0
20
$152,536
44
$186,860
6
$66,370
0
$0
2
$82,090
5
$46,808
APPLICATIONS DENIED
1
$321,960
27
$158,919
108
$186,584
31
$49,600
0
$0
3
$147,103
9
$38,684
APPLICATIONS WITHDRAWN
1
$273,630
15
$231,133
77
$200,111
12
$136,138
0
$0
3
$146,133
0
$0
FILES CLOSED FOR INCOMPLETENESS
0
$0
2
$219,780
19
$187,254
2
$54,145
0
$0
0
$0
0
$0
Aggregated Statistics For Year 2003 (Based on 4 partial tracts)
A) FHA, FSA/RHS & VA Home Purchase Loans
B) Conventional Home Purchase Loans
C) Refinancings
D) Home Improvement Loans
F) Non-occupant Loans on < 5 Family Dwellings (A B C & D)
Number
Average Value
Number
Average Value
Number
Average Value
Number
Average Value
Number
Average Value
LOANS ORIGINATED
44
$201,875
169
$171,685
476
$149,341
21
$29,769
26
$139,437
APPLICATIONS APPROVED, NOT ACCEPTED
1
$103,630
17
$143,491
81
$151,246
7
$48,397
2
$108,155
APPLICATIONS DENIED
3
$192,447
28
$108,179
137
$147,946
17
$39,630
4
$91,045
APPLICATIONS WITHDRAWN
3
$213,187
21
$197,720
76
$152,382
5
$34,128
1
$204,470
FILES CLOSED FOR INCOMPLETENESS
0
$0
3
$188,103
25
$151,673
4
$21,050
2
$82,390
Aggregated Statistics For Year 1999 (Based on 1 partial tract)
A) FHA, FSA/RHS & VA Home Purchase Loans
B) Conventional Home Purchase Loans
C) Refinancings
D) Home Improvement Loans
F) Non-occupant Loans on < 5 Family Dwellings (A B C & D)
Detailed PMIC statistics for the following Tracts:9901.00
, 9907.02
2002 - 2018 National Fire Incident Reporting System (NFIRS) incidents
According to the data from the years 2002 - 2018 the average number of fires per year is 17. The highest number of reported fire incidents - 31 took place in 2008, and the least - 4 in 2004. The data has a growing trend.
When looking into fire subcategories, the most incidents belonged to: Outside Fires (44.6%), and Structure Fires (41.6%).
Fire incident types reported to NFIRS in Zip Code 22734


 Nearest zip codes: 22712, 22718, 22742, 22714, 22741, 22726.


 According to the data from the years 2002 - 2018 the average number of fires per year is 17. The highest number of reported fire incidents - 31 took place in 2008, and the least - 4 in 2004. The data has a growing trend.
 When looking into fire subcategories, the most incidents belonged to: Outside Fires (44.6%), and Structure Fires (41.6%).