Estimated zip code population in 2022: 1,865 Zip code population in 2010: 1,855 Zip code population in 2000: 894
Houses and condos: 654 Renter-occupied apartments: 73
% of renters here:
12%
State:
33%
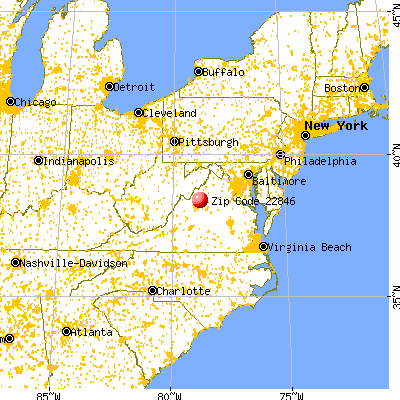
March 2022 cost of living index in zip code 22846: 87.7 (less than average, U.S. average is 100)
Land area: 11.1 sq. mi. Water area: 0.0 sq. mi.
Population density: 168 people per square mile
(very low).
OSM Map
General Map
Google Map
MSN Map
OSM Map
General Map
Google Map
MSN Map
OSM Map
General Map
Google Map
MSN Map
OSM Map
General Map
Google Map
MSN Map
Please wait while loading the map...
Real estate property taxes paid for housing units in 2022:
This zip code:
0.5% ($2,493)
Virginia:
0.7% ($2,617)
Median real estate property taxes paid for housing units with mortgages in 2022: $2,484 (0.5%) Median real estate property taxes paid for housing units with no mortgage in 2022: $2,571 (0.6%)
Business Search- 14 Million verified businesses
Males: 838
(45.0%)
Females: 1,026
(55.0%)
For population 25 years and over in 22846:
High school or higher: 94.2%
Bachelor's degree or higher: 37.2%
Graduate or professional degree: 15.5%
Unemployed: 4.0%
Mean travel time to work (commute): 23.0 minutes
For population 15 years and over in 22846:
Never married: 22.9%
Now married: 66.5%
Separated: 0.7%
Widowed: 2.4%
Divorced: 7.5%
Zip code 22846 compared to state average:
Black race population percentage significantly below state average.
Hispanic race population percentage below state average.
Median age significantly above state average.
Foreign-born population percentage significantly below state average.
Renting percentage significantly below state average.
Length of stay since moving in significantly above state average.
Number of rooms per house significantly above state average.
Number of college students significantly below state average.
Estimated median house/condo value in 2022: $460,300
22846:
$460,300
Virginia:
$365,700
According to our research of Virginia and other state lists, there were 3 registered sex offenders living in 22846 zip code as of May 23, 2024. The ratio of all residents to sex offenders in zip code 22846 is 771 to 1. The ratio of registered sex offenders to all residents in this zip code is lower than the state average.
Median resident age:
This zip code:
49.0 years
Virginia median age:
39.0 years
Average household size:
This zip code:
2.8 people
Virginia:
2.5 people
Averages for the 2020 tax year for zip code 22846, filed in 2021:
Average Adjusted Gross Income (AGI) in 2020: $84,112 (Individual Income Tax Returns)
Here:
$84,112
State:
$86,446
Salary/wage: $67,866 (reported on 83.5% of returns)
Here:
$67,866
State:
$71,185
(% of AGI for various income ranges: 1126.1% for AGIs below $25k, 3351.7% for AGIs $25k-50k, 6400.0% for AGIs $50k-75k, 9372.9% for AGIs $75k-100k, 16329.3% for AGIs $100k-200k, 50410.0% for AGIs over 200k)
Taxable interest for individuals: $2,011 (reported on 35.9% of returns)
This zip code:
$2,011
Virginia:
$1,805
(% of AGI for various income ranges: 5.6% for AGIs below $25k, 36.7% for AGIs $25k-50k, 44.4% for AGIs $50k-75k, 60.0% for AGIs $75k-100k, 194.3% for AGIs $100k-200k, 1046.7% for AGIs over 200k)
Ordinary dividends: $5,800 (reported on 26.2% of returns)
Here:
$5,800
State:
$8,327
(% of AGI for various income ranges: 8.3% for AGIs below $25k, 53.3% for AGIs $25k-50k, 78.9% for AGIs $50k-75k, 342.9% for AGIs $75k-100k, 382.1% for AGIs $100k-200k, 2030.0% for AGIs over 200k)
Net capital gain/loss in AGI: +$14,738 (reported on 25.2% of returns)
Here:
+$14,738
State:
+$24,644
(% of AGI for various income ranges: 6.1% for AGIs below $25k, 58.9% for AGIs $25k-50k, 75.6% for AGIs $50k-75k, 451.4% for AGIs $75k-100k, 587.9% for AGIs $100k-200k, 8360.0% for AGIs over 200k)
Profit/loss from business: +$16,258 (reported on 18.4% of returns)
Here:
+$16,258
State:
+$12,836
(% of AGI for various income ranges: 188.3% for AGIs below $25k, 498.9% for AGIs $25k-50k, 508.9% for AGIs $50k-75k, 294.3% for AGIs $75k-100k, 848.6% for AGIs $100k-200k)
Taxable individual retirement arrangement distribution: $15,664 (reported on 10.7% of returns)
22846:
$15,664
Virginia:
$21,535
(% of AGI for various income ranges: 140.0% for AGIs below $25k, 702.2% for AGIs $50k-75k, 599.3% for AGIs $100k-200k)
Total itemized deductions: $35,200 (reported on 11.7% of returns)
Here:
$35,200
State:
$33,287
(% of AGI for various income ranges: 1270.0% for AGIs $50k-75k, 1112.9% for AGIs $100k-200k, 5076.7% for AGIs over 200k)
Charity contributions: $10,700 (reported on 9.7% of returns)
Here:
$10,700
State:
$10,381
(% of AGI for various income ranges: 170.0% for AGIs $50k-75k, 310.0% for AGIs $100k-200k, 1610.0% for AGIs over 200k)
Taxes paid: $7,875 (reported on 11.7% of returns)
22846:
$7,875
State:
$8,284
(% of AGI for various income ranges: 230.0% for AGIs $50k-75k, 322.9% for AGIs $100k-200k, 953.3% for AGIs over 200k)
Earned income credit: $2,262 (reported on 12.6% of returns)
Here:
$2,262
State:
$2,214
(% of AGI for various income ranges: 75.6% for AGIs below $25k, 87.8% for AGIs $25k-50k)
Percentage of individuals using paid preparers for their 2020 taxes: 92.2%
Here:
92%
State:
92%
(% for various income ranges: 92.3% for AGIs below $25k, 87.0% for AGIs $25k-50k, 92.3% for AGIs $50k-75k, 90.9% for AGIs $75k-100k, 95.5% for AGIs $100k-200k, 100.0% for AGIs over 200k)
Averages for the 2012 tax year for zip code 22846, filed in 2013:
Average Adjusted Gross Income (AGI) in 2012: $67,503 (Individual Income Tax Returns)
Here:
$67,503
State:
$71,192
Salary/wage: $59,268 (reported on 84.4% of returns)
Here:
$59,268
State:
$59,229
(% of AGI for various income ranges: 75.8% for AGIs below $25k, 78.3% for AGIs $25k-50k, 74.6% for AGIs $50k-75k, 75.4% for AGIs $75k-100k, 75.9% for AGIs $100k-200k, 67.5% for AGIs over 200k)
Taxable interest for individuals: $1,272 (reported on 44.4% of returns)
This zip code:
$1,272
Virginia:
$1,600
(% of AGI for various income ranges: 2.3% for AGIs below $25k, 1.5% for AGIs $25k-50k, 0.7% for AGIs $50k-75k, 0.7% for AGIs $75k-100k, 0.8% for AGIs $100k-200k, 0.4% for AGIs over 200k)
Ordinary dividends: $4,029 (reported on 26.7% of returns)
Here:
$4,029
State:
$6,959
(% of AGI for various income ranges: 1.4% for AGIs below $25k, 0.8% for AGIs $25k-50k, 1.0% for AGIs $50k-75k, 0.7% for AGIs $75k-100k, 2.0% for AGIs $100k-200k, 2.5% for AGIs over 200k)
Net capital gain/loss in AGI: +$3,767 (reported on 20.0% of returns)
Here:
+$3,767
State:
+$16,672
(% of AGI for various income ranges: 0.7% for AGIs $50k-75k, 0.8% for AGIs $75k-100k, 1.0% for AGIs $100k-200k, 2.8% for AGIs over 200k)
Profit/loss from business: +$15,012 (reported on 18.9% of returns)
Here:
+$15,012
State:
+$14,116
(% of AGI for various income ranges: 10.2% for AGIs below $25k, 4.6% for AGIs $25k-50k, 3.4% for AGIs $50k-75k, 1.2% for AGIs $75k-100k, 7.8% for AGIs $100k-200k)
Taxable individual retirement arrangement distribution: $19,160 (reported on 11.1% of returns)
22846:
$19,160
Virginia:
$16,667
(% of AGI for various income ranges: 9.2% for AGIs below $25k, 5.5% for AGIs $50k-75k, 6.0% for AGIs $100k-200k)
Total itemized deductions: $24,038 (22% of AGI, reported on 44.4% of returns)
Here:
$24,038
State:
$26,596
Here:
22.4% of AGI
State:
20.1% of AGI
(% of AGI for various income ranges: 12.6% for AGIs below $25k, 14.9% for AGIs $25k-50k, 15.1% for AGIs $50k-75k, 19.7% for AGIs $75k-100k, 15.9% for AGIs $100k-200k, 14.9% for AGIs over 200k)
Charity contributions: $4,256 (reported on 35.6% of returns)
Here:
$4,256
State:
$4,443
(% of AGI for various income ranges: 1.8% for AGIs $25k-50k, 2.3% for AGIs $50k-75k, 2.7% for AGIs $75k-100k, 2.4% for AGIs $100k-200k, 2.4% for AGIs over 200k)
Taxes paid: $7,538 (reported on 44.4% of returns)
22846:
$7,538
State:
$9,951
(% of AGI for various income ranges: 2.0% for AGIs below $25k, 2.6% for AGIs $25k-50k, 3.3% for AGIs $50k-75k, 4.8% for AGIs $75k-100k, 5.6% for AGIs $100k-200k, 7.5% for AGIs over 200k)
Earned income credit: $2,117 (reported on 13.3% of returns)
Here:
$2,117
State:
$2,211
(% of AGI for various income ranges: 5.6% for AGIs below $25k, 1.0% for AGIs $25k-50k)
Percentage of individuals using paid preparers for their 2012 taxes: 54.4%
Here:
54%
State:
46%
(% for various income ranges: 48.1% for AGIs below $25k, 52.4% for AGIs $25k-50k, 57.1% for AGIs $50k-75k, 60.0% for AGIs $75k-100k, 57.1% for AGIs $100k-200k, 75.0% for AGIs over 200k)
Averages for the 2004 tax year for zip code 22846, filed in 2005:
Average Adjusted Gross Income (AGI) in 2004: $49,716 (Individual Income Tax Returns)
Here:
$49,716
State:
$56,704
Salary/wage: $42,639 (reported on 87.6% of returns)
Here:
$42,639
State:
$48,441
(% of AGI for various income ranges: 102.9% for AGIs below $10k, 80.1% for AGIs $10k-25k, 85.7% for AGIs $25k-50k, 83.9% for AGIs $50k-75k, 81.8% for AGIs $75k-100k, 60.6% for AGIs over 100k)
Taxable interest for individuals: $1,408 (reported on 46.8% of returns)
This zip code:
$1,408
Virginia:
$1,688
(% of AGI for various income ranges: 3.3% for AGIs below $10k, 2.7% for AGIs $10k-25k, 1.1% for AGIs $25k-50k, 0.5% for AGIs $50k-75k, 0.6% for AGIs $75k-100k, 1.9% for AGIs over 100k)
Taxable dividends: $2,404 (reported on 26.3% of returns)
Here:
$2,404
State:
$4,028
(% of AGI for various income ranges: 2.0% for AGIs below $10k, 2.3% for AGIs $10k-25k, 1.1% for AGIs $25k-50k, 0.6% for AGIs $50k-75k, 0.5% for AGIs $75k-100k, 1.9% for AGIs over 100k)
Net capital gain/loss: +$7,397 (reported on 20.6% of returns)
Here:
+$7,397
State:
+$14,375
(% of AGI for various income ranges: -3.1% for AGIs below $10k, -0.3% for AGIs $25k-50k, 0.3% for AGIs $50k-75k, 0.1% for AGIs $75k-100k, 8.2% for AGIs over 100k)
Profit/loss from business: +$10,573 (reported on 16.9% of returns)
Here:
+$10,573
State:
+$13,342
(% of AGI for various income ranges: 11.7% for AGIs below $10k, 4.7% for AGIs $10k-25k, 4.2% for AGIs $25k-50k, 4.3% for AGIs $50k-75k, 3.0% for AGIs $75k-100k, 2.7% for AGIs over 100k)
IRA payment deduction: $2,680 (reported on 3.4% of returns)
22846:
$2,680
Virginia:
$2,943
Total itemized deductions: $17,787 (21% of AGI, reported on 38.5% of returns)
Here:
$17,787
State:
$21,492
Here:
20.7% of AGI
State:
21.0% of AGI
(% of AGI for various income ranges: 9.1% for AGIs $10k-25k, 11.5% for AGIs $25k-50k, 13.9% for AGIs $50k-75k, 15.1% for AGIs $75k-100k, 15.6% for AGIs over 100k)
Charity contributions deductions: $3,414 (4% of AGI, reported on 32.6% of returns)
Here:
$3,414
State:
$3,794
Here:
3.8% of AGI
State:
3.5% of AGI
(% of AGI for various income ranges: 1.4% for AGIs $10k-25k, 1.8% for AGIs $25k-50k, 2.5% for AGIs $50k-75k, 2.4% for AGIs $75k-100k, 2.5% for AGIs over 100k)
Total tax: $7,066 (reported on 78.2% of returns)
22846:
$7,066
State:
$9,537
(% of AGI for various income ranges: 4.2% for AGIs below $10k, 4.2% for AGIs $10k-25k, 6.5% for AGIs $25k-50k, 8.2% for AGIs $50k-75k, 10.6% for AGIs $75k-100k, 16.7% for AGIs over 100k)
Earned income credit: $1,462 (reported on 12.4% of returns)
Here:
$1,462
State:
$1,734
Percentage of individuals using paid preparers for their 2004 taxes: 57.8%
Here:
58%
State:
52%
(% for various income ranges: 50.4% for AGIs below $10k, 57.4% for AGIs $10k-25k, 55.8% for AGIs $25k-50k, 61.0% for AGIs $50k-75k, 65.0% for AGIs $75k-100k, 64.7% for AGIs over 100k)
Household received Food Stamps/SNAP in the past 12 months: 51 Household did not receive Food Stamps/SNAP in the past 12 months: 583
Women who had a birth in the past 12 months: 66 (49 now married, 16 unmarried) Women who did not have a birth in the past 12 months: 276 (142 now married, 133 unmarried)
Housing units in zip code 22846 with a mortgage: 413 (57 second mortgage, 56 both second mortgage and home equity loan) Median monthly owner costs for units with a mortgage: $1,690 Median monthly owner costs for units without a mortgage: $632
Residents with income below the poverty level in 2022:
This zip code:
3.2%
Whole state:
10.6%
Residents with income below 50% of the poverty level in 2022:
This zip code:
2.9%
Whole state:
5.2%
Median number of rooms in houses and condos:
Here:
8.4
State:
7.0
Median number of rooms in apartments:
Here:
6.0
State:
4.3
Notable locations in this zip code not listed on our city pages
Churches in zip code 22846 include: Penn Laird Church (A), Massanutten Crossroads Church (B), Mountain Grove Church (C). Display/hide their locations on the map
In group quarters: 54 (-1 institutionalized population)
Size of family households: 236 2-persons, 140 3-persons, 132 4-persons, 16 5-persons, 62 6-persons
Size of nonfamily households: 47 1-person
412 married couples with children.
61 single-parent households (51 men, 10 women).
84.2% of residents of 22846 zip code speak English at home.
1.2% of residents speak Spanish at home (100% very well).
5.8% of residents speak other Indo-European language at home (50% very well, 50% well).
9.4% of residents speak Asian or Pacific Island language at home (27% very well, 53% well, 20% not well).
Foreign born population: 28 (1.5%) (100.0% of them are naturalized citizens)
This zip code:
1.5%
Whole state:
12.7%
41%Greece
30%Azerbaijan
15%Turkey
7%Japan
28%American
12%German
6%European
5%Scottish
4%English
3%Irish
2%Russian
Year of entry for the foreign-born population
922010 or later
02000 to 2009
931990 to 1999
10Before 1990
Public high school in in zip code 22846 not listed on the city page:
CUB RUN ELEM (Location: 1451 SOUTH MONTEVIDEO CIRCLE, Grades: PK-5)
Facilities with environmental interests located in this zip code:
CARGILL TURKEY PRODUCTS TURKEY BREEDERS - GOBBLER (6973 MOUNTAIN GROVE ROAD in PENN LAIRD, VA)
AIR MINOR (AIRS/AFS) STATE MASTER (Virginia pollutants databases) - CEDS-81412, AIR PROGRAM Business SIC classification: TURKEYS AND TURKEY EGGS Business NAICS classification: TURKEY PRODUCTION.
CARGILL TURKEY PRODUCTS TURKEY BREEDERS-WINDSWEPT (1636 WINDSWEPT LANE in PENN LAIRD, VA)
AIR MINOR (AIRS/AFS) STATE MASTER (Virginia pollutants databases) - CEDS-81417, AIR PROGRAM Business SIC classification: TURKEYS AND TURKEY EGGS Business NAICS classification: TURKEY PRODUCTION.
7 ELEVEN 28426 (6132 SPOTSWOOD TRAIL in PENN LAIRD, VA)
Small Quantity Generators, between 100 kg and 1000 kg of hazardous waste/month (Resource Conservation and Recovery Act (tracking hazardous waste)) - notification Organizations: 7 ELEVEN INC (CONTACT/OWNER)
75.5%Electricity
10.2%Bottled, tank, or LP gas
7.8%Fuel oil, kerosene, etc.
3.9%Utility gas
1.6%No fuel used
1.5%Wood
Population in 1990: 704. Population change in the 1990s: +190 (+27.0%).
Place of birth for U.S.-born residents:
This state: 1,176
Northeast: 126
Midwest: 81
South: 260
West: 19
69% of the 22846 zip code residents lived in the same house 5 years ago. Out of people who lived in different houses, 52% lived in this county. Out of people who lived in different counties, 50% lived in Virginia.
99% of the 22846 zip code residents lived in the same house 1 year ago. Out of people who lived in different houses, 160% moved from this county.
Private vs. public school enrollment:
Students in private schools in grades 1 to 8 (elementary and middle school): 24
Here:
10.8%
Virginia:
13.2%
Students in private schools in grades 9 to 12 (high school):
Here:
0.0%
Virginia:
10.2%
Students in private undergraduate colleges:
Here:
0.0%
Virginia:
18.7%
Occupation by median earnings in the past 12 months ($)
105,306Management occupations
97,497Health diagnosing and treating practitioners and other technical occupations
70,022Computer and mathematical occupations
60,939Sales and related occupations
59,557Education, training, and library occupations
43,438Office and administrative support occupations
Top industries in this zip code by the number of employees in 2005:
Real Estate and Rental and Leasing: Lessors of Residential Buildings and Dwellings (20-49 employees: 1 establishment)
Administrative and Support and Waste Management and Remediation Services: Exterminating and Pest Control Services (20-49: 1)
Other Services (except Public Administration): Religious Organizations (10-19: 1, 5-9: 1)
Construction: New Single-Family Housing Construction (except Operative Builders) (10-19: 1, 1-4: 1)
Detailed PMIC statistics for the following Tracts:0118.00
, 0119.00
2003 - 2018 National Fire Incident Reporting System (NFIRS) incidents
Based on the data from the years 2003 - 2018 the average number of fires per year is 7. The highest number of reported fire incidents - 16 took place in 2009, and the least - 1 in 2004. The data has a rising trend.
When looking into fire subcategories, the most reports belonged to: Structure Fires (52.1%), and Mobile Property/Vehicle Fires (26.5%).
Fire incident types reported to NFIRS in Zip Code 22846


 Nearest zip codes: 24471, 22832, 22840, 22801, 22807, 22841.


 (Students: 1,356, Location: 368 BLAZER DRIVE, Grades: 9-12)


 Based on the data from the years 2003 - 2018 the average number of fires per year is 7. The highest number of reported fire incidents - 16 took place in 2009, and the least - 1 in 2004. The data has a rising trend.
 When looking into fire subcategories, the most reports belonged to: Structure Fires (52.1%), and Mobile Property/Vehicle Fires (26.5%).