Estimated zip code population in 2022: 1,307 Zip code population in 2010: 899 Zip code population in 2000: 899
Houses and condos: 552 Renter-occupied apartments: 85
% of renters here:
19%
State:
33%
March 2022 cost of living index in zip code 22850: 85.9 (less than average, U.S. average is 100)
Land area: 12.0 sq. mi. Water area: 0.0 sq. mi.
Population density: 109 people per square mile
(very low).
OSM Map
General Map
Google Map
MSN Map
OSM Map
General Map
Google Map
MSN Map
OSM Map
General Map
Google Map
MSN Map
OSM Map
General Map
Google Map
MSN Map
Please wait while loading the map...
Real estate property taxes paid for housing units in 2022:
This zip code:
0.5% ($1,642)
Virginia:
0.7% ($2,617)
Median real estate property taxes paid for housing units with mortgages in 2022: $1,825 Median real estate property taxes paid for housing units with no mortgage in 2022: $1,359
Business Search- 14 Million verified businesses
Males: 657
(50.3%)
Females: 650
(49.7%)
For population 25 years and over in 22850:
High school or higher: 80.8%
Bachelor's degree or higher: 28.4%
Graduate or professional degree: 11.6%
Unemployed: 1.5%
Mean travel time to work (commute): 24.7 minutes
For population 15 years and over in 22850:
Never married: 23.4%
Now married: 62.6%
Separated: 1.9%
Widowed: 6.1%
Divorced: 6.1%
Zip code 22850 compared to state average:
Unemployed percentage below state average.
Black race population percentage significantly below state average.
Hispanic race population percentage significantly below state average.
Median age significantly above state average.
Foreign-born population percentage significantly below state average.
Renting percentage below state average.
Length of stay since moving in significantly above state average.
Estimated median house/condo value in 2022: $302,418
22850:
$302,418
Virginia:
$365,700
Median resident age:
This zip code:
49.5 years
Virginia median age:
39.0 years
Average household size:
This zip code:
2.9 people
Virginia:
2.5 people
Averages for the 2020 tax year for zip code 22850, filed in 2021:
Average Adjusted Gross Income (AGI) in 2020: $59,794 (Individual Income Tax Returns)
Here:
$59,794
State:
$86,446
Salary/wage: $49,945 (reported on 85.1% of returns)
Here:
$49,945
State:
$71,185
(% of AGI for various income ranges: 1290.0% for AGIs below $25k, 3640.0% for AGIs $25k-50k, 6866.0% for AGIs $50k-75k, 12106.7% for AGIs $75k-100k, 20280.0% for AGIs $100k-200k)
Taxable interest for individuals: $485 (reported on 27.7% of returns)
This zip code:
$485
Virginia:
$1,805
(% of AGI for various income ranges: 11.1% for AGIs below $25k, 27.0% for AGIs $25k-50k, 30.0% for AGIs $75k-100k, 42.5% for AGIs $100k-200k)
Ordinary dividends: $1,786 (reported on 14.9% of returns)
Here:
$1,786
State:
$8,327
(% of AGI for various income ranges: 56.7% for AGIs below $25k, 30.0% for AGIs $50k-75k, 147.5% for AGIs $100k-200k)
Net capital gain/loss in AGI: +$7,400 (reported on 14.9% of returns)
Here:
+$7,400
State:
+$24,644
(% of AGI for various income ranges: 148.9% for AGIs below $25k, 38.0% for AGIs $50k-75k, 912.5% for AGIs $100k-200k)
Profit/loss from business: +$9,012 (reported on 17.0% of returns)
Here:
+$9,012
State:
+$12,836
(% of AGI for various income ranges: 603.0% for AGIs $25k-50k, 393.3% for AGIs $75k-100k)
Taxable individual retirement arrangement distribution: $8,025 (reported on 8.5% of returns)
22850:
$8,025
Virginia:
$21,535
(% of AGI for various income ranges: 321.0% for AGIs $25k-50k)
Earned income credit: $2,017 (reported on 12.8% of returns)
Here:
$2,017
State:
$2,214
(% of AGI for various income ranges: 67.8% for AGIs below $25k, 60.0% for AGIs $25k-50k)
Percentage of individuals using paid preparers for their 2020 taxes: 95.7%
Here:
96%
State:
92%
(% for various income ranges: 100.0% for AGIs below $25k, 100.0% for AGIs $25k-50k, 100.0% for AGIs $50k-75k, 83.3% for AGIs $75k-100k, 87.5% for AGIs $100k-200k)
Averages for the 2012 tax year for zip code 22850, filed in 2013:
Average Adjusted Gross Income (AGI) in 2012: $51,312 (Individual Income Tax Returns)
Here:
$51,312
State:
$71,192
Salary/wage: $44,067 (reported on 85.7% of returns)
Here:
$44,067
State:
$59,229
(% of AGI for various income ranges: 76.7% for AGIs below $25k, 84.2% for AGIs $25k-50k, 76.9% for AGIs $50k-75k, 68.5% for AGIs $75k-100k, 66.6% for AGIs $100k-200k)
Taxable interest for individuals: $943 (reported on 33.3% of returns)
This zip code:
$943
Virginia:
$1,600
(% of AGI for various income ranges: 0.4% for AGIs below $25k, 0.3% for AGIs $25k-50k, 1.0% for AGIs $50k-75k, 1.7% for AGIs $75k-100k, 0.1% for AGIs $100k-200k)
Ordinary dividends: $1,429 (reported on 16.7% of returns)
Here:
$1,429
State:
$6,959
(% of AGI for various income ranges: 0.2% for AGIs below $25k, 1.1% for AGIs $50k-75k, 1.3% for AGIs $75k-100k)
Net capital gain/loss in AGI: +$1,760 (reported on 11.9% of returns)
Here:
+$1,760
State:
+$16,672
Profit/loss from business: +$8,088 (reported on 19.0% of returns)
Here:
+$8,088
State:
+$14,116
Taxable individual retirement arrangement distribution: $4,525 (reported on 9.5% of returns)
22850:
$4,525
Virginia:
$16,667
Total itemized deductions: $19,564 (20% of AGI, reported on 26.2% of returns)
Here:
$19,564
State:
$26,596
Here:
19.9% of AGI
State:
20.1% of AGI
(% of AGI for various income ranges: 7.3% for AGIs $25k-50k, 11.1% for AGIs $50k-75k, 11.6% for AGIs $75k-100k, 12.7% for AGIs $100k-200k)
Charity contributions: $3,625 (reported on 19.0% of returns)
Here:
$3,625
State:
$4,443
(% of AGI for various income ranges: 3.4% for AGIs $50k-75k, 1.7% for AGIs $100k-200k)
Taxes paid: $6,882 (reported on 26.2% of returns)
22850:
$6,882
State:
$9,951
(% of AGI for various income ranges: 1.6% for AGIs $25k-50k, 3.1% for AGIs $50k-75k, 3.4% for AGIs $75k-100k, 5.8% for AGIs $100k-200k)
Earned income credit: $2,317 (reported on 14.3% of returns)
Here:
$2,317
State:
$2,211
(% of AGI for various income ranges: 4.2% for AGIs below $25k, 1.4% for AGIs $25k-50k)
Percentage of individuals using paid preparers for their 2012 taxes: 57.1%
Here:
57%
State:
46%
(% for various income ranges: 50.0% for AGIs below $25k, 58.3% for AGIs $25k-50k, 62.5% for AGIs $50k-75k, 50.0% for AGIs $75k-100k, 75.0% for AGIs $100k-200k)
Averages for the 2004 tax year for zip code 22850, filed in 2005:
Average Adjusted Gross Income (AGI) in 2004: $37,220 (Individual Income Tax Returns)
Here:
$37,220
State:
$56,704
Salary/wage: $33,062 (reported on 89.9% of returns)
Here:
$33,062
State:
$48,441
(% of AGI for various income ranges: 170.4% for AGIs below $10k, 80.6% for AGIs $10k-25k, 83.3% for AGIs $25k-50k, 78.8% for AGIs $50k-75k, 83.4% for AGIs $75k-100k, 63.7% for AGIs over 100k)
Taxable interest for individuals: $1,258 (reported on 41.7% of returns)
This zip code:
$1,258
Virginia:
$1,688
(% of AGI for various income ranges: 8.2% for AGIs below $10k, 0.6% for AGIs $10k-25k, 1.0% for AGIs $25k-50k, 2.9% for AGIs $50k-75k, 0.1% for AGIs $75k-100k, 0.4% for AGIs over 100k)
Taxable dividends: $949 (reported on 18.3% of returns)
Here:
$949
State:
$4,028
(% of AGI for various income ranges: 1.0% for AGIs below $10k, 0.3% for AGIs $10k-25k, 0.7% for AGIs $25k-50k, 0.1% for AGIs $50k-75k, 1.4% for AGIs $75k-100k)
Net capital gain/loss: +$2,931 (reported on 13.6% of returns)
Here:
+$2,931
State:
+$14,375
Profit/loss from business: +$5,629 (reported on 14.5% of returns)
Here:
+$5,629
State:
+$13,342
Total itemized deductions: $14,947 (24% of AGI, reported on 22.2% of returns)
Here:
$14,947
State:
$21,492
Here:
23.6% of AGI
State:
21.0% of AGI
(% of AGI for various income ranges: 8.5% for AGIs $10k-25k, 7.7% for AGIs $25k-50k, 10.8% for AGIs $50k-75k, 23.3% for AGIs $75k-100k)
Charity contributions deductions: $3,299 (5% of AGI, reported on 15.7% of returns)
Here:
$3,299
State:
$3,794
Here:
5.4% of AGI
State:
3.5% of AGI
(% of AGI for various income ranges: 9.2% for AGIs below $10k, 0.7% for AGIs $25k-50k, 2.1% for AGIs $50k-75k, 4.6% for AGIs $75k-100k)
Total tax: $3,928 (reported on 78.0% of returns)
22850:
$3,928
State:
$9,537
(% of AGI for various income ranges: 4.1% for AGIs below $10k, 5.3% for AGIs $10k-25k, 6.7% for AGIs $25k-50k, 8.2% for AGIs $50k-75k, 9.9% for AGIs $75k-100k, 13.2% for AGIs over 100k)
Earned income credit: $1,500 (reported on 12.6% of returns)
Here:
$1,500
State:
$1,734
Percentage of individuals using paid preparers for their 2004 taxes: 65.1%
Here:
65%
State:
52%
(% for various income ranges: 55.7% for AGIs below $10k, 59.8% for AGIs $10k-25k, 68.0% for AGIs $25k-50k, 72.0% for AGIs $50k-75k, 63.2% for AGIs $75k-100k, 84.6% for AGIs over 100k)
Size of family households: 197 2-persons, 78 3-persons, 66 4-persons, 18 5-persons, 4 6-persons, 15 7-or-more-persons
Size of nonfamily households: 49 1-person, 21 2-persons
183 married couples with children.
17 single-parent households (17 men).
99.7% of residents of 22850 zip code speak English at home.
Foreign born population: 0 (0.0%)
:
0.0%
Whole state:
12.7%
43%American
22%German
11%Irish
5%Slovak
3%English
1%Italian
Housing units lacking complete plumbing facilities: 1.1% Housing units lacking complete kitchen facilities: 4.1%
36.7%Electricity
34.4%Fuel oil, kerosene, etc.
15.3%Bottled, tank, or LP gas
13.0%Wood
1.1%Other fuel
Place of birth for U.S.-born residents:
This state: 1,072
Northeast: 120
Midwest: 22
South: 54
West: 28
71% of the 22850 zip code residents lived in the same house 5 years ago. Out of people who lived in different houses, 62% lived in this county. Out of people who lived in different counties, 50% lived in Virginia.
94% of the 22850 zip code residents lived in the same house 1 year ago. Out of people who lived in different houses, 95% moved from this county.
Private vs. public school enrollment:
Students in private schools in grades 1 to 8 (elementary and middle school): 47
Here:
57.5%
Virginia:
13.2%
Students in private schools in grades 9 to 12 (high school): 33
Here:
31.2%
Virginia:
10.2%
Students in private undergraduate colleges:
Here:
0.0%
Virginia:
18.7%
Occupation by median earnings in the past 12 months ($)
49,932Transportation occupations
44,894Installation, maintenance, and repair occupations
43,239Construction and extraction occupations
35,209Office and administrative support occupations
33,519Sales and related occupations
30,262Management occupations
Top industries in this zip code by the number of employees in 2005:
Construction: New Single-Family Housing Construction (except Operative Builders) (20-49 employees: 1 establishment, 1-4 employees: 1 establishment)
Construction: Commercial and Institutional Building Construction (1-4: 2)
Construction: New Multifamily Housing Construction (except Operative Builders) (1-4: 1)
Wholesale Trade: Jewelry, Watch, Precious Stone, and Precious Metal Merchant Wholesalers (1-4: 1)
Other Services (except Public Administration): Religious Organizations (1-4: 1)
Other Services (except Public Administration): Cemeteries and Crematories (1-4: 1)
Accommodation and Food Services: Recreational and Vacation Camps (except Campgrounds) (1-4: 1)
Fatal accident statistics in 2011:
Fatal accident count: 1
Vehicles involved in fatal accidents: 2
Fatal accidents caused by drunken drivers: 0
Fatalities: 1
Persons involved in fatal accidents: 3
Pedestrians involved in fatal accidents: 0
Fatal accident statistics in 2010:
Fatal accident count: 1
Vehicles involved in fatal accidents: 1
Fatal accidents caused by drunken drivers: 0
Fatalities: 1
Persons involved in fatal accidents: 3
Pedestrians involved in fatal accidents: 0
Home Mortgage Disclosure Act Aggregated Statistics For Year 2009 (Based on 2 partial tracts)
A) FHA, FSA/RHS & VA Home Purchase Loans
B) Conventional Home Purchase Loans
C) Refinancings
D) Home Improvement Loans
E) Loans on Dwellings For 5+ Families
F) Non-occupant Loans on < 5 Family Dwellings (A B C & D)
G) Loans On Manufactured Home Dwelling (A B C & D)
Number
Average Value
Number
Average Value
Number
Average Value
Number
Average Value
Number
Average Value
Number
Average Value
Number
Average Value
LOANS ORIGINATED
6
$148,417
16
$179,554
50
$180,483
5
$24,616
1
$174,130
1
$158,250
2
$116,845
APPLICATIONS APPROVED, NOT ACCEPTED
0
$0
0
$0
5
$148,380
1
$12,480
0
$0
2
$114,860
0
$0
APPLICATIONS DENIED
2
$141,515
1
$9,640
13
$126,005
2
$87,915
0
$0
1
$29,490
2
$57,855
APPLICATIONS WITHDRAWN
2
$137,830
2
$147,470
9
$202,112
0
$0
0
$0
0
$0
1
$133,860
FILES CLOSED FOR INCOMPLETENESS
0
$0
0
$0
1
$133,290
0
$0
0
$0
0
$0
0
$0
Aggregated Statistics For Year 2008 (Based on 2 partial tracts)
A) FHA, FSA/RHS & VA Home Purchase Loans
B) Conventional Home Purchase Loans
C) Refinancings
D) Home Improvement Loans
F) Non-occupant Loans on < 5 Family Dwellings (A B C & D)
G) Loans On Manufactured Home Dwelling (A B C & D)
Number
Average Value
Number
Average Value
Number
Average Value
Number
Average Value
Number
Average Value
Number
Average Value
LOANS ORIGINATED
4
$162,788
15
$196,327
31
$174,533
1
$42,540
2
$224,045
2
$114,575
APPLICATIONS APPROVED, NOT ACCEPTED
0
$0
1
$146,900
6
$197,953
0
$0
0
$0
0
$0
APPLICATIONS DENIED
0
$0
3
$163,543
19
$183,265
2
$42,825
0
$0
3
$76,003
APPLICATIONS WITHDRAWN
0
$0
2
$202,205
9
$209,864
0
$0
0
$0
0
$0
FILES CLOSED FOR INCOMPLETENESS
0
$0
0
$0
1
$155,980
0
$0
0
$0
0
$0
Aggregated Statistics For Year 2007 (Based on 2 partial tracts)
A) FHA, FSA/RHS & VA Home Purchase Loans
B) Conventional Home Purchase Loans
C) Refinancings
D) Home Improvement Loans
F) Non-occupant Loans on < 5 Family Dwellings (A B C & D)
G) Loans On Manufactured Home Dwelling (A B C & D)
Number
Average Value
Number
Average Value
Number
Average Value
Number
Average Value
Number
Average Value
Number
Average Value
LOANS ORIGINATED
4
$172,570
22
$207,028
37
$156,900
6
$102,947
3
$240,493
3
$108,903
APPLICATIONS APPROVED, NOT ACCEPTED
0
$0
2
$86,500
7
$90,429
1
$13,610
1
$114,010
0
$0
APPLICATIONS DENIED
0
$0
3
$165,057
19
$167,832
2
$66,645
0
$0
3
$96,803
APPLICATIONS WITHDRAWN
1
$93,590
2
$129,890
6
$205,137
1
$17,020
0
$0
0
$0
FILES CLOSED FOR INCOMPLETENESS
0
$0
0
$0
3
$223,100
0
$0
0
$0
0
$0
Aggregated Statistics For Year 2006 (Based on 2 partial tracts)
A) FHA, FSA/RHS & VA Home Purchase Loans
B) Conventional Home Purchase Loans
C) Refinancings
D) Home Improvement Loans
E) Loans on Dwellings For 5+ Families
F) Non-occupant Loans on < 5 Family Dwellings (A B C & D)
G) Loans On Manufactured Home Dwelling (A B C & D)
Number
Average Value
Number
Average Value
Number
Average Value
Number
Average Value
Number
Average Value
Number
Average Value
Number
Average Value
LOANS ORIGINATED
1
$73,740
39
$149,435
40
$145,019
6
$85,837
0
$0
10
$96,027
2
$67,780
APPLICATIONS APPROVED, NOT ACCEPTED
0
$0
2
$214,120
5
$140,438
0
$0
0
$0
1
$82,240
0
$0
APPLICATIONS DENIED
1
$70,330
5
$115,142
27
$122,137
3
$27,227
1
$99,260
1
$116,280
6
$78,935
APPLICATIONS WITHDRAWN
1
$145,770
1
$170,160
8
$145,770
0
$0
0
$0
1
$40,840
1
$76,570
FILES CLOSED FOR INCOMPLETENESS
0
$0
0
$0
2
$330,960
0
$0
0
$0
0
$0
0
$0
Aggregated Statistics For Year 2005 (Based on 2 partial tracts)
A) FHA, FSA/RHS & VA Home Purchase Loans
B) Conventional Home Purchase Loans
C) Refinancings
D) Home Improvement Loans
F) Non-occupant Loans on < 5 Family Dwellings (A B C & D)
G) Loans On Manufactured Home Dwelling (A B C & D)
Number
Average Value
Number
Average Value
Number
Average Value
Number
Average Value
Number
Average Value
Number
Average Value
LOANS ORIGINATED
1
$175,260
30
$149,325
37
$130,885
6
$46,132
6
$125,257
4
$73,170
APPLICATIONS APPROVED, NOT ACCEPTED
1
$128,750
4
$90,042
5
$117,750
0
$0
0
$0
1
$19,850
APPLICATIONS DENIED
1
$82,240
5
$133,972
30
$137,943
4
$53,458
1
$17,020
5
$93,134
APPLICATIONS WITHDRAWN
0
$0
5
$120,360
11
$129,373
1
$23,820
1
$54,450
0
$0
FILES CLOSED FOR INCOMPLETENESS
1
$72,030
1
$19,280
2
$168,740
0
$0
0
$0
0
$0
Aggregated Statistics For Year 2004 (Based on 2 partial tracts)
A) FHA, FSA/RHS & VA Home Purchase Loans
B) Conventional Home Purchase Loans
C) Refinancings
D) Home Improvement Loans
F) Non-occupant Loans on < 5 Family Dwellings (A B C & D)
G) Loans On Manufactured Home Dwelling (A B C & D)
Detailed PMIC statistics for the following Tracts:0107.00
2002 - 2018 National Fire Incident Reporting System (NFIRS) incidents
Based on the data from the years 2002 - 2018 the average number of fires per year is 9. The highest number of reported fire incidents - 22 took place in 2009, and the least - 2 in 2017. The data has a declining trend.
When looking into fire subcategories, the most reports belonged to: Structure Fires (53.2%), and Outside Fires (23.7%).
Fire incident types reported to NFIRS in Zip Code 22850


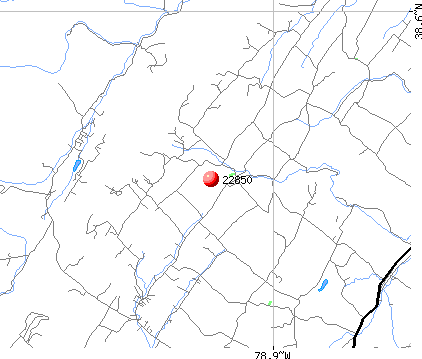 Nearest zip codes: 22834, 22802, 22830, 22807, 22831, 22801.


 Based on the data from the years 2002 - 2018 the average number of fires per year is 9. The highest number of reported fire incidents - 22 took place in 2009, and the least - 2 in 2017. The data has a declining trend.
 When looking into fire subcategories, the most reports belonged to: Structure Fires (53.2%), and Outside Fires (23.7%).