Estimated zip code population in 2022: 5,056 Zip code population in 2010: 4,367 Zip code population in 2000: 4,003
Houses and condos: 1,864 Renter-occupied apartments: 488
% of renters here:
28%
State:
33%
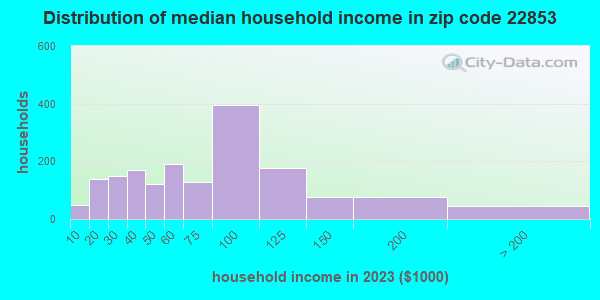
March 2022 cost of living index in zip code 22853: 86.4 (less than average, U.S. average is 100)
Land area: 36.5 sq. mi. Water area: 0.2 sq. mi.
Population density: 139 people per square mile
(very low).
OSM Map
General Map
Google Map
MSN Map
OSM Map
General Map
Google Map
MSN Map
OSM Map
General Map
Google Map
MSN Map
OSM Map
General Map
Google Map
MSN Map
Please wait while loading the map...
Real estate property taxes paid for housing units in 2022:
This zip code:
0.6% ($1,350)
Virginia:
0.7% ($2,617)
Median real estate property taxes paid for housing units with mortgages in 2022: $1,360 (0.6%) Median real estate property taxes paid for housing units with no mortgage in 2022: $1,364 (0.7%)
Business Search- 14 Million verified businesses
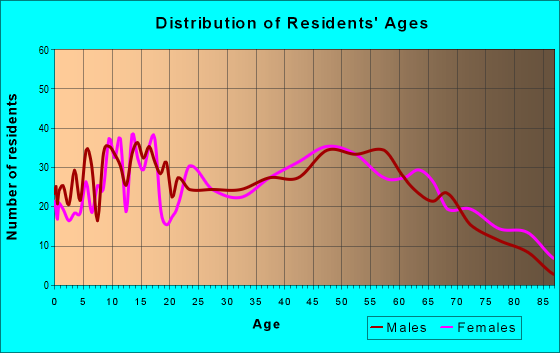
Males: 2,739
(54.2%)
Females: 2,317
(45.8%)
For population 25 years and over in 22853:
High school or higher: 84.1%
Bachelor's degree or higher: 14.4%
Graduate or professional degree: 2.3%
Unemployed: 5.5%
Mean travel time to work (commute): 24.7 minutes
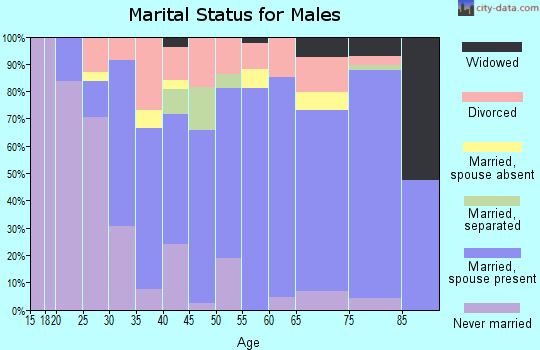
For population 15 years and over in 22853:
Never married: 30.7%
Now married: 47.3%
Separated: 2.4%
Widowed: 6.0%
Divorced: 13.7%
Zip code 22853 compared to state average:
Median house value below state average.
Black race population percentage significantly below state average.
Foreign-born population percentage significantly below state average.
Length of stay since moving in significantly above state average.
Number of college students below state average.
Percentage of population with a bachelor's degree or higher significantly below state average.
Estimated median house/condo value in 2022: $216,751
22853:
$216,751
Virginia:
$365,700
According to our research of Virginia and other state lists, there were 15 registered sex offenders living in 22853 zip code as of May 23, 2024. The ratio of all residents to sex offenders in zip code 22853 is 300 to 1. The ratio of registered sex offenders to all residents in this zip code is near the state average.
Median resident age:
This zip code:
42.4 years
Virginia median age:
39.0 years
Average household size:
This zip code:
2.9 people
Virginia:
2.5 people
Averages for the 2020 tax year for zip code 22853, filed in 2021:
Average Adjusted Gross Income (AGI) in 2020: $47,530 (Individual Income Tax Returns)
Here:
$47,530
State:
$86,446
Salary/wage: $40,797 (reported on 87.2% of returns)
Here:
$40,797
State:
$71,185
(% of AGI for various income ranges: 1298.4% for AGIs below $25k, 3736.8% for AGIs $25k-50k, 6710.0% for AGIs $50k-75k, 9755.6% for AGIs $75k-100k, 15656.4% for AGIs $100k-200k)
Taxable interest for individuals: $1,240 (reported on 25.5% of returns)
This zip code:
$1,240
Virginia:
$1,805
(% of AGI for various income ranges: 15.2% for AGIs below $25k, 19.5% for AGIs $25k-50k, 52.6% for AGIs $50k-75k, 62.5% for AGIs $75k-100k, 229.1% for AGIs $100k-200k)
Ordinary dividends: $4,133 (reported on 14.0% of returns)
Here:
$4,133
State:
$8,327
(% of AGI for various income ranges: 18.6% for AGIs below $25k, 24.5% for AGIs $25k-50k, 46.7% for AGIs $50k-75k, 85.0% for AGIs $75k-100k, 770.9% for AGIs $100k-200k)
Net capital gain/loss in AGI: +$8,264 (reported on 10.6% of returns)
Here:
+$8,264
State:
+$24,644
(% of AGI for various income ranges: 15.9% for AGIs below $25k, 21.2% for AGIs $25k-50k, 40.4% for AGIs $50k-75k, 145.6% for AGIs $75k-100k, 1368.2% for AGIs $100k-200k)
Profit/loss from business: +$13,284 (reported on 13.2% of returns)
Here:
+$13,284
State:
+$12,836
(% of AGI for various income ranges: 104.3% for AGIs below $25k, 99.5% for AGIs $25k-50k, 180.4% for AGIs $50k-75k, 241.2% for AGIs $75k-100k, 1846.4% for AGIs $100k-200k)
Taxable individual retirement arrangement distribution: $10,650 (reported on 7.7% of returns)
22853:
$10,650
Virginia:
$21,535
(% of AGI for various income ranges: 38.7% for AGIs below $25k, 73.6% for AGIs $25k-50k, 231.5% for AGIs $50k-75k, 578.2% for AGIs $100k-200k)
Total itemized deductions: $28,538 (reported on 3.4% of returns)
Here:
$28,538
State:
$33,287
(% of AGI for various income ranges: 400.7% for AGIs $50k-75k, 1091.8% for AGIs $100k-200k)
Charity contributions: $10,983 (reported on 2.6% of returns)
Here:
$10,983
State:
$10,381
(% of AGI for various income ranges: 78.1% for AGIs $50k-75k, 407.3% for AGIs $100k-200k)
Taxes paid: $5,912 (reported on 3.4% of returns)
22853:
$5,912
State:
$8,284
(% of AGI for various income ranges: 79.3% for AGIs $50k-75k, 235.5% for AGIs $100k-200k)
Earned income credit: $1,991 (reported on 19.6% of returns)
Here:
$1,991
State:
$2,214
(% of AGI for various income ranges: 89.2% for AGIs below $25k, 63.2% for AGIs $25k-50k)
Percentage of individuals using paid preparers for their 2020 taxes: 94.5%
Here:
94%
State:
92%
(% for various income ranges: 94.3% for AGIs below $25k, 95.6% for AGIs $25k-50k, 91.7% for AGIs $50k-75k, 95.5% for AGIs $75k-100k, 94.7% for AGIs $100k-200k, 100.0% for AGIs over 200k)
Averages for the 2012 tax year for zip code 22853, filed in 2013:
Average Adjusted Gross Income (AGI) in 2012: $39,867 (Individual Income Tax Returns)
Here:
$39,867
State:
$71,192
Salary/wage: $35,164 (reported on 89.2% of returns)
Here:
$35,164
State:
$59,229
(% of AGI for various income ranges: 81.5% for AGIs below $25k, 86.5% for AGIs $25k-50k, 82.4% for AGIs $50k-75k, 80.4% for AGIs $75k-100k, 60.0% for AGIs $100k-200k)
Taxable interest for individuals: $975 (reported on 31.4% of returns)
This zip code:
$975
Virginia:
$1,600
(% of AGI for various income ranges: 1.2% for AGIs below $25k, 0.7% for AGIs $25k-50k, 0.5% for AGIs $50k-75k, 0.4% for AGIs $75k-100k, 1.2% for AGIs $100k-200k)
Ordinary dividends: $2,466 (reported on 15.7% of returns)
Here:
$2,466
State:
$6,959
(% of AGI for various income ranges: 0.9% for AGIs below $25k, 0.4% for AGIs $25k-50k, 0.7% for AGIs $50k-75k, 0.8% for AGIs $75k-100k, 2.4% for AGIs $100k-200k)
Net capital gain/loss in AGI: +$6,089 (reported on 8.8% of returns)
Here:
+$6,089
State:
+$16,672
(% of AGI for various income ranges: 0.9% for AGIs $50k-75k, 2.6% for AGIs $75k-100k, 3.6% for AGIs $100k-200k)
Profit/loss from business: +$9,081 (reported on 13.2% of returns)
Here:
+$9,081
State:
+$14,116
(% of AGI for various income ranges: 5.6% for AGIs below $25k, 2.1% for AGIs $25k-50k, 4.4% for AGIs $50k-75k, 2.9% for AGIs $100k-200k)
Taxable individual retirement arrangement distribution: $8,263 (reported on 9.3% of returns)
22853:
$8,263
Virginia:
$16,667
(% of AGI for various income ranges: 2.9% for AGIs below $25k, 1.3% for AGIs $25k-50k, 2.2% for AGIs $50k-75k, 3.2% for AGIs $100k-200k)
Total itemized deductions: $18,145 (25% of AGI, reported on 23.0% of returns)
Here:
$18,145
State:
$26,596
Here:
25.2% of AGI
State:
20.1% of AGI
(% of AGI for various income ranges: 5.3% for AGIs below $25k, 8.3% for AGIs $25k-50k, 11.7% for AGIs $50k-75k, 12.8% for AGIs $75k-100k, 13.9% for AGIs $100k-200k)
Charity contributions: $3,266 (reported on 15.7% of returns)
Here:
$3,266
State:
$4,443
(% of AGI for various income ranges: 0.4% for AGIs below $25k, 0.7% for AGIs $25k-50k, 1.0% for AGIs $50k-75k, 1.7% for AGIs $75k-100k, 2.7% for AGIs $100k-200k)
Taxes paid: $4,691 (reported on 23.0% of returns)
22853:
$4,691
State:
$9,951
(% of AGI for various income ranges: 0.8% for AGIs below $25k, 1.7% for AGIs $25k-50k, 2.6% for AGIs $50k-75k, 3.7% for AGIs $75k-100k, 4.9% for AGIs $100k-200k)
Earned income credit: $2,083 (reported on 22.5% of returns)
Here:
$2,083
State:
$2,211
(% of AGI for various income ranges: 6.1% for AGIs below $25k, 1.2% for AGIs $25k-50k)
Percentage of individuals using paid preparers for their 2012 taxes: 62.3%
Here:
62%
State:
46%
(% for various income ranges: 58.3% for AGIs below $25k, 61.9% for AGIs $25k-50k, 69.7% for AGIs $50k-75k, 64.3% for AGIs $75k-100k, 70.0% for AGIs $100k-200k)
Averages for the 2004 tax year for zip code 22853, filed in 2005:
Average Adjusted Gross Income (AGI) in 2004: $35,201 (Individual Income Tax Returns)
Here:
$35,201
State:
$56,704
Salary/wage: $31,074 (reported on 88.7% of returns)
Here:
$31,074
State:
$48,441
(% of AGI for various income ranges: 144.9% for AGIs below $10k, 83.2% for AGIs $10k-25k, 85.2% for AGIs $25k-50k, 87.2% for AGIs $50k-75k, 70.9% for AGIs $75k-100k, 43.3% for AGIs over 100k)
Taxable interest for individuals: $1,305 (reported on 39.2% of returns)
This zip code:
$1,305
Virginia:
$1,688
(% of AGI for various income ranges: 5.8% for AGIs below $10k, 2.5% for AGIs $10k-25k, 1.2% for AGIs $25k-50k, 0.6% for AGIs $50k-75k, 3.0% for AGIs $75k-100k, 1.1% for AGIs over 100k)
Taxable dividends: $2,035 (reported on 18.5% of returns)
Here:
$2,035
State:
$4,028
(% of AGI for various income ranges: 4.0% for AGIs below $10k, 0.7% for AGIs $10k-25k, 0.9% for AGIs $25k-50k, 0.8% for AGIs $50k-75k, 2.5% for AGIs $75k-100k, 1.1% for AGIs over 100k)
Net capital gain/loss: +$9,509 (reported on 14.2% of returns)
Here:
+$9,509
State:
+$14,375
(% of AGI for various income ranges: 0.4% for AGIs below $10k, 0.8% for AGIs $10k-25k, 0.7% for AGIs $25k-50k, 1.2% for AGIs $50k-75k, 4.2% for AGIs $75k-100k, 17.5% for AGIs over 100k)
Profit/loss from business: +$12,190 (reported on 14.1% of returns)
Here:
+$12,190
State:
+$13,342
(% of AGI for various income ranges: 12.1% for AGIs below $10k, 4.2% for AGIs $10k-25k, 3.5% for AGIs $25k-50k, 4.4% for AGIs $50k-75k, 6.1% for AGIs $75k-100k, 7.7% for AGIs over 100k)
IRA payment deduction: $2,980 (reported on 2.6% of returns)
22853:
$2,980
Virginia:
$2,943
Total itemized deductions: $14,834 (23% of AGI, reported on 20.4% of returns)
Here:
$14,834
State:
$21,492
Here:
23.3% of AGI
State:
21.0% of AGI
(% of AGI for various income ranges: 5.9% for AGIs $10k-25k, 7.7% for AGIs $25k-50k, 9.2% for AGIs $50k-75k, 14.7% for AGIs $75k-100k, 8.9% for AGIs over 100k)
Charity contributions deductions: $3,075 (5% of AGI, reported on 15.4% of returns)
Here:
$3,075
State:
$3,794
Here:
4.5% of AGI
State:
3.5% of AGI
(% of AGI for various income ranges: 0.6% for AGIs $10k-25k, 0.9% for AGIs $25k-50k, 1.3% for AGIs $50k-75k, 2.4% for AGIs $75k-100k, 2.5% for AGIs over 100k)
Total tax: $4,003 (reported on 75.1% of returns)
22853:
$4,003
State:
$9,537
(% of AGI for various income ranges: 3.4% for AGIs below $10k, 4.2% for AGIs $10k-25k, 6.4% for AGIs $25k-50k, 8.2% for AGIs $50k-75k, 10.5% for AGIs $75k-100k, 16.5% for AGIs over 100k)
Earned income credit: $1,620 (reported on 17.4% of returns)
Here:
$1,620
State:
$1,734
Percentage of individuals using paid preparers for their 2004 taxes: 66.9%
Here:
67%
State:
52%
(% for various income ranges: 57.6% for AGIs below $10k, 67.7% for AGIs $10k-25k, 68.9% for AGIs $25k-50k, 65.8% for AGIs $50k-75k, 74.1% for AGIs $75k-100k, 88.1% for AGIs over 100k)
Likely homosexual households (counted as self-reported same-sex unmarried-partner households)
Lesbian couples: 0.3% of all households
Gay men: 0.0% of all households
Household received Food Stamps/SNAP in the past 12 months: 106 Household did not receive Food Stamps/SNAP in the past 12 months: 1,614
Women who had a birth in the past 12 months: 15 (16 now married, 0 unmarried) Women who did not have a birth in the past 12 months: 917 (381 now married, 537 unmarried)
Housing units in zip code 22853 with a mortgage: 686 (109 second mortgage, 94 both second mortgage and home equity loan) Houses without a mortgage: 27
Median monthly owner costs for units with a mortgage: $1,274 Median monthly owner costs for units without a mortgage: $414
Residents with income below the poverty level in 2022:
This zip code:
10.1%
Whole state:
10.6%
Residents with income below 50% of the poverty level in 2022:
This zip code:
7.3%
Whole state:
5.2%
Median number of rooms in houses and condos:
Here:
6.2
State:
7.0
Median number of rooms in apartments:
Here:
4.7
State:
4.3
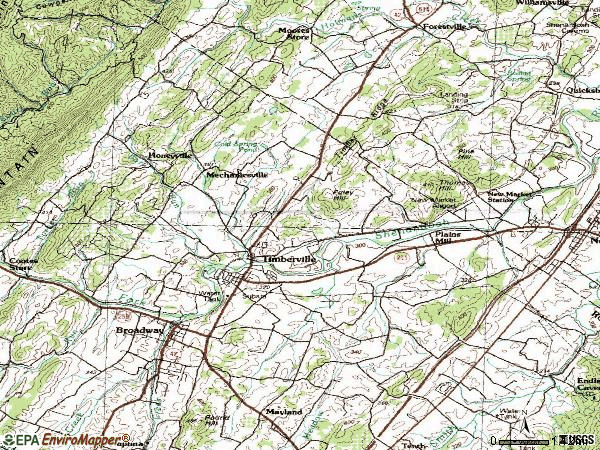
Notable locations in this zip code not listed on our city pages
Notable locations in zip code 22853: Showalters Orchard And Greenhouse (A), Timberville Municipal Building (B), Riverside Gardens (C). Display/hide their locations on the map
Churches in zip code 22853 include: Calvary Church (A), Concord Church (B), Crossroad Church (C), Fairview Church (D), Radar Church (E), Saint Pauls Church (F). Display/hide their locations on the map
In group quarters: 30 (-1 institutionalized population)
Size of family households: 623 2-persons, 317 3-persons, 216 4-persons, 65 5-persons, 69 6-persons
Size of nonfamily households: 347 1-person, 72 2-persons, 17 3-persons
630 married couples with children.
187 single-parent households (71 men, 116 women).
89.6% of residents of 22853 zip code speak English at home.
8.2% of residents speak Spanish at home (65% very well, 11% well, 24% not well).
1.7% of residents speak other Indo-European language at home (81% very well, 19% well).
Foreign born population: 182 (3.6%) (53.0% of them are naturalized citizens)
This zip code:
3.6%
Whole state:
12.7%
43%Costa Rica
27%Honduras
7%Romania
6%Serbia
4%Dominica
3%Bhutan
3%Japan
22%American
17%German
7%Irish
5%English
5%European
4%Italian
3%Russian
Year of entry for the foreign-born population
272010 or later
922000 to 2009
501990 to 1999
24Before 1990
Facilities with environmental interests located in this zip code:
CARGILL TURKEY PRODUCTS INC (480 COOP DRIVE in TIMBERVILLE, VA)
AIR MINOR (AIRS/AFS) STATE MASTER (Virginia pollutants databases) - CEDS-80332, AIR PROGRAM (Integrated Compliance Information System) - ICIS-03-2005-0265, ENFORCEMENT/COMPLIANCE ACTIVITY FORMAL ENFORCEMENT ACTION (Integrated Compliance Information System) - ICIS-03-2005-0265, ENFORCEMENT/COMPLIANCE ACTIVITY TRI REPORTER (Tracking of toxic chemicals releasing facilities) Business SIC classification: MEAT PACKING PLANTS; POULTRY SLAUGHTERING AND PROCESSING Business NAICS classification: ANIMAL (EXCEPT POULTRY) SLAUGHTERING. Alternative names: CARGILL MEAT SOLUTIONS INC, ROCCO/SHADY BROOK FARMS, TIMBERVILLE
BLAKEMORE CONSTRUCTION CORP - TIMBERVILLE (ROUTES 733 & 42 in TIMBERVILLE, VA)
AIR MINOR (AIRS/AFS) STATE MASTER (Virginia pollutants databases) - CEDS-81384, AIR PROGRAM Business SIC classification: ASPHALT PAVING MIXTURES AND BLOCKS Business NAICS classification: ASPHALT PAVING MIXTURE AND BLOCK MANUFACTURING.
C S MUNDY - FLATROCK QUARRY (477 LIMESTONE ROAD in TIMBERVILLE, VA)
AIR SYNTHETIC MINOR (AIRS/AFS) STATE MASTER (Virginia pollutants databases) - CEDS-80676, AIR PROGRAM Business SIC classification: CRUSHED AND BROKEN LIMESTONE; CRUSHED AND BROKEN STONE; LIME Business NAICS classification: OTHER CRUSHED AND BROKEN STONE MINING AND QUARRYING. Alternative names: C S MUNDY QUARRIES, CS MUNDY QUARRIES
CENTRAL AUTO SALES (241 COOP DRIVE in TIMBERVILLE, VA)
AIR MINOR (AIRS/AFS) Business SIC classification: MOTOR VEHICLE DEALERS (NEW AND USED); GENERAL AUTOMOTIVE REPAIR SHOPS; AUTOMOTIVE REPAIR SHOPS
CHERRY GROVE BODY SHOP (15998 LONE PINE DRIVE in TIMBERVILLE, VA)
Conditionally Exempt Small Quantity Generators, less than 100 kg/month of hazardous waste (Resource Conservation and Recovery Act (tracking hazardous waste)) - notification Organizations: ALLEN M FULK (CONTACT/OWNER)
Housing units lacking complete plumbing facilities: 3.6% Housing units lacking complete kitchen facilities: 4.3%
62.0%Electricity
12.1%Fuel oil, kerosene, etc.
10.3%Bottled, tank, or LP gas
8.5%Utility gas
4.4%Wood
2.3%No fuel used
0.5%Other fuel
Population in 1990: 3,494. Population change in the 1990s: +509 (+14.6%).
Place of birth for U.S.-born residents:
This state: 3,789
Northeast: 319
Midwest: 128
South: 456
West: 135
67% of the 22853 zip code residents lived in the same house 5 years ago. Out of people who lived in different houses, 66% lived in this county. Out of people who lived in different counties, 50% lived in Virginia.
91% of the 22853 zip code residents lived in the same house 1 year ago. Out of people who lived in different houses, 54% moved from this county. Out of people who lived in different houses, 39% moved from different county within same state. Out of people who lived in different houses, 4% moved from different state.
Private vs. public school enrollment:
Students in private schools in grades 1 to 8 (elementary and middle school): 27
Here:
9.5%
Virginia:
13.2%
Students in private schools in grades 9 to 12 (high school): 42
Here:
14.2%
Virginia:
10.2%
Students in private undergraduate colleges: 56
Here:
36.6%
Virginia:
18.7%
Occupation by median earnings in the past 12 months ($)
109,333Business and financial operations occupations
92,505Management occupations
64,686Health diagnosing and treating practitioners and other technical occupations
63,462Farming, fishing, and forestry occupations
52,903Fire fighting and prevention, and other protective service workers including supervisors
52,393Law enforcement workers including supervisors
Companies with federal contracts located in this zip code:
PILGRIM'S PRIDE CORPORATION (330 CO OP DR in TIMBERVILLE, VA) : $22,759,559 in 28 contractsfrom 2003 to 2006
Contracts for Meat, Poultry, and Fish, Food Items For Resale, Trash/Garbage Collection Services - Including Portable Sanitation Services by Agricultural Marketing Service, Defense Commissary Agency Signed by year:2000: $0; 2001: $0; 2002: $0; 2003: $238,944; 2004: $18,598,198; 2005: $3,856,114; 2006: $66,303.
Biggest contracts:
$3,722,295 with Agricultural Marketing Service for Meat, Poultry, and Fish. Taking place in NC. Signed on 2004-09-28. Completion date: 2004-11-15.
$3,552,580 with Agricultural Marketing Service for Meat, Poultry, and Fish. Taking place in WV. Signed on 2004-10-15. Completion date: 2004-11-30.
$3,541,855 with Agricultural Marketing Service for Meat, Poultry, and Fish. Taking place in KY. Signed on 2004-08-11. Completion date: 2004-09-30.
$2,703,447 with Agricultural Marketing Service for Meat, Poultry, and Fish. Taking place in WV. Signed on 2004-07-15. Completion date: 2004-08-31.
SIMPLY FRESH LLC (16094 EVERGREEN VALLEY RD in TIMBERVILLE, VA; small business) : $147,233 in 2 contractsfrom 2005 to 2006
$101,014 with Defense Commissary Agency for Non-Food Items For Resale. Signed on 2006-01-01. Completion date: 2006-03-31.
$46,219, same as above.Signed on 2005-10-01. Completion date: 2005-12-31.
Top industries in this zip code by the number of employees in 2005:
Health Care and Social Assistance: Residential Mental Retardation Facilities (100-249 employees: 1 establishment)
Management of Companies and Enterprises: Corporate, Subsidiary, and Regional Managing Offices (50-99: 1, 20-49: 1)
Health Care and Social Assistance: Homes for the Elderly (20-49: 1, 10-19: 2, 5-9: 1)
Finance and Insurance: Commercial Banking (20-49: 1, 5-9: 1)
Wholesale Trade: Fresh Fruit and Vegetable Merchant Wholesalers (20-49: 1)
Accommodation and Food Services: Limited-Service Restaurants (20-49: 1)
People in group quarters in 2010:
9 people in group homes intended for adults
People in group quarters in 2000:
39 people in other noninstitutional group quarters
26 people in agriculture workers' dormitories on farms
15 people in nursing homes
Fatal accident statistics in 2014:
Fatal accident count: 1
Vehicles involved in fatal accidents: 2
Fatal accidents caused by drunken drivers: 0
Fatalities: 1
Persons involved in fatal accidents: 2
Pedestrians involved in fatal accidents: 0
Fatal accident statistics in 2013:
Fatal accident count: 2
Vehicles involved in fatal accidents: 4
Fatal accidents caused by drunken drivers: 2
Fatalities: 2
Persons involved in fatal accidents: 4
Pedestrians involved in fatal accidents: 0
Home Mortgage Disclosure Act Aggregated Statistics For Year 2009 (Based on 4 partial tracts)
A) FHA, FSA/RHS & VA Home Purchase Loans
B) Conventional Home Purchase Loans
C) Refinancings
D) Home Improvement Loans
F) Non-occupant Loans on < 5 Family Dwellings (A B C & D)
G) Loans On Manufactured Home Dwelling (A B C & D)
Number
Average Value
Number
Average Value
Number
Average Value
Number
Average Value
Number
Average Value
Number
Average Value
LOANS ORIGINATED
35
$151,622
56
$144,468
245
$145,459
19
$69,862
23
$108,796
15
$96,531
APPLICATIONS APPROVED, NOT ACCEPTED
0
$0
2
$252,185
17
$111,368
2
$40,450
0
$0
2
$60,675
APPLICATIONS DENIED
6
$152,395
10
$153,983
72
$132,986
3
$16,307
1
$102,550
8
$146,181
APPLICATIONS WITHDRAWN
3
$194,943
5
$109,686
46
$167,563
0
$0
2
$63,805
0
$0
FILES CLOSED FOR INCOMPLETENESS
0
$0
2
$243,070
10
$195,375
0
$0
1
$79,760
0
$0
Aggregated Statistics For Year 2008 (Based on 4 partial tracts)
A) FHA, FSA/RHS & VA Home Purchase Loans
B) Conventional Home Purchase Loans
C) Refinancings
D) Home Improvement Loans
E) Loans on Dwellings For 5+ Families
F) Non-occupant Loans on < 5 Family Dwellings (A B C & D)
G) Loans On Manufactured Home Dwelling (A B C & D)
Number
Average Value
Number
Average Value
Number
Average Value
Number
Average Value
Number
Average Value
Number
Average Value
Number
Average Value
LOANS ORIGINATED
36
$159,124
88
$166,967
155
$147,244
28
$64,237
2
$417,135
27
$145,694
11
$91,875
APPLICATIONS APPROVED, NOT ACCEPTED
0
$0
2
$172,430
14
$104,729
2
$56,590
0
$0
0
$0
1
$2,280
APPLICATIONS DENIED
7
$165,967
8
$124,778
126
$145,980
6
$59,008
0
$0
3
$87,080
19
$98,088
APPLICATIONS WITHDRAWN
2
$95,710
5
$85,530
34
$140,381
2
$14,430
0
$0
0
$0
2
$183,350
FILES CLOSED FOR INCOMPLETENESS
0
$0
2
$84,695
8
$180,056
0
$0
0
$0
0
$0
0
$0
Aggregated Statistics For Year 2007 (Based on 4 partial tracts)
A) FHA, FSA/RHS & VA Home Purchase Loans
B) Conventional Home Purchase Loans
C) Refinancings
D) Home Improvement Loans
F) Non-occupant Loans on < 5 Family Dwellings (A B C & D)
G) Loans On Manufactured Home Dwelling (A B C & D)
Number
Average Value
Number
Average Value
Number
Average Value
Number
Average Value
Number
Average Value
Number
Average Value
LOANS ORIGINATED
11
$147,010
126
$130,143
181
$125,529
39
$50,785
17
$106,635
16
$87,789
APPLICATIONS APPROVED, NOT ACCEPTED
0
$0
16
$158,458
33
$172,190
9
$60,963
5
$224,404
2
$408,710
APPLICATIONS DENIED
3
$90,687
12
$148,123
149
$153,025
20
$57,484
5
$140,304
14
$73,802
APPLICATIONS WITHDRAWN
5
$105,176
9
$125,081
84
$149,460
3
$39,350
2
$87,355
4
$128,208
FILES CLOSED FOR INCOMPLETENESS
2
$116,600
0
$0
12
$161,088
0
$0
3
$145,450
0
$0
Aggregated Statistics For Year 2006 (Based on 4 partial tracts)
A) FHA, FSA/RHS & VA Home Purchase Loans
B) Conventional Home Purchase Loans
C) Refinancings
D) Home Improvement Loans
F) Non-occupant Loans on < 5 Family Dwellings (A B C & D)
G) Loans On Manufactured Home Dwelling (A B C & D)
Number
Average Value
Number
Average Value
Number
Average Value
Number
Average Value
Number
Average Value
Number
Average Value
LOANS ORIGINATED
24
$162,006
168
$125,312
207
$118,711
37
$40,673
30
$119,406
8
$111,699
APPLICATIONS APPROVED, NOT ACCEPTED
0
$0
17
$140,254
22
$95,412
4
$15,192
3
$105,077
0
$0
APPLICATIONS DENIED
2
$187,305
22
$131,954
111
$122,722
12
$70,838
7
$116,950
9
$79,983
APPLICATIONS WITHDRAWN
2
$165,595
22
$111,188
81
$128,662
2
$153,345
7
$100,763
1
$34,180
FILES CLOSED FOR INCOMPLETENESS
0
$0
4
$172,775
12
$98,188
2
$32,025
0
$0
0
$0
Aggregated Statistics For Year 2005 (Based on 4 partial tracts)
A) FHA, FSA/RHS & VA Home Purchase Loans
B) Conventional Home Purchase Loans
C) Refinancings
D) Home Improvement Loans
E) Loans on Dwellings For 5+ Families
F) Non-occupant Loans on < 5 Family Dwellings (A B C & D)
G) Loans On Manufactured Home Dwelling (A B C & D)
Number
Average Value
Number
Average Value
Number
Average Value
Number
Average Value
Number
Average Value
Number
Average Value
Number
Average Value
LOANS ORIGINATED
21
$119,861
173
$116,910
202
$118,634
36
$59,780
2
$263,265
37
$130,802
12
$85,635
APPLICATIONS APPROVED, NOT ACCEPTED
1
$87,350
12
$142,677
23
$104,313
4
$65,968
0
$0
3
$83,700
3
$84,833
APPLICATIONS DENIED
4
$121,845
28
$109,346
148
$111,620
15
$88,224
1
$104,070
12
$87,522
15
$72,799
APPLICATIONS WITHDRAWN
0
$0
18
$123,929
82
$130,377
2
$41,780
0
$0
6
$122,103
4
$73,912
FILES CLOSED FOR INCOMPLETENESS
0
$0
1
$179,270
8
$128,400
0
$0
0
$0
0
$0
0
$0
Aggregated Statistics For Year 2004 (Based on 4 partial tracts)
A) FHA, FSA/RHS & VA Home Purchase Loans
B) Conventional Home Purchase Loans
C) Refinancings
D) Home Improvement Loans
F) Non-occupant Loans on < 5 Family Dwellings (A B C & D)
G) Loans On Manufactured Home Dwelling (A B C & D)
Detailed PMIC statistics for the following Tracts:0108.00
, 0109.00
2002 - 2018 National Fire Incident Reporting System (NFIRS) incidents
Based on the data from the years 2002 - 2018 the average number of fire incidents per year is 20. The highest number of fire incidents - 36 took place in 2007, and the least - 9 in 2018. The data has a dropping trend.
When looking into fire subcategories, the most reports belonged to: Structure Fires (45.2%), and Outside Fires (21.0%).
Fire incident types reported to NFIRS in Zip Code 22853


 Nearest zip codes: 22847, 22844, 22815, 22834, 22842, 22845.


 Based on the data from the years 2002 - 2018 the average number of fire incidents per year is 20. The highest number of fire incidents - 36 took place in 2007, and the least - 9 in 2018. The data has a dropping trend.
 When looking into fire subcategories, the most reports belonged to: Structure Fires (45.2%), and Outside Fires (21.0%).