Estimated median house/condo value in 2022: $610,217
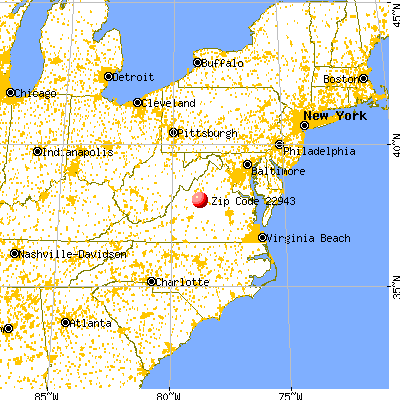
22943:
$610,217
Virginia:
$365,700
Median resident age:
This zip code:
35.0 years
Virginia median age:
39.0 years
Average household size:
This zip code:
2.4 people
Virginia:
2.5 people
Averages for the 2020 tax year for zip code 22943, filed in 2021:
Average Adjusted Gross Income (AGI) in 2020: $158,841 (Individual Income Tax Returns)
Here:
$158,841
State:
$86,446
Salary/wage: $86,852 (reported on 77.8% of returns)
Here:
$86,852
State:
$71,185
(% of AGI for various income ranges: 1032.0% for AGIs below $25k, 3665.0% for AGIs $25k-50k, 7232.5% for AGIs $50k-75k, 12786.7% for AGIs $100k-200k)
Taxable interest for individuals: $9,311 (reported on 33.3% of returns)
This zip code:
$9,311
Virginia:
$1,805
(% of AGI for various income ranges: 62.5% for AGIs $25k-50k, 116.7% for AGIs $100k-200k)
Ordinary dividends: $18,200 (reported on 25.9% of returns)
Here:
$18,200
State:
$8,327
(% of AGI for various income ranges: 397.5% for AGIs $50k-75k)
Net capital gain/loss in AGI: +$45,857 (reported on 25.9% of returns)
Here:
+$45,857
State:
+$24,644
(% of AGI for various income ranges: 620.0% for AGIs $50k-75k)
Profit/loss from business: +$41,980 (reported on 18.5% of returns)
Here:
+$41,980
State:
+$12,836
(% of AGI for various income ranges: 502.0% for AGIs below $25k, 6160.0% for AGIs $100k-200k)
Taxable individual retirement arrangement distribution: $16,850 (reported on 7.4% of returns)
22943:
$16,850
Virginia:
$21,535
(% of AGI for various income ranges: 674.0% for AGIs below $25k)
Total itemized deductions: $85,250 (reported on 14.8% of returns)
Here:
$85,250
State:
$33,287
(% of AGI for various income ranges: )
Charity contributions: $37,733 (reported on 11.1% of returns)
Here:
$37,733
State:
$10,381
(% of AGI for various income ranges: 3773.3% for AGIs $100k-200k)
Taxes paid: $8,400 (reported on 14.8% of returns)
22943:
$8,400
State:
$8,284
(% of AGI for various income ranges: )
Earned income credit: $1,800 (reported on 14.8% of returns)
Here:
$1,800
State:
$2,214
(% of AGI for various income ranges: 144.0% for AGIs below $25k)
Percentage of individuals using paid preparers for their 2020 taxes: 96.3%
Here:
96%
State:
92%
(% for various income ranges: 87.5% for AGIs below $25k, 100.0% for AGIs $25k-50k, 100.0% for AGIs $50k-75k, 100.0% for AGIs $100k-200k, 100.0% for AGIs over 200k)
Averages for the 2012 tax year for zip code 22943, filed in 2013:
Average Adjusted Gross Income (AGI) in 2012: $66,209 (Individual Income Tax Returns)
Here:
$66,209
State:
$71,192
Salary/wage: $55,429 (reported on 75.0% of returns)
Here:
$55,429
State:
$59,229
(% of AGI for various income ranges: 75.5% for AGIs below $25k, 80.2% for AGIs $25k-50k, 68.7% for AGIs $50k-75k, 62.5% for AGIs $75k-100k, 188.5% for AGIs $100k-200k)
Taxable interest for individuals: $1,623 (reported on 40.6% of returns)
This zip code:
$1,623
Virginia:
$1,600
(% of AGI for various income ranges: 0.6% for AGIs below $25k, 0.2% for AGIs $25k-50k, 0.9% for AGIs $50k-75k, 4.6% for AGIs $100k-200k)
Ordinary dividends: $8,400 (reported on 21.9% of returns)
Here:
$8,400
State:
$6,959
(% of AGI for various income ranges: 7.6% for AGIs below $25k, 2.6% for AGIs $50k-75k, 10.9% for AGIs $100k-200k)
Net capital gain/loss in AGI: +$17,640 (reported on 15.6% of returns)
Here:
+$17,640
State:
+$16,672
(% of AGI for various income ranges: 1.2% for AGIs below $25k, 22.6% for AGIs $100k-200k)
Profit/loss from business: +$18,760 (reported on 15.6% of returns)
Here:
+$18,760
State:
+$14,116
Taxable individual retirement arrangement distribution: $3,400 (reported on 6.2% of returns)
22943:
$3,400
Virginia:
$16,667
Total itemized deductions: $35,680 (24% of AGI, reported on 31.2% of returns)
Here:
$35,680
State:
$26,596
Here:
23.9% of AGI
State:
20.1% of AGI
(% of AGI for various income ranges: 27.2% for AGIs below $25k, 17.9% for AGIs $50k-75k, 34.0% for AGIs $75k-100k, 22.7% for AGIs over 200k)
Charity contributions: $15,425 (reported on 25.0% of returns)
Here:
$15,425
State:
$4,443
(% of AGI for various income ranges: 4.2% for AGIs $25k-50k, 4.9% for AGIs $75k-100k, 11.5% for AGIs over 200k)
Taxes paid: $10,400 (reported on 31.2% of returns)
22943:
$10,400
State:
$9,951
(% of AGI for various income ranges: 5.8% for AGIs below $25k, 4.2% for AGIs $50k-75k, 12.5% for AGIs $75k-100k, 6.6% for AGIs over 200k)
Earned income credit: $1,950 (reported on 18.8% of returns)
Here:
$1,950
State:
$2,211
(% of AGI for various income ranges: 8.1% for AGIs below $25k)
Percentage of individuals using paid preparers for their 2012 taxes: 43.8%
Here:
44%
State:
46%
(% for various income ranges: 38.5% for AGIs below $25k, 57.1% for AGIs $25k-50k, 100.0% for AGIs $75k-100k, 100.0% for AGIs over 200k)
Averages for the 2004 tax year for zip code 22943, filed in 2005:
Average Adjusted Gross Income (AGI) in 2004: $59,387 (Individual Income Tax Returns)
Here:
$59,387
State:
$56,704
Salary/wage: $42,654 (reported on 79.8% of returns)
Here:
$42,654
State:
$48,441
(% of AGI for various income ranges: 115.3% for AGIs below $10k, 75.0% for AGIs $10k-25k, 83.0% for AGIs $25k-50k, 72.4% for AGIs $50k-75k, 69.6% for AGIs $75k-100k, 41.5% for AGIs over 100k)
Taxable interest for individuals: $1,938 (reported on 49.2% of returns)
This zip code:
$1,938
Virginia:
$1,688
(% of AGI for various income ranges: 8.0% for AGIs below $10k, 1.1% for AGIs $10k-25k, 1.0% for AGIs $25k-50k, 0.4% for AGIs $50k-75k, 0.8% for AGIs $75k-100k, 2.2% for AGIs over 100k)
Taxable dividends: $9,333 (reported on 28.3% of returns)
Here:
$9,333
State:
$4,028
(% of AGI for various income ranges: 13.3% for AGIs below $10k, 1.8% for AGIs $10k-25k, 4.1% for AGIs $25k-50k, 6.6% for AGIs over 100k)
Net capital gain/loss: +$17,314 (reported on 23.6% of returns)
Here:
+$17,314
State:
+$14,375
Profit/loss from business: +$12,870 (reported on 18.2% of returns)
Here:
+$12,870
State:
+$13,342
(% of AGI for various income ranges: 16.0% for AGIs below $10k, 2.3% for AGIs $10k-25k, 5.9% for AGIs $50k-75k, 5.3% for AGIs over 100k)
Total itemized deductions: $27,152 (23% of AGI, reported on 37.7% of returns)
Here:
$27,152
State:
$21,492
Here:
22.8% of AGI
State:
21.0% of AGI
(% of AGI for various income ranges: 8.0% for AGIs $10k-25k, 11.5% for AGIs $25k-50k, 13.2% for AGIs $50k-75k, 17.3% for AGIs $75k-100k, 21.2% for AGIs over 100k)
Charity contributions deductions: $6,856 (5% of AGI, reported on 30.3% of returns)
Here:
$6,856
State:
$3,794
Here:
5.0% of AGI
State:
3.5% of AGI
(% of AGI for various income ranges: 2.1% for AGIs $25k-50k, 1.2% for AGIs $50k-75k, 2.1% for AGIs $75k-100k, 5.2% for AGIs over 100k)
Total tax: $10,850 (reported on 80.8% of returns)
22943:
$10,850
State:
$9,537
(% of AGI for various income ranges: 4.7% for AGIs below $10k, 5.1% for AGIs $10k-25k, 7.4% for AGIs $25k-50k, 9.9% for AGIs $50k-75k, 11.7% for AGIs $75k-100k, 19.9% for AGIs over 100k)
Earned income credit: $1,808 (reported on 8.8% of returns)
Here:
$1,808
State:
$1,734
Percentage of individuals using paid preparers for their 2004 taxes: 50.5%
Here:
51%
State:
52%
(% for various income ranges: 60.0% for AGIs below $10k, 39.0% for AGIs $10k-25k, 44.9% for AGIs $25k-50k, 74.3% for AGIs $50k-75k, 73.2% for AGIs over 100k)
Household received Food Stamps/SNAP in the past 12 months: 0 Household did not receive Food Stamps/SNAP in the past 12 months: 296
Women who did not have a birth in the past 12 months: 241 (49 now married, 193 unmarried)
Housing units in zip code 22943 with a mortgage: 153 (31 second mortgage, 30 both second mortgage and home equity loan) Median monthly owner costs for units with a mortgage: $1,592 Median monthly owner costs for units without a mortgage: $316
Residents with income below the poverty level in 2022:
This zip code:
1.8%
Whole state:
10.6%
Residents with income below 50% of the poverty level in 2022:
This zip code:
1.8%
Whole state:
5.2%
Median number of rooms in houses and condos:
Here:
6.0
State:
7.0
Median number of rooms in apartments:
Here:
4.8
State:
4.3
Notable locations in this zip code not listed on our city pages
Notable locations in zip code 22943: Brooksville (A), Tiverton (B), Seven Oaks Farm (C), Rosehill (D), Ramsey (E), Piedmont (F), Mirador (G), The Longhouse (H), Casa Maria (I). Display/hide their locations on the map
COASTAL MART INC #884 (RTE 250 WEST in GREENWOOD, VA)
Small Quantity Generators, between 100 kg and 1000 kg of hazardous waste/month (Resource Conservation and Recovery Act (tracking hazardous waste)) - notification Organizations: OPERNAME (CONTACT/OPERATOR)
, L M HUGHEY CO (CONTACT/OWNER)
COCKERILLE ESTATE ABANDONED LAB SITE (STATE RTE. 690 in GREENWOOD, VA)
SUPERFUND (Superfund database) Alternative names: GREENWOOD ABANDONED LAB
COKERVILLE GROUNDWATER (ROUTE 690 in GREENWOOD, VA)
SUPERFUND (Superfund database)
Housing units lacking complete plumbing facilities: 5.5% Housing units lacking complete kitchen facilities: 5.6%
66.0%Electricity
20.6%Wood
9.6%Fuel oil, kerosene, etc.
4.5%Bottled, tank, or LP gas
Population in 1990: 516. Population change in the 1990s: +31 (+6.0%).
Place of birth for U.S.-born residents:
This state: 327
Northeast: 106
Midwest: 91
South: 141
West: 31
46% of the 22943 zip code residents lived in the same house 5 years ago. Out of people who lived in different houses, 65% lived in this county. Out of people who lived in different counties, 50% lived in Virginia.
97% of the 22943 zip code residents lived in the same house 1 year ago. Out of people who lived in different houses, 115% moved from different county within same state.
Private vs. public school enrollment:
Students in private schools in grades 1 to 8 (elementary and middle school):
Here:
0.0%
Virginia:
13.2%
Students in private schools in grades 9 to 12 (high school):
Here:
0.0%
Virginia:
10.2%
Students in private undergraduate colleges: 9
Here:
26.3%
Virginia:
18.7%
Occupation by median earnings in the past 12 months ($)
97,433Management occupations
88,775Office and administrative support occupations
28,716Education, training, and library occupations
Top industries in this zip code by the number of employees in 2005:
Other Services (except Public Administration): Environment, Conservation and Wildlife Organizations (10-19 employees: 1 establishment)
Other Services (except Public Administration): Religious Organizations (5-9: 1, 1-4: 1)
Other Services (except Public Administration): Grantmaking Foundations (5-9: 1)
Other Services (except Public Administration): Professional Organizations (1-4: 1)
Administrative and Support and Waste Management and Remediation Services: Convention and Trade Show Organizers (1-4: 1)
Construction: New Single-Family Housing Construction (except Operative Builders) (1-4: 1)
Administrative and Support and Waste Management and Remediation Services: Janitorial Services (1-4: 1)
Real Estate and Rental and Leasing: Offices of Real Estate Agents and Brokers (1-4: 1)
Accommodation and Food Services: Recreational and Vacation Camps (except Campgrounds) (1-4: 1)
Fatal accident statistics in 2013:
Fatal accident count: 1
Vehicles involved in fatal accidents: 1
Fatal accidents caused by drunken drivers: 1
Fatalities: 1
Persons involved in fatal accidents: 1
Pedestrians involved in fatal accidents: 0
Home Mortgage Disclosure Act Aggregated Statistics For Year 2009 (Based on 2 partial tracts)
A) FHA, FSA/RHS & VA Home Purchase Loans
B) Conventional Home Purchase Loans
C) Refinancings
D) Home Improvement Loans
F) Non-occupant Loans on < 5 Family Dwellings (A B C & D)
Number
Average Value
Number
Average Value
Number
Average Value
Number
Average Value
Number
Average Value
LOANS ORIGINATED
3
$268,280
8
$332,025
33
$270,029
3
$98,213
2
$201,580
APPLICATIONS APPROVED, NOT ACCEPTED
0
$0
1
$341,390
3
$255,557
0
$0
0
$0
APPLICATIONS DENIED
0
$0
1
$577,010
8
$370,674
0
$0
1
$328,900
APPLICATIONS WITHDRAWN
0
$0
1
$273,890
6
$321,090
0
$0
1
$143,250
FILES CLOSED FOR INCOMPLETENESS
0
$0
0
$0
2
$289,765
0
$0
0
$0
Aggregated Statistics For Year 2008 (Based on 2 partial tracts)
A) FHA, FSA/RHS & VA Home Purchase Loans
B) Conventional Home Purchase Loans
C) Refinancings
D) Home Improvement Loans
F) Non-occupant Loans on < 5 Family Dwellings (A B C & D)
Number
Average Value
Number
Average Value
Number
Average Value
Number
Average Value
Number
Average Value
LOANS ORIGINATED
1
$259,570
8
$475,920
16
$297,008
2
$58,045
2
$757,680
APPLICATIONS APPROVED, NOT ACCEPTED
0
$0
2
$252,235
2
$257,450
1
$65,550
0
$0
APPLICATIONS DENIED
0
$0
1
$230,580
8
$247,508
1
$430,090
0
$0
APPLICATIONS WITHDRAWN
0
$0
0
$0
3
$282,717
0
$0
0
$0
FILES CLOSED FOR INCOMPLETENESS
0
$0
0
$0
1
$362,940
0
$0
0
$0
Aggregated Statistics For Year 2007 (Based on 2 partial tracts)
B) Conventional Home Purchase Loans
C) Refinancings
D) Home Improvement Loans
F) Non-occupant Loans on < 5 Family Dwellings (A B C & D)
Number
Average Value
Number
Average Value
Number
Average Value
Number
Average Value
LOANS ORIGINATED
15
$354,404
15
$289,136
3
$65,283
4
$294,980
APPLICATIONS APPROVED, NOT ACCEPTED
1
$237,680
3
$233,630
0
$0
0
$0
APPLICATIONS DENIED
1
$234,240
8
$227,796
3
$74,833
0
$0
APPLICATIONS WITHDRAWN
2
$255,445
5
$213,042
0
$0
0
$0
FILES CLOSED FOR INCOMPLETENESS
0
$0
1
$449,000
0
$0
0
$0
Aggregated Statistics For Year 2006 (Based on 2 partial tracts)
B) Conventional Home Purchase Loans
C) Refinancings
D) Home Improvement Loans
F) Non-occupant Loans on < 5 Family Dwellings (A B C & D)
G) Loans On Manufactured Home Dwelling (A B C & D)
Number
Average Value
Number
Average Value
Number
Average Value
Number
Average Value
Number
Average Value
LOANS ORIGINATED
22
$261,950
18
$218,498
6
$111,353
5
$209,100
1
$62,690
APPLICATIONS APPROVED, NOT ACCEPTED
3
$328,673
2
$180,725
1
$73,230
0
$0
0
$0
APPLICATIONS DENIED
2
$352,565
6
$162,197
2
$62,685
1
$42,290
1
$93,400
APPLICATIONS WITHDRAWN
2
$313,605
6
$203,740
0
$0
0
$0
0
$0
FILES CLOSED FOR INCOMPLETENESS
1
$280,540
1
$104,970
0
$0
0
$0
0
$0
Aggregated Statistics For Year 2005 (Based on 2 partial tracts)
B) Conventional Home Purchase Loans
C) Refinancings
D) Home Improvement Loans
F) Non-occupant Loans on < 5 Family Dwellings (A B C & D)
G) Loans On Manufactured Home Dwelling (A B C & D)
Number
Average Value
Number
Average Value
Number
Average Value
Number
Average Value
Number
Average Value
LOANS ORIGINATED
22
$273,482
21
$225,364
4
$120,072
3
$349,223
1
$72,080
APPLICATIONS APPROVED, NOT ACCEPTED
2
$234,185
4
$172,130
0
$0
1
$187,710
0
$0
APPLICATIONS DENIED
1
$683,130
8
$187,128
2
$62,685
0
$0
0
$0
APPLICATIONS WITHDRAWN
1
$362,370
4
$180,438
1
$191,840
0
$0
0
$0
FILES CLOSED FOR INCOMPLETENESS
1
$272,860
2
$154,080
0
$0
0
$0
0
$0
Aggregated Statistics For Year 2004 (Based on 2 partial tracts)
B) Conventional Home Purchase Loans
C) Refinancings
D) Home Improvement Loans
F) Non-occupant Loans on < 5 Family Dwellings (A B C & D)
G) Loans On Manufactured Home Dwelling (A B C & D)
Number
Average Value
Number
Average Value
Number
Average Value
Number
Average Value
Number
Average Value
LOANS ORIGINATED
18
$263,338
23
$206,564
3
$197,493
4
$255,272
1
$55,700
APPLICATIONS APPROVED, NOT ACCEPTED
2
$232,235
3
$145,503
1
$248,680
0
$0
0
$0
APPLICATIONS DENIED
2
$86,980
6
$128,620
1
$74,380
0
$0
1
$67,960
APPLICATIONS WITHDRAWN
1
$345,400
6
$154,367
0
$0
0
$0
1
$45,500
FILES CLOSED FOR INCOMPLETENESS
1
$221,870
1
$117,690
0
$0
0
$0
0
$0
Aggregated Statistics For Year 2003 (Based on 2 partial tracts)
A) FHA, FSA/RHS & VA Home Purchase Loans
B) Conventional Home Purchase Loans
C) Refinancings
D) Home Improvement Loans
F) Non-occupant Loans on < 5 Family Dwellings (A B C & D)
Number
Average Value
Number
Average Value
Number
Average Value
Number
Average Value
Number
Average Value
LOANS ORIGINATED
1
$94,550
17
$205,404
53
$185,373
3
$30,523
4
$200,178
APPLICATIONS APPROVED, NOT ACCEPTED
0
$0
2
$149,610
4
$117,780
0
$0
0
$0
APPLICATIONS DENIED
0
$0
1
$156,310
7
$174,797
1
$11,000
0
$0
APPLICATIONS WITHDRAWN
0
$0
1
$239,280
8
$169,536
0
$0
0
$0
FILES CLOSED FOR INCOMPLETENESS
0
$0
0
$0
1
$200,090
0
$0
0
$0
Aggregated Statistics For Year 2002 (Based on 2 partial tracts)
A) FHA, FSA/RHS & VA Home Purchase Loans
B) Conventional Home Purchase Loans
C) Refinancings
D) Home Improvement Loans
F) Non-occupant Loans on < 5 Family Dwellings (A B C & D)
Number
Average Value
Number
Average Value
Number
Average Value
Number
Average Value
Number
Average Value
LOANS ORIGINATED
1
$101,650
11
$635,301
30
$179,395
2
$28,135
2
$178,260
APPLICATIONS APPROVED, NOT ACCEPTED
0
$0
2
$92,595
2
$188,745
0
$0
0
$0
APPLICATIONS DENIED
0
$0
2
$107,265
7
$98,457
1
$22,120
1
$84,920
APPLICATIONS WITHDRAWN
0
$0
1
$222,440
5
$121,706
0
$0
0
$0
FILES CLOSED FOR INCOMPLETENESS
0
$0
0
$0
1
$131,450
0
$0
0
$0
Aggregated Statistics For Year 2001 (Based on 2 partial tracts)
A) FHA, FSA/RHS & VA Home Purchase Loans
B) Conventional Home Purchase Loans
C) Refinancings
D) Home Improvement Loans
F) Non-occupant Loans on < 5 Family Dwellings (A B C & D)
Number
Average Value
Number
Average Value
Number
Average Value
Number
Average Value
Number
Average Value
LOANS ORIGINATED
1
$157,000
13
$170,718
23
$163,703
3
$34,417
1
$198,950
APPLICATIONS APPROVED, NOT ACCEPTED
0
$0
2
$97,695
3
$147,490
0
$0
0
$0
APPLICATIONS DENIED
0
$0
1
$48,710
7
$129,613
1
$38,620
0
$0
APPLICATIONS WITHDRAWN
0
$0
1
$150,360
4
$230,175
0
$0
0
$0
FILES CLOSED FOR INCOMPLETENESS
0
$0
0
$0
1
$139,700
0
$0
0
$0
Aggregated Statistics For Year 2000 (Based on 2 partial tracts)
A) FHA, FSA/RHS & VA Home Purchase Loans
B) Conventional Home Purchase Loans
C) Refinancings
D) Home Improvement Loans
F) Non-occupant Loans on < 5 Family Dwellings (A B C & D)
Number
Average Value
Number
Average Value
Number
Average Value
Number
Average Value
Number
Average Value
LOANS ORIGINATED
1
$153,790
14
$165,392
5
$144,052
4
$25,612
1
$274,010
APPLICATIONS APPROVED, NOT ACCEPTED
0
$0
2
$114,255
2
$154,940
1
$12,840
0
$0
APPLICATIONS DENIED
1
$38,620
3
$111,430
6
$91,488
1
$10,660
0
$0
APPLICATIONS WITHDRAWN
0
$0
1
$130,870
2
$82,800
0
$0
0
$0
FILES CLOSED FOR INCOMPLETENESS
0
$0
0
$0
1
$53,060
0
$0
0
$0
Aggregated Statistics For Year 1999 (Based on 1 partial tract)


 Nearest zip codes: 22920, 22980, 22932, 24431, 22931, 22959.


