Estimated zip code population in 2022: 1,878 Zip code population in 2010: 2,106 Zip code population in 2000: 2,592
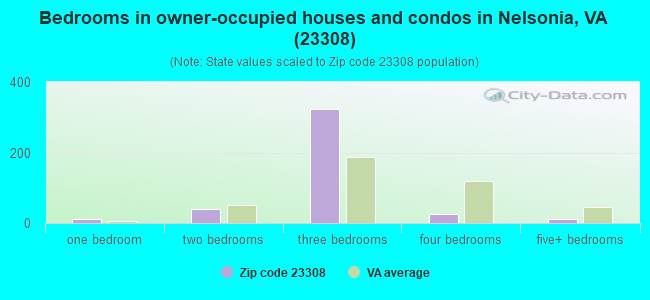
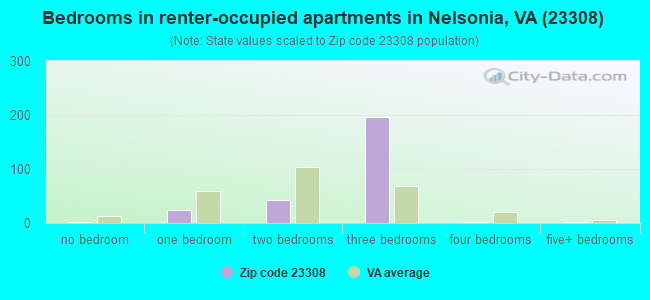
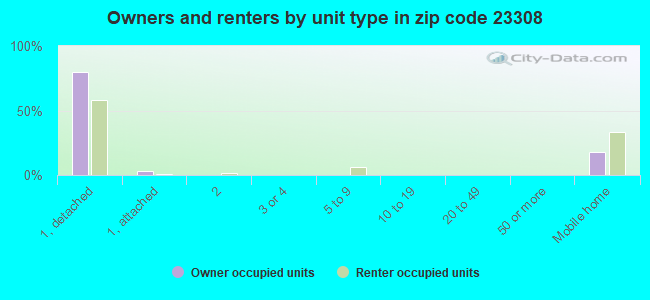
Houses and condos: 844 Renter-occupied apartments: 270
% of renters here:
40%
State:
33%
March 2022 cost of living index in zip code 23308: 83.2 (low, U.S. average is 100)
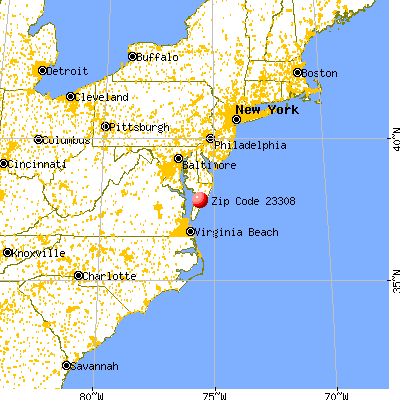
Land area: 33.0 sq. mi. Water area: 22.5 sq. mi.
Population density: 57 people per square mile
(very low).
OSM Map
General Map
Google Map
MSN Map
OSM Map
General Map
Google Map
MSN Map
OSM Map
General Map
Google Map
MSN Map
OSM Map
General Map
Google Map
MSN Map
Please wait while loading the map...
Real estate property taxes paid for housing units in 2022:
This zip code:
0.6% ($720)
Virginia:
0.7% ($2,617)
Median real estate property taxes paid for housing units with mortgages in 2022: $968 (0.4%) Median real estate property taxes paid for housing units with no mortgage in 2022: $584 (0.3%)
Business Search- 14 Million verified businesses
Males: 1,015
(54.0%)
Females: 863
(46.0%)
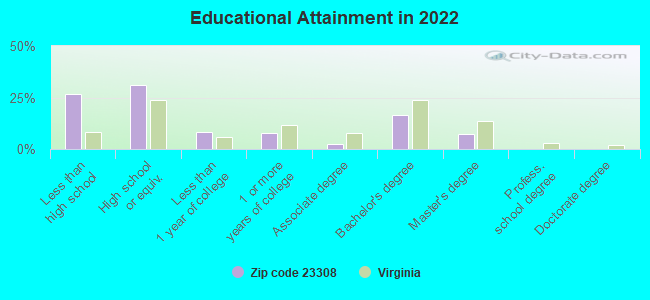
For population 25 years and over in 23308:
High school or higher: 72.3%
Bachelor's degree or higher: 23.3%
Graduate or professional degree: 7.3%
Unemployed: 3.1%
Mean travel time to work (commute): 25.0 minutes
For population 15 years and over in 23308:
Never married: 23.9%
Now married: 51.8%
Separated: 1.0%
Widowed: 10.9%
Divorced: 12.5%
Zip code 23308 compared to state average:
Median house value significantly below state average.
Number of college students significantly below state average.
Percentage of population with a bachelor's degree or higher below state average.
Averages for the 2020 tax year for zip code 23308, filed in 2021:
Average Adjusted Gross Income (AGI) in 2020: $43,242 (Individual Income Tax Returns)
Here:
$43,242
State:
$86,446
Salary/wage: $37,491 (reported on 84.2% of returns)
Here:
$37,491
State:
$71,185
(% of AGI for various income ranges: 1330.9% for AGIs below $25k, 3874.4% for AGIs $25k-50k, 6416.2% for AGIs $50k-75k, 8570.0% for AGIs $75k-100k, 20850.0% for AGIs $100k-200k)
Taxable interest for individuals: $418 (reported on 14.5% of returns)
This zip code:
$418
Virginia:
$1,805
(% of AGI for various income ranges: 8.7% for AGIs below $25k, 2.8% for AGIs $25k-50k, 10.0% for AGIs $50k-75k, 43.3% for AGIs $100k-200k)
Ordinary dividends: $2,114 (reported on 9.2% of returns)
Here:
$2,114
State:
$8,327
(% of AGI for various income ranges: 18.7% for AGIs below $25k, 47.5% for AGIs $50k-75k, 223.3% for AGIs $100k-200k)
Net capital gain/loss in AGI: +$1,129 (reported on 9.2% of returns)
Here:
+$1,129
State:
+$24,644
(% of AGI for various income ranges: 18.9% for AGIs $25k-50k, 150.0% for AGIs $75k-100k)
Profit/loss from business: +$4,167 (reported on 15.8% of returns)
Here:
+$4,167
State:
+$12,836
(% of AGI for various income ranges: 159.1% for AGIs below $25k, 10.6% for AGIs $25k-50k, 143.8% for AGIs $50k-75k)
Taxable individual retirement arrangement distribution: $10,500 (reported on 5.3% of returns)
23308:
$10,500
Virginia:
$21,535
(% of AGI for various income ranges: 233.3% for AGIs $25k-50k)
Total itemized deductions: $25,000 (reported on 3.9% of returns)
Here:
$25,000
State:
$33,287
(% of AGI for various income ranges: 937.5% for AGIs $50k-75k)
Charity contributions: $4,333 (reported on 3.9% of returns)
Here:
$4,333
State:
$10,381
(% of AGI for various income ranges: 72.2% for AGIs $25k-50k)
Taxes paid: $6,367 (reported on 3.9% of returns)
23308:
$6,367
State:
$8,284
(% of AGI for various income ranges: 238.8% for AGIs $50k-75k)
Earned income credit: $2,444 (reported on 23.7% of returns)
Here:
$2,444
State:
$2,214
(% of AGI for various income ranges: 130.9% for AGIs below $25k, 77.2% for AGIs $25k-50k)
Percentage of individuals using paid preparers for their 2020 taxes: 93.4%
Here:
93%
State:
92%
(% for various income ranges: 93.5% for AGIs below $25k, 95.7% for AGIs $25k-50k, 90.9% for AGIs $50k-75k, 80.0% for AGIs $75k-100k, 100.0% for AGIs $100k-200k)
Averages for the 2012 tax year for zip code 23308, filed in 2013:
Average Adjusted Gross Income (AGI) in 2012: $35,490 (Individual Income Tax Returns)
Here:
$35,490
State:
$71,192
Salary/wage: $32,337 (reported on 85.5% of returns)
Here:
$32,337
State:
$59,229
(% of AGI for various income ranges: 79.7% for AGIs below $25k, 82.2% for AGIs $25k-50k, 74.4% for AGIs $50k-75k, 76.3% for AGIs $75k-100k, 75.4% for AGIs $100k-200k)
Taxable interest for individuals: $650 (reported on 17.4% of returns)
This zip code:
$650
Virginia:
$1,600
(% of AGI for various income ranges: 0.4% for AGIs below $25k, 0.2% for AGIs $25k-50k, 0.2% for AGIs $50k-75k, 1.1% for AGIs $75k-100k)
Ordinary dividends: $1,357 (reported on 10.1% of returns)
Here:
$1,357
State:
$6,959
Profit/loss from business: +$5,733 (reported on 13.0% of returns)
Here:
+$5,733
State:
+$14,116
(% of AGI for various income ranges: 11.7% for AGIs below $25k)
Taxable individual retirement arrangement distribution: $8,420 (reported on 7.2% of returns)
23308:
$8,420
Virginia:
$16,667
Total itemized deductions: $15,983 (28% of AGI, reported on 17.4% of returns)
Here:
$15,983
State:
$26,596
Here:
28.0% of AGI
State:
20.1% of AGI
(% of AGI for various income ranges: 12.0% for AGIs $25k-50k, 7.6% for AGIs $50k-75k, 19.9% for AGIs $75k-100k)
Charity contributions: $2,580 (reported on 14.5% of returns)
Here:
$2,580
State:
$4,443
(% of AGI for various income ranges: 1.7% for AGIs $25k-50k, 0.9% for AGIs $50k-75k, 2.7% for AGIs $75k-100k)
Taxes paid: $3,958 (reported on 17.4% of returns)
23308:
$3,958
State:
$9,951
(% of AGI for various income ranges: 1.9% for AGIs $25k-50k, 2.1% for AGIs $50k-75k, 6.7% for AGIs $75k-100k)
Earned income credit: $2,622 (reported on 26.1% of returns)
Here:
$2,622
State:
$2,211
(% of AGI for various income ranges: 8.8% for AGIs below $25k, 1.2% for AGIs $25k-50k)
Percentage of individuals using paid preparers for their 2012 taxes: 53.6%
Here:
54%
State:
46%
(% for various income ranges: 50.0% for AGIs below $25k, 60.0% for AGIs $25k-50k, 50.0% for AGIs $50k-75k, 100.0% for AGIs $75k-100k)
Averages for the 2004 tax year for zip code 23308, filed in 2005:
Average Adjusted Gross Income (AGI) in 2004: $28,340 (Individual Income Tax Returns)
Here:
$28,340
State:
$56,704
Salary/wage: $26,228 (reported on 82.8% of returns)
Here:
$26,228
State:
$48,441
(% of AGI for various income ranges: 95.9% for AGIs below $10k, 78.3% for AGIs $10k-25k, 80.6% for AGIs $25k-50k, 83.8% for AGIs $50k-75k, 62.7% for AGIs $75k-100k, 52.8% for AGIs over 100k)
Taxable interest for individuals: $1,298 (reported on 30.4% of returns)
This zip code:
$1,298
Virginia:
$1,688
(% of AGI for various income ranges: 2.2% for AGIs below $10k, 2.3% for AGIs $10k-25k, 1.5% for AGIs $25k-50k, 0.5% for AGIs $50k-75k, 1.1% for AGIs $75k-100k, 0.6% for AGIs over 100k)
Taxable dividends: $1,044 (reported on 13.8% of returns)
Here:
$1,044
State:
$4,028
(% of AGI for various income ranges: 0.8% for AGIs $10k-25k, 0.3% for AGIs $25k-50k, 0.7% for AGIs $50k-75k, 0.5% for AGIs $75k-100k)
Net capital gain/loss: +$3,343 (reported on 10.7% of returns)
Here:
+$3,343
State:
+$14,375
(% of AGI for various income ranges: 0.3% for AGIs $10k-25k, -0.0% for AGIs $25k-50k, -0.0% for AGIs $50k-75k, 12.0% for AGIs $75k-100k)
Profit/loss from business: +$2,106 (reported on 13.0% of returns)
Here:
+$2,106
State:
+$13,342
(% of AGI for various income ranges: -3.3% for AGIs below $10k, 5.0% for AGIs $10k-25k, -0.4% for AGIs $25k-50k, 0.3% for AGIs $50k-75k)
IRA payment deduction: $2,000 (reported on 1.8% of returns)
23308:
$2,000
Virginia:
$2,943
Total itemized deductions: $14,608 (29% of AGI, reported on 14.9% of returns)
Here:
$14,608
State:
$21,492
Here:
29.5% of AGI
State:
21.0% of AGI
(% of AGI for various income ranges: 7.7% for AGIs $10k-25k, 9.3% for AGIs $25k-50k, 5.1% for AGIs $50k-75k, 17.7% for AGIs $75k-100k)
Charity contributions deductions: $2,338 (5% of AGI, reported on 12.3% of returns)
Here:
$2,338
State:
$3,794
Here:
4.7% of AGI
State:
3.5% of AGI
(% of AGI for various income ranges: 1.1% for AGIs $10k-25k, 1.2% for AGIs $25k-50k, 0.7% for AGIs $50k-75k, 1.9% for AGIs $75k-100k)
Total tax: $3,206 (reported on 67.6% of returns)
23308:
$3,206
State:
$9,537
(% of AGI for various income ranges: 5.4% for AGIs below $10k, 3.4% for AGIs $10k-25k, 6.3% for AGIs $25k-50k, 9.6% for AGIs $50k-75k, 11.4% for AGIs $75k-100k, 15.1% for AGIs over 100k)
Earned income credit: $1,985 (reported on 30.2% of returns)
Here:
$1,985
State:
$1,734
Percentage of individuals using paid preparers for their 2004 taxes: 56.6%
Here:
57%
State:
52%
(% for various income ranges: 53.3% for AGIs below $10k, 59.5% for AGIs $10k-25k, 52.4% for AGIs $25k-50k, 63.5% for AGIs $50k-75k, 90.9% for AGIs $75k-100k)
Household received Food Stamps/SNAP in the past 12 months: 124 Household did not receive Food Stamps/SNAP in the past 12 months: 566
Women who had a birth in the past 12 months: 30 (18 now married, 11 unmarried) Women who did not have a birth in the past 12 months: 247 (111 now married, 135 unmarried)
Housing units in zip code 23308 with a mortgage: 192 (24 second mortgage, 27 home equity loan, 3 both second mortgage and home equity loan) Houses without a mortgage: 3
Median monthly owner costs for units with a mortgage: $1,107 Median monthly owner costs for units without a mortgage: $369
Residents with income below the poverty level in 2022:
This zip code:
10.2%
Whole state:
10.6%
Residents with income below 50% of the poverty level in 2022:
This zip code:
0.9%
Whole state:
5.2%
Median number of rooms in houses and condos:
Here:
6.3
State:
7.0
Median number of rooms in apartments:
Here:
4.6
State:
4.3
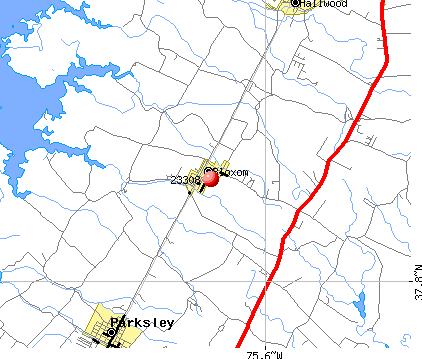
Notable locations in this zip code not listed on our city pages
Streams, rivers, and creeks: Young Creek (A), Muddy Creek (B), Mill Branch (C), Messongo Creek (D), Little Back Creek (E), Katy Young Branch (F), Guilford Creek (G), Guilford Church Branch (H), France Creek (I). Display/hide their locations on the map
In group quarters: 6 (-1 institutionalized population)
Size of family households: 216 2-persons, 109 3-persons, 83 4-persons, 61 5-persons, 40 6-persons, 8 7-or-more-persons
Size of nonfamily households: 160 1-person
323 married couples with children.
177 single-parent households (95 men, 82 women).
81.2% of residents of 23308 zip code speak English at home.
9.6% of residents speak Spanish at home (35% very well, 16% well, 35% not well, 13% not at all).
8.3% of residents speak other Indo-European language at home (45% very well, 3% well, 30% not well, 22% not at all).
0.1% of residents speak other language at home (100% very well).
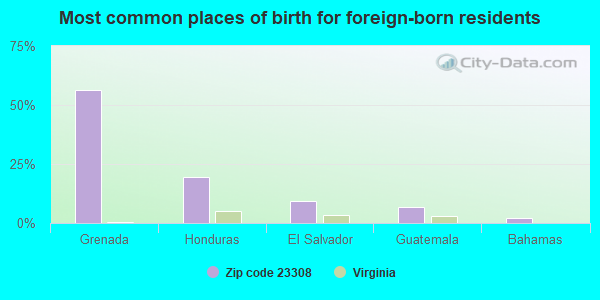
Foreign born population: 267 (14.3%) (25.0% of them are naturalized citizens)
This zip code:
14.3%
Whole state:
12.7%
56%Grenada
19%Honduras
9%El Salvador
7%Guatemala
2%Bahamas
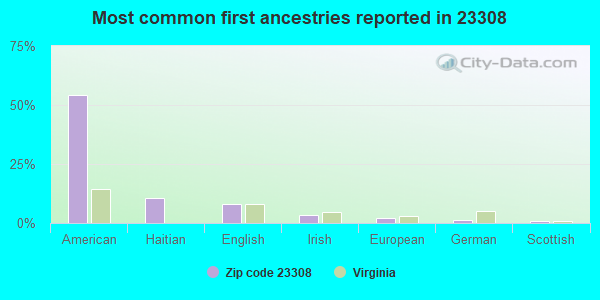
54%American
11%Haitian
8%English
3%Irish
2%European
1%German
1%Scottish
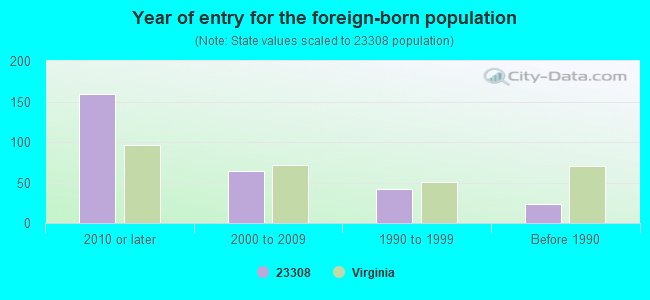
Year of entry for the foreign-born population
1592010 or later
642000 to 2009
421990 to 1999
24Before 1990
Facilities with environmental interests located in this zip code:
BLOXOM MINI MART (2564 SHOREMANE DRIVE in BLOXOM, VA)
(Integrated Compliance Information System) - ICIS-03-2002-0198, FORMAL ENFORCEMENT ACTION Business SIC classification: MOTOR VEHICLE SUPPLIES AND NEW PARTS; PETROLEUM AND PETROLEUM PRODUCTS WHOLESALERS, EXCEPT BULK STATIONS AND TERMINALS; GROCERY STORES; AUTO AND HOME SUPPLY STORES; GASOLINE SERVICE STATIONS Alternative names: BLOXON MINI MART
Housing units lacking complete plumbing facilities: 3.8% Housing units lacking complete kitchen facilities: 5.8%
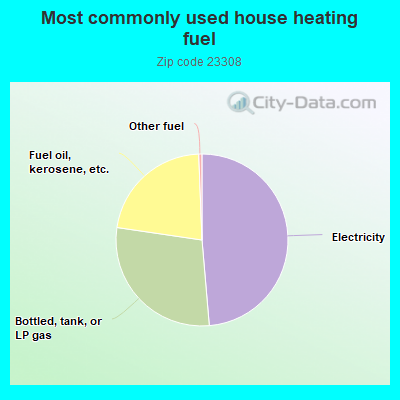
48.7%Electricity
28.7%Bottled, tank, or LP gas
22.1%Fuel oil, kerosene, etc.
0.6%Other fuel
Population in 1990: 1,581. Population change in the 1990s: +1,011 (+63.9%).
Place of birth for U.S.-born residents:
This state: 871
Northeast: 326
Midwest: 54
South: 329
West: 14
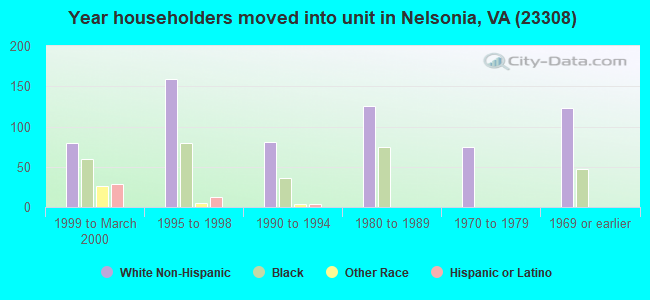
63% of the 23308 zip code residents lived in the same house 5 years ago. Out of people who lived in different houses, 70% lived in this county. Out of people who lived in different counties, 50% lived in Virginia.
92% of the 23308 zip code residents lived in the same house 1 year ago. Out of people who lived in different houses, 42% moved from this county. Out of people who lived in different houses, 34% moved from different county within same state. Out of people who lived in different houses, 11% moved from different state. Out of people who lived in different houses, 12% moved from abroad.
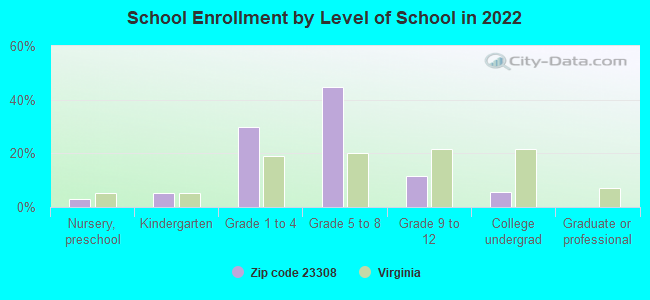
Private vs. public school enrollment:
Students in private schools in grades 1 to 8 (elementary and middle school): 2
Here:
0.6%
Virginia:
13.2%
Students in private schools in grades 9 to 12 (high school): 2
Here:
5.2%
Virginia:
10.2%
Students in private undergraduate colleges: 8
Here:
31.2%
Virginia:
18.7%
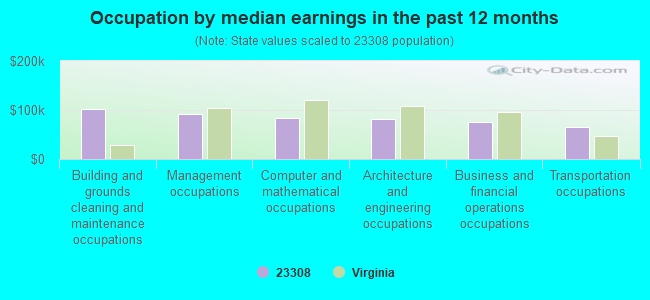
Occupation by median earnings in the past 12 months ($)
102,600Building and grounds cleaning and maintenance occupations
91,333Management occupations
84,075Computer and mathematical occupations
82,624Architecture and engineering occupations
76,353Business and financial operations occupations
65,879Transportation occupations
Top industries in this zip code by the number of employees in 2005:
Construction: Plumbing, Heating, and Air-Conditioning Contractors (1-4 employees: 1 establishment)
Construction: New Single-Family Housing Construction (except Operative Builders) (1-4: 1)
Other Services (except Public Administration): General Automotive Repair (1-4: 1)
Construction: Residential Remodelers (1-4: 1)
Wholesale Trade: Motor Vehicle Supplies and New Parts Merchant Wholesalers (1-4: 1)
Construction: Painting and Wall Covering Contractors (1-4: 1)
People in group quarters in 2000:
72 people in agriculture workers' dormitories on farms
Fatal accident statistics in 2012:
Fatal accident count: 1
Vehicles involved in fatal accidents: 1
Fatal accidents caused by drunken drivers: 0
Fatalities: 1
Persons involved in fatal accidents: 2
Pedestrians involved in fatal accidents: 0
Fatal accident statistics in 2011:
Fatal accident count: 1
Vehicles involved in fatal accidents: 1
Fatal accidents caused by drunken drivers: 1
Fatalities: 1
Persons involved in fatal accidents: 1
Pedestrians involved in fatal accidents: 0
2002 - 2018 National Fire Incident Reporting System (NFIRS) incidents
According to the data from the years 2002 - 2018 the average number of fire incidents per year is 35. The highest number of fire incidents - 66 took place in 2015, and the least - 18 in 2005. The data has a declining trend.
When looking into fire subcategories, the most incidents belonged to: Structure Fires (60.6%), and Outside Fires (28.2%).
Fire incident types reported to NFIRS in Zip Code 23308


 Nearest zip codes: 23409, 23407, 23414, 23359, 23421, 23357.


 According to the data from the years 2002 - 2018 the average number of fire incidents per year is 35. The highest number of fire incidents - 66 took place in 2015, and the least - 18 in 2005. The data has a declining trend.
 When looking into fire subcategories, the most incidents belonged to: Structure Fires (60.6%), and Outside Fires (28.2%).