Estimated zip code population in 2022: 4,802 Zip code population in 2010: 3,032 Zip code population in 2000: 2,577
Houses and condos: 1,594 Renter-occupied apartments: 371
% of renters here:
24%
State:
33%
March 2022 cost of living index in zip code 23690: 95.9 (near average, U.S. average is 100)
Land area: 7.6 sq. mi. Water area: 1.9 sq. mi.
Population density: 633 people per square mile
(low).
OSM Map
General Map
Google Map
MSN Map
OSM Map
General Map
Google Map
MSN Map
OSM Map
General Map
Google Map
MSN Map
OSM Map
General Map
Google Map
MSN Map
Please wait while loading the map...
Real estate property taxes paid for housing units in 2022:
This zip code:
0.7% ($2,434)
Virginia:
0.7% ($2,617)
Median real estate property taxes paid for housing units with mortgages in 2022: $2,514 (0.7%) Median real estate property taxes paid for housing units with no mortgage in 2022: $2,295 (0.6%)
Estimated median house/condo value in 2022: $367,099
23690:
$367,099
Virginia:
$365,700
According to our research of Virginia and other state lists, there were 7 registered sex offenders living in 23690 zip code as of May 28, 2024. The ratio of all residents to sex offenders in zip code 23690 is 529 to 1. The ratio of registered sex offenders to all residents in this zip code is lower than the state average.
Median resident age:
This zip code:
31.6 years
Virginia median age:
39.0 years
Average household size:
This zip code:
2.7 people
Virginia:
2.5 people
Averages for the 2020 tax year for zip code 23690, filed in 2021:
Average Adjusted Gross Income (AGI) in 2020: $61,294 (Individual Income Tax Returns)
Here:
$61,294
State:
$86,446
Salary/wage: $50,290 (reported on 84.0% of returns)
Here:
$50,290
State:
$71,185
(% of AGI for various income ranges: 1190.9% for AGIs below $25k, 3387.2% for AGIs $25k-50k, 6190.0% for AGIs $50k-75k, 8515.0% for AGIs $75k-100k, 15152.9% for AGIs $100k-200k)
Taxable interest for individuals: $1,418 (reported on 27.2% of returns)
This zip code:
$1,418
Virginia:
$1,805
(% of AGI for various income ranges: 5.5% for AGIs below $25k, 16.9% for AGIs $25k-50k, 34.0% for AGIs $50k-75k, 47.5% for AGIs $75k-100k, 233.5% for AGIs $100k-200k)
Ordinary dividends: $4,633 (reported on 16.7% of returns)
Here:
$4,633
State:
$8,327
(% of AGI for various income ranges: 6.8% for AGIs below $25k, 38.1% for AGIs $25k-50k, 97.3% for AGIs $50k-75k, 90.0% for AGIs $75k-100k, 350.6% for AGIs $100k-200k)
Net capital gain/loss in AGI: +$6,742 (reported on 14.8% of returns)
Here:
+$6,742
State:
+$24,644
(% of AGI for various income ranges: 3.8% for AGIs $25k-50k, 40.0% for AGIs $50k-75k, 130.0% for AGIs $75k-100k, 369.4% for AGIs $100k-200k)
Profit/loss from business: +$5,218 (reported on 10.5% of returns)
Here:
+$5,218
State:
+$12,836
(% of AGI for various income ranges: 49.4% for AGIs below $25k, 6.6% for AGIs $25k-50k, 73.3% for AGIs $50k-75k, 308.2% for AGIs $100k-200k)
Taxable individual retirement arrangement distribution: $18,285 (reported on 8.0% of returns)
23690:
$18,285
Virginia:
$21,535
(% of AGI for various income ranges: 54.3% for AGIs below $25k, 490.0% for AGIs $50k-75k, 815.9% for AGIs $100k-200k)
Total itemized deductions: $29,029 (reported on 10.5% of returns)
Here:
$29,029
State:
$33,287
(% of AGI for various income ranges: 732.7% for AGIs $50k-75k, 680.0% for AGIs $75k-100k, 1358.2% for AGIs $100k-200k)
Charity contributions: $8,400 (reported on 9.3% of returns)
Here:
$8,400
State:
$10,381
(% of AGI for various income ranges: 166.7% for AGIs $50k-75k, 105.0% for AGIs $75k-100k, 520.0% for AGIs $100k-200k)
Taxes paid: $7,488 (reported on 9.9% of returns)
23690:
$7,488
State:
$8,284
(% of AGI for various income ranges: 133.3% for AGIs $50k-75k, 177.5% for AGIs $75k-100k, 345.9% for AGIs $100k-200k)
Earned income credit: $2,519 (reported on 22.2% of returns)
Here:
$2,519
State:
$2,214
(% of AGI for various income ranges: 131.5% for AGIs below $25k, 90.3% for AGIs $25k-50k)
Percentage of individuals using paid preparers for their 2020 taxes: 92.6%
Here:
93%
State:
92%
(% for various income ranges: 91.2% for AGIs below $25k, 91.9% for AGIs $25k-50k, 95.0% for AGIs $50k-75k, 93.8% for AGIs $75k-100k, 92.9% for AGIs $100k-200k, 100.0% for AGIs over 200k)
Averages for the 2012 tax year for zip code 23690, filed in 2013:
Average Adjusted Gross Income (AGI) in 2012: $46,350 (Individual Income Tax Returns)
Here:
$46,350
State:
$71,192
Salary/wage: $40,319 (reported on 88.3% of returns)
Here:
$40,319
State:
$59,229
(% of AGI for various income ranges: 84.7% for AGIs below $25k, 84.1% for AGIs $25k-50k, 78.8% for AGIs $50k-75k, 71.1% for AGIs $75k-100k, 72.1% for AGIs $100k-200k)
Taxable interest for individuals: $779 (reported on 29.7% of returns)
This zip code:
$779
Virginia:
$1,600
(% of AGI for various income ranges: 0.3% for AGIs below $25k, 0.4% for AGIs $25k-50k, 0.5% for AGIs $50k-75k, 0.7% for AGIs $75k-100k, 0.5% for AGIs $100k-200k)
Ordinary dividends: $2,585 (reported on 17.9% of returns)
Here:
$2,585
State:
$6,959
(% of AGI for various income ranges: 1.1% for AGIs below $25k, 0.3% for AGIs $25k-50k, 0.8% for AGIs $50k-75k, 1.2% for AGIs $75k-100k, 1.4% for AGIs $100k-200k)
Net capital gain/loss in AGI: +$800 (reported on 11.7% of returns)
Here:
+$800
State:
+$16,672
(% of AGI for various income ranges: 0.3% for AGIs $75k-100k, 0.5% for AGIs $100k-200k)
Profit/loss from business: +$3,562 (reported on 9.0% of returns)
Here:
+$3,562
State:
+$14,116
(% of AGI for various income ranges: 2.7% for AGIs below $25k, 0.8% for AGIs $25k-50k, 1.2% for AGIs $75k-100k)
Taxable individual retirement arrangement distribution: $12,923 (reported on 9.0% of returns)
23690:
$12,923
Virginia:
$16,667
(% of AGI for various income ranges: 0.9% for AGIs below $25k, 1.9% for AGIs $25k-50k, 3.5% for AGIs $50k-75k, 3.8% for AGIs $75k-100k, 2.1% for AGIs $100k-200k)
Total itemized deductions: $20,216 (24% of AGI, reported on 33.8% of returns)
Here:
$20,216
State:
$26,596
Here:
23.9% of AGI
State:
20.1% of AGI
(% of AGI for various income ranges: 7.8% for AGIs below $25k, 12.8% for AGIs $25k-50k, 16.9% for AGIs $50k-75k, 17.3% for AGIs $75k-100k, 15.4% for AGIs $100k-200k)
Charity contributions: $3,488 (reported on 29.0% of returns)
Here:
$3,488
State:
$4,443
(% of AGI for various income ranges: 1.1% for AGIs below $25k, 1.7% for AGIs $25k-50k, 2.5% for AGIs $50k-75k, 2.6% for AGIs $75k-100k, 2.4% for AGIs $100k-200k)
Taxes paid: $5,776 (reported on 33.8% of returns)
23690:
$5,776
State:
$9,951
(% of AGI for various income ranges: 1.1% for AGIs below $25k, 2.2% for AGIs $25k-50k, 4.2% for AGIs $50k-75k, 4.9% for AGIs $75k-100k, 6.0% for AGIs $100k-200k)
Earned income credit: $2,356 (reported on 26.9% of returns)
Here:
$2,356
State:
$2,211
(% of AGI for various income ranges: 9.3% for AGIs below $25k, 1.5% for AGIs $25k-50k)
Percentage of individuals using paid preparers for their 2012 taxes: 35.2%
Here:
35%
State:
46%
(% for various income ranges: 31.7% for AGIs below $25k, 35.5% for AGIs $25k-50k, 36.4% for AGIs $50k-75k, 42.9% for AGIs $75k-100k, 40.0% for AGIs $100k-200k)
Averages for the 2004 tax year for zip code 23690, filed in 2005:
Average Adjusted Gross Income (AGI) in 2004: $34,725 (Individual Income Tax Returns)
Here:
$34,725
State:
$56,704
Salary/wage: $31,095 (reported on 90.3% of returns)
Here:
$31,095
State:
$48,441
(% of AGI for various income ranges: 93.8% for AGIs below $10k, 90.6% for AGIs $10k-25k, 87.0% for AGIs $25k-50k, 79.8% for AGIs $50k-75k, 75.6% for AGIs $75k-100k, 69.6% for AGIs over 100k)
Taxable interest for individuals: $708 (reported on 28.9% of returns)
This zip code:
$708
Virginia:
$1,688
(% of AGI for various income ranges: 0.7% for AGIs below $10k, 0.1% for AGIs $10k-25k, 0.9% for AGIs $25k-50k, 0.9% for AGIs $50k-75k, 0.6% for AGIs $75k-100k, 0.3% for AGIs over 100k)
Taxable dividends: $2,827 (reported on 15.2% of returns)
Here:
$2,827
State:
$4,028
(% of AGI for various income ranges: 0.6% for AGIs below $10k, 0.1% for AGIs $10k-25k, 1.2% for AGIs $25k-50k, 1.5% for AGIs $50k-75k, 0.7% for AGIs $75k-100k, 2.5% for AGIs over 100k)
Net capital gain/loss: +$2,474 (reported on 10.9% of returns)
Here:
+$2,474
State:
+$14,375
(% of AGI for various income ranges: -1.0% for AGIs below $10k, -0.1% for AGIs $10k-25k, -0.2% for AGIs $25k-50k, 0.6% for AGIs $50k-75k, -0.2% for AGIs $75k-100k, 3.7% for AGIs over 100k)
Profit/loss from business: +$5,592 (reported on 7.1% of returns)
Here:
+$5,592
State:
+$13,342
(% of AGI for various income ranges: 0.7% for AGIs below $10k, 2.3% for AGIs $10k-25k, 1.4% for AGIs $25k-50k, 0.5% for AGIs $50k-75k, 2.0% for AGIs $75k-100k)
Total itemized deductions: $17,816 (24% of AGI, reported on 25.5% of returns)
Here:
$17,816
State:
$21,492
Here:
23.9% of AGI
State:
21.0% of AGI
(% of AGI for various income ranges: 2.3% for AGIs $10k-25k, 12.0% for AGIs $25k-50k, 17.1% for AGIs $50k-75k, 17.7% for AGIs $75k-100k, 17.7% for AGIs over 100k)
Charity contributions deductions: $3,135 (4% of AGI, reported on 23.0% of returns)
Here:
$3,135
State:
$3,794
Here:
4.1% of AGI
State:
3.5% of AGI
(% of AGI for various income ranges: 0.5% for AGIs $10k-25k, 1.7% for AGIs $25k-50k, 2.7% for AGIs $50k-75k, 3.3% for AGIs $75k-100k, 2.5% for AGIs over 100k)
Total tax: $4,503 (reported on 64.6% of returns)
23690:
$4,503
State:
$9,537
(% of AGI for various income ranges: 1.7% for AGIs below $10k, 3.2% for AGIs $10k-25k, 5.5% for AGIs $25k-50k, 8.4% for AGIs $50k-75k, 9.6% for AGIs $75k-100k, 15.6% for AGIs over 100k)
Earned income credit: $2,022 (reported on 30.2% of returns)
Here:
$2,022
State:
$1,734
Percentage of individuals using paid preparers for their 2004 taxes: 58.6%
Here:
59%
State:
52%
(% for various income ranges: 55.3% for AGIs below $10k, 66.6% for AGIs $10k-25k, 55.8% for AGIs $25k-50k, 50.0% for AGIs $50k-75k, 47.1% for AGIs $75k-100k, 60.8% for AGIs over 100k)
Household received Food Stamps/SNAP in the past 12 months: 160 Household did not receive Food Stamps/SNAP in the past 12 months: 1,381
Women who had a birth in the past 12 months: 91 (84 now married, 8 unmarried) Women who did not have a birth in the past 12 months: 1,023 (490 now married, 530 unmarried)
Housing units in zip code 23690 with a mortgage: 837 (18 second mortgage, 18 both second mortgage and home equity loan) Median monthly owner costs for units with a mortgage: $1,979 Median monthly owner costs for units without a mortgage: $596
Residents with income below the poverty level in 2022:
This zip code:
13.8%
Whole state:
10.6%
Residents with income below 50% of the poverty level in 2022:
This zip code:
9.8%
Whole state:
5.2%
Median number of rooms in houses and condos:
Here:
6.9
State:
7.0
Median number of rooms in apartments:
Here:
3.9
State:
4.3
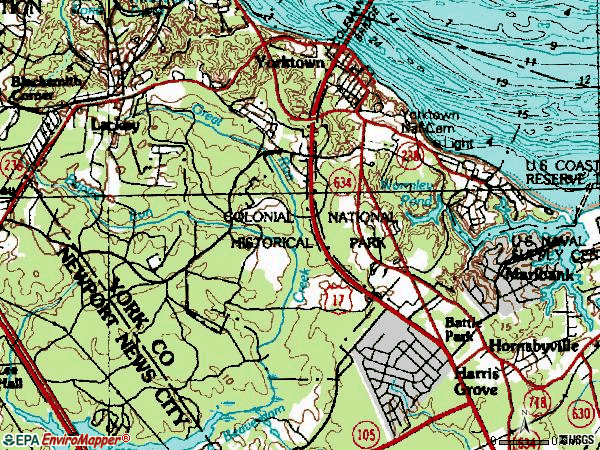
Notable locations in this zip code not listed on our city pages
Notable locations in zip code 23690: Surrender Ground (A), Yorktown Visitors Center (B), Watermen's Museum (C), York County Courts And Office Center (D), On-The-Hill Cultural Arts Center (E), York County Administration Building (F), York County Public Safety Building (G), York County Courthouse (H), Moore House (I), Yorktown Naval Weapons Station Fire Department (J), York County Finance Building (K), York County Department of Fire and Life Safety Station 4 Yorktown (L). Display/hide their locations on the map
Churches in zip code 23690 include: Rising Sun Church (A), Grace Church (B), Beulah Church (C), Saint Joan of Arc Church (D), Shiloh Church (E), Yorktown Baptist Church (F), Saint Stevens Calvary Pentecostal Church (G), Kingdom Hall of Jehovahs Witnesses (H). Display/hide their locations on the map
Parks in zip code 23690 include: Yorktown Monument (1), Colonial National Historical Park (2), Charles E Brown Park (3). Display/hide their locations on the map
In group quarters: 634 (-1 institutionalized population)
Size of family households: 307 2-persons, 254 3-persons, 196 4-persons, 241 5-persons, 70 6-persons, 15 7-or-more-persons
Size of nonfamily households: 351 1-person, 98 2-persons
683 married couples with children.
390 single-parent households (390 women).
88.1% of residents of 23690 zip code speak English at home.
10.0% of residents speak Spanish at home (73% very well, 4% well, 23% not at all).
0.9% of residents speak other Indo-European language at home (68% very well, 18% well, 14% not well).
0.7% of residents speak Asian or Pacific Island language at home (100% well).
0.2% of residents speak other language at home (100% very well).
Foreign born population: 224 (4.7%) (72.4% of them are naturalized citizens)
This zip code:
4.7%
Whole state:
12.7%
20%Malaysia
19%Chile
10%Thailand
9%Belgium
8%Afghanistan
6%Serbia
4%Taiwan
15%American
10%English
7%German
3%Hungarian
2%Ukrainian
2%Irish
2%French Canadian
Year of entry for the foreign-born population
952010 or later
2702000 to 2009
581990 to 1999
189Before 1990
Facilities with environmental interests located in this zip code:
CUSTOM CONCRETE CRUSHER - PORTABLE 61103 (O HARA LANE in NEWPORT NEWS, VA)
AIR MINOR (AIRS/AFS) STATE MASTER (Virginia pollutants databases) - CEDS-61103, AIR PROGRAM Business SIC and NAICS classification: CRUSHED AND BROKEN STONE
Housing units lacking complete plumbing facilities: 1.3% Housing units lacking complete kitchen facilities: 1.4%
58.8%Electricity
37.0%Utility gas
2.9%Wood
0.7%No fuel used
0.5%Bottled, tank, or LP gas
Population in 1990: 3,216.
Place of birth for U.S.-born residents:
This state: 1,609
Northeast: 716
Midwest: 427
South: 1,054
West: 380
52% of the 23690 zip code residents lived in the same house 5 years ago. Out of people who lived in different houses, 27% lived in this county. Out of people who lived in different counties, 50% lived in Virginia.
89% of the 23690 zip code residents lived in the same house 1 year ago. Out of people who lived in different houses, 4% moved from this county. Out of people who lived in different houses, 48% moved from different county within same state. Out of people who lived in different houses, 49% moved from different state. Out of people who lived in different houses, 3% moved from abroad.
Private vs. public school enrollment:
Students in private schools in grades 1 to 8 (elementary and middle school): 34
Here:
5.5%
Virginia:
13.2%
Students in private schools in grades 9 to 12 (high school): 25
Here:
9.7%
Virginia:
10.2%
Students in private undergraduate colleges: 27
Here:
8.7%
Virginia:
18.7%
Occupation by median earnings in the past 12 months ($)
247,976Building and grounds cleaning and maintenance occupations
119,880Computer and mathematical occupations
110,075Health diagnosing and treating practitioners and other technical occupations
109,622Business and financial operations occupations
73,182Education, training, and library occupations
70,627Production occupations
Companies with federal contracts located in this zip code (YORKTOWN, VA):
YORK RIVER ELECTRIC INC (3201 OLD WILLIAMSBURG RD; small business) : $65,479,028 in 528 contractsfrom 2001 to 2006
Contracts for Maintenance, Repair or Alteration of Real Property -- Other Non-Building Facilities, Construction of Structures and Facilities -- Other Non-Building Facilities, Maintenance, Repair or Alteration of Real Property -- Office Buildings, Construction of Structures and Facilities -- Airport Runways, and moreby U.S. Coast Guard, Department of Defense, Public Buildings Service, Army, and others Signed by year:2000: $0; 2001: $1,913,463; 2002: $5,308,168; 2003: $10,755,987; 2004: $15,748,258; 2005: $20,085,974; 2006: $11,667,178.
Biggest contracts:
$2,999,070 with U.S. Coast Guard for Maintenance, Repair or Alteration of Real Property -- Other Non-Building Facilities. Taking place in NC. Signed on 2006-09-25. Completion date: 2007-07-23.
$2,809,982 with Department of Defense for Construction of Structures and Facilities -- Other Non-Building Facilities. Signed on 2005-09-23. Completion date: 2006-09-26.
$2,452,209 with Public Buildings Service for Maintenance, Repair or Alteration of Real Property -- Office Buildings. Signed on 2004-02-26. Completion date: 2004-08-15.
$2,380,341 with Army for Construction of Structures and Facilities -- Airport Runways. Signed on 2003-12-31. Completion date: 2005-01-05.
ASHE FACILITY SERVICES INC (1936 OLD WILLIAMSBURG RD; small business) : $5,624,196 in 88 contractsfrom 2003 to 2006
Contracts for Landscaping/Groundskeeping Services, Maintenance, Repair or Alteration of Real Property -- Other Non-Building Facilities, Construction of Structures and Facilities -- Other Conservation and Development Facilities, Land Treatment Practices Services (plowing/clearing, etc.), and moreby Air Force, Navy, Army, National Park Service, and others Signed by year:2000: $0; 2001: $0; 2002: $0; 2003: $726,624; 2004: $2,277,517; 2005: $1,735,399; 2006: $884,656.
Biggest contracts:
$1,218,532 with Air Force for Landscaping/Groundskeeping Services. Signed on 2005-10-01. Completion date: 2006-09-30.
$1,107,190 with Navy for Landscaping/Groundskeeping Services. Signed on 2004-02-27. Completion date: 2004-09-30.
$1,083,991, same as above.Signed on 2005-09-23. Completion date: 2006-04-01.
$812,282, same as above.Signed on 2006-03-23. Completion date: 2006-09-30.
CUSTOMER SERVICE UNIVERSITY (121 LAFAYETTE ROAD; small business)
$79,000 with Air Force for Training Aids. Signed on 2003-09-11. Completion date: 2003-09-30.
YORK, COUNTY OF (120 ALEXANDER HAMILTON BLV) : $40,200 in 3 contractsfrom 2003 to 2005
$13,400 with Navy for Pest Control Agents and Disinfectants. Signed on 2005-09-01. Completion date: 2005-08-29.
$13,400, same as above.Signed on 2004-09-02. Completion date: 2005-08-29.
$13,400 with Navy for Pesticides Support Services. Signed on 2003-08-21. Completion date: 2003-09-30.
Top industries in this zip code by the number of employees in 2005:
Utilities: Electric Power Distribution (100-249 employees: 1 establishment)
Accommodation and Food Services: Full-Service Restaurants (50-99: 2, 1-4: 1)
Construction: Electrical Contractors (50-99: 1)
Health Care and Social Assistance: Nursing Care Facilities (50-99: 1)
Health Care and Social Assistance: Offices of Physicians (except Mental Health Specialists) (20-49: 2)
Arts, Entertainment, and Recreation: All Other Amusement and Recreation Industries (20-49: 1, 5-9: 1)
Other Services (except Public Administration): Religious Organizations (10-19: 1, 5-9: 3, 1-4: 1)
Accommodation and Food Services: Limited-Service Restaurants (20-49: 1, 1-4: 1)
Construction: Masonry Contractors (20-49: 1)
Accommodation and Food Services: Food Service Contractors (20-49: 1)
People in group quarters in 2010:
241 people in military barracks and dormitories (nondisciplinary)
People in group quarters in 2000:
275 people in military transient quarters for temporary residents
39 people in military barracks, etc.
Fatal accident statistics in 2013:
Fatal accident count: 1
Vehicles involved in fatal accidents: 1
Fatal accidents caused by drunken drivers: 0
Fatalities: 1
Persons involved in fatal accidents: 1
Pedestrians involved in fatal accidents: 1
Fatal accident statistics in 2011:
Fatal accident count: 1
Vehicles involved in fatal accidents: 1
Fatal accidents caused by drunken drivers: 1
Fatalities: 1
Persons involved in fatal accidents: 2
Pedestrians involved in fatal accidents: 0
Home Mortgage Disclosure Act Aggregated Statistics For Year 2009 (Based on 2 partial tracts)
A) FHA, FSA/RHS & VA Home Purchase Loans
B) Conventional Home Purchase Loans
C) Refinancings
D) Home Improvement Loans
E) Loans on Dwellings For 5+ Families
F) Non-occupant Loans on < 5 Family Dwellings (A B C & D)
G) Loans On Manufactured Home Dwelling (A B C & D)
Number
Average Value
Number
Average Value
Number
Average Value
Number
Average Value
Number
Average Value
Number
Average Value
Number
Average Value
LOANS ORIGINATED
93
$259,063
23
$200,234
101
$210,254
7
$138,746
2
$391,805
3
$239,623
0
$0
APPLICATIONS APPROVED, NOT ACCEPTED
0
$0
0
$0
7
$217,249
0
$0
0
$0
2
$186,775
0
$0
APPLICATIONS DENIED
10
$235,748
3
$154,953
35
$242,674
3
$171,553
0
$0
3
$257,330
2
$29,055
APPLICATIONS WITHDRAWN
13
$274,955
8
$219,976
35
$177,879
0
$0
0
$0
0
$0
0
$0
FILES CLOSED FOR INCOMPLETENESS
0
$0
0
$0
10
$263,474
0
$0
0
$0
0
$0
0
$0
Aggregated Statistics For Year 2008 (Based on 2 partial tracts)
A) FHA, FSA/RHS & VA Home Purchase Loans
B) Conventional Home Purchase Loans
C) Refinancings
D) Home Improvement Loans
E) Loans on Dwellings For 5+ Families
F) Non-occupant Loans on < 5 Family Dwellings (A B C & D)
Number
Average Value
Number
Average Value
Number
Average Value
Number
Average Value
Number
Average Value
Number
Average Value
LOANS ORIGINATED
70
$258,327
51
$211,724
63
$178,880
10
$185,942
2
$303,815
13
$182,367
APPLICATIONS APPROVED, NOT ACCEPTED
0
$0
0
$0
10
$129,994
7
$99,137
2
$398,450
0
$0
APPLICATIONS DENIED
0
$0
7
$167,917
58
$204,004
7
$163,174
2
$481,460
7
$447,543
APPLICATIONS WITHDRAWN
8
$283,271
3
$183,730
20
$190,757
0
$0
0
$0
0
$0
FILES CLOSED FOR INCOMPLETENESS
0
$0
3
$173,213
5
$148,754
2
$83,010
0
$0
0
$0
Aggregated Statistics For Year 2007 (Based on 2 partial tracts)
A) FHA, FSA/RHS & VA Home Purchase Loans
B) Conventional Home Purchase Loans
C) Refinancings
D) Home Improvement Loans
E) Loans on Dwellings For 5+ Families
F) Non-occupant Loans on < 5 Family Dwellings (A B C & D)
G) Loans On Manufactured Home Dwelling (A B C & D)
Number
Average Value
Number
Average Value
Number
Average Value
Number
Average Value
Number
Average Value
Number
Average Value
Number
Average Value
LOANS ORIGINATED
17
$266,902
45
$167,385
86
$146,870
8
$67,030
0
$0
10
$88,157
0
$0
APPLICATIONS APPROVED, NOT ACCEPTED
0
$0
3
$310,457
18
$173,030
7
$39,844
0
$0
0
$0
0
$0
APPLICATIONS DENIED
2
$208,355
7
$186,891
61
$172,525
15
$148,311
2
$398,450
2
$83,840
2
$28,225
APPLICATIONS WITHDRAWN
5
$275,926
2
$111,235
30
$105,810
2
$93,800
0
$0
0
$0
0
$0
FILES CLOSED FOR INCOMPLETENESS
0
$0
0
$0
10
$168,842
2
$66,410
0
$0
0
$0
0
$0
Aggregated Statistics For Year 2006 (Based on 2 partial tracts)
A) FHA, FSA/RHS & VA Home Purchase Loans
B) Conventional Home Purchase Loans
C) Refinancings
D) Home Improvement Loans
F) Non-occupant Loans on < 5 Family Dwellings (A B C & D)
G) Loans On Manufactured Home Dwelling (A B C & D)
Number
Average Value
Number
Average Value
Number
Average Value
Number
Average Value
Number
Average Value
Number
Average Value
LOANS ORIGINATED
15
$221,581
50
$219,346
81
$165,364
13
$102,038
10
$228,278
0
$0
APPLICATIONS APPROVED, NOT ACCEPTED
0
$0
7
$153,687
15
$151,078
2
$13,280
3
$199,777
2
$113,725
APPLICATIONS DENIED
0
$0
20
$95,960
38
$132,685
5
$79,026
7
$73,049
2
$43,165
APPLICATIONS WITHDRAWN
0
$0
5
$162,368
48
$124,273
2
$91,310
2
$138,625
0
$0
FILES CLOSED FOR INCOMPLETENESS
0
$0
7
$105,779
2
$130,325
3
$47,040
0
$0
0
$0
Aggregated Statistics For Year 2005 (Based on 2 partial tracts)
A) FHA, FSA/RHS & VA Home Purchase Loans
B) Conventional Home Purchase Loans
C) Refinancings
D) Home Improvement Loans
E) Loans on Dwellings For 5+ Families
F) Non-occupant Loans on < 5 Family Dwellings (A B C & D)
G) Loans On Manufactured Home Dwelling (A B C & D)
Number
Average Value
Number
Average Value
Number
Average Value
Number
Average Value
Number
Average Value
Number
Average Value
Number
Average Value
LOANS ORIGINATED
15
$167,459
33
$123,006
85
$153,285
13
$67,558
3
$888,207
12
$125,345
0
$0
APPLICATIONS APPROVED, NOT ACCEPTED
0
$0
2
$53,125
12
$134,476
3
$44,273
0
$0
0
$0
0
$0
APPLICATIONS DENIED
0
$0
13
$128,729
46
$110,367
15
$73,713
2
$236,580
2
$102,930
5
$64,416
APPLICATIONS WITHDRAWN
3
$265,633
10
$140,121
32
$155,125
5
$87,326
0
$0
0
$0
0
$0
FILES CLOSED FOR INCOMPLETENESS
0
$0
0
$0
12
$192,583
3
$80,243
0
$0
0
$0
0
$0
Aggregated Statistics For Year 2004 (Based on 2 partial tracts)
A) FHA, FSA/RHS & VA Home Purchase Loans
B) Conventional Home Purchase Loans
C) Refinancings
D) Home Improvement Loans
E) Loans on Dwellings For 5+ Families
F) Non-occupant Loans on < 5 Family Dwellings (A B C & D)
G) Loans On Manufactured Home Dwelling (A B C & D)
Number
Average Value
Number
Average Value
Number
Average Value
Number
Average Value
Number
Average Value
Number
Average Value
Number
Average Value
LOANS ORIGINATED
12
$102,794
51
$142,484
63
$137,612
12
$20,752
2
$210,015
12
$87,438
0
$0
APPLICATIONS APPROVED, NOT ACCEPTED
2
$68,900
10
$59,103
10
$141,615
2
$53,125
0
$0
0
$0
3
$37,630
APPLICATIONS DENIED
2
$178,470
18
$103,763
53
$90,089
8
$20,960
2
$219,975
8
$62,465
5
$49,474
APPLICATIONS WITHDRAWN
3
$138,350
5
$97,620
25
$130,824
0
$0
0
$0
5
$134,144
0
$0
FILES CLOSED FOR INCOMPLETENESS
0
$0
0
$0
10
$123,021
0
$0
0
$0
2
$89,650
0
$0
Aggregated Statistics For Year 2003 (Based on 2 partial tracts)
A) FHA, FSA/RHS & VA Home Purchase Loans
B) Conventional Home Purchase Loans
C) Refinancings
D) Home Improvement Loans
E) Loans on Dwellings For 5+ Families
F) Non-occupant Loans on < 5 Family Dwellings (A B C & D)
Number
Average Value
Number
Average Value
Number
Average Value
Number
Average Value
Number
Average Value
Number
Average Value
LOANS ORIGINATED
45
$164,065
68
$132,059
98
$163,072
2
$9,130
2
$933,865
10
$117,376
APPLICATIONS APPROVED, NOT ACCEPTED
2
$120,365
7
$69,491
10
$106,253
3
$8,300
0
$0
5
$103,928
APPLICATIONS DENIED
2
$135,305
3
$158,827
48
$106,495
3
$24,350
0
$0
2
$33,205
APPLICATIONS WITHDRAWN
0
$0
12
$160,348
30
$101,660
0
$0
0
$0
2
$99,610
FILES CLOSED FOR INCOMPLETENESS
0
$0
2
$111,235
0
$0
0
$0
0
$0
0
$0
Aggregated Statistics For Year 2002 (Based on 2 partial tracts)
A) FHA, FSA/RHS & VA Home Purchase Loans
B) Conventional Home Purchase Loans
C) Refinancings
D) Home Improvement Loans
F) Non-occupant Loans on < 5 Family Dwellings (A B C & D)
Number
Average Value
Number
Average Value
Number
Average Value
Number
Average Value
Number
Average Value
LOANS ORIGINATED
23
$156,564
25
$139,125
55
$124,334
3
$3,873
13
$81,733
APPLICATIONS APPROVED, NOT ACCEPTED
2
$132,815
2
$44,825
7
$64,747
2
$33,205
0
$0
APPLICATIONS DENIED
0
$0
5
$68,400
43
$101,156
5
$35,528
0
$0
APPLICATIONS WITHDRAWN
3
$216,933
3
$138,350
22
$64,748
0
$0
0
$0
FILES CLOSED FOR INCOMPLETENESS
0
$0
3
$244,603
7
$88,940
0
$0
0
$0
Aggregated Statistics For Year 2001 (Based on 2 partial tracts)
A) FHA, FSA/RHS & VA Home Purchase Loans
B) Conventional Home Purchase Loans
C) Refinancings
D) Home Improvement Loans
F) Non-occupant Loans on < 5 Family Dwellings (A B C & D)
Number
Average Value
Number
Average Value
Number
Average Value
Number
Average Value
Number
Average Value
LOANS ORIGINATED
17
$99,514
33
$140,010
70
$103,359
7
$11,859
8
$59,560
APPLICATIONS APPROVED, NOT ACCEPTED
2
$128,665
10
$89,485
5
$70,060
2
$4,150
0
$0
APPLICATIONS DENIED
0
$0
17
$89,455
43
$58,339
13
$18,901
7
$55,499
APPLICATIONS WITHDRAWN
2
$176,810
3
$73,603
10
$65,744
2
$24,905
2
$61,425
FILES CLOSED FOR INCOMPLETENESS
0
$0
0
$0
5
$70,060
0
$0
0
$0
Aggregated Statistics For Year 2000 (Based on 2 partial tracts)
A) FHA, FSA/RHS & VA Home Purchase Loans
B) Conventional Home Purchase Loans
C) Refinancings
D) Home Improvement Loans
F) Non-occupant Loans on < 5 Family Dwellings (A B C & D)
Number
Average Value
Number
Average Value
Number
Average Value
Number
Average Value
Number
Average Value
LOANS ORIGINATED
35
$112,657
23
$105,170
23
$54,426
8
$25,318
7
$56,447
APPLICATIONS APPROVED, NOT ACCEPTED
3
$74,157
8
$51,881
2
$42,335
2
$11,620
0
$0
APPLICATIONS DENIED
8
$72,634
15
$38,849
35
$50,043
12
$12,867
0
$0
APPLICATIONS WITHDRAWN
2
$97,950
0
$0
18
$49,068
0
$0
3
$52,573
FILES CLOSED FOR INCOMPLETENESS
0
$0
0
$0
0
$0
0
$0
0
$0
Aggregated Statistics For Year 1999 (Based on 1 partial tract)
Detailed PMIC statistics for the following Tracts:0505.00
2002 - 2018 National Fire Incident Reporting System (NFIRS) incidents
Based on the data from the years 2002 - 2018 the average number of fires per year is 11. The highest number of fire incidents - 26 took place in 2008, and the least - 4 in 2013. The data has a constant trend.
When looking into fire subcategories, the most reports belonged to: Outside Fires (41.5%), and Structure Fires (37.4%).
Fire incident types reported to NFIRS in Zip Code 23690


 Nearest zip codes: 23062, 23691, 23603, 23692, 23608, 23072.


 Based on the data from the years 2002 - 2018 the average number of fires per year is 11. The highest number of fire incidents - 26 took place in 2008, and the least - 4 in 2013. The data has a constant trend.
 When looking into fire subcategories, the most reports belonged to: Outside Fires (41.5%), and Structure Fires (37.4%).