Estimated zip code population in 2022: 2,572 Zip code population in 2010: 2,622 Zip code population in 2000: 2,677
Houses and condos: 639 Renter-occupied apartments: 125
% of renters here:
22%
State:
33%
March 2022 cost of living index in zip code 23829: 84.0 (less than average, U.S. average is 100)
Land area: 81.8 sq. mi. Water area: 0.3 sq. mi.
Population density: 31 people per square mile
(very low).
OSM Map
General Map
Google Map
MSN Map
OSM Map
General Map
Google Map
MSN Map
OSM Map
General Map
Google Map
MSN Map
OSM Map
General Map
Google Map
MSN Map
Please wait while loading the map...
Real estate property taxes paid for housing units in 2022:
This zip code:
0.8% ($2,069)
Virginia:
0.7% ($2,617)
Median real estate property taxes paid for housing units with mortgages in 2022: $2,218 (0.9%) Median real estate property taxes paid for housing units with no mortgage in 2022: $1,986 (0.8%)
Estimated median house/condo value in 2022: $253,988
23829:
$253,988
Virginia:
$365,700
According to our research of Virginia and other state lists, there were 7 registered sex offenders living in 23829 zip code as of May 28, 2024. The ratio of all residents to sex offenders in zip code 23829 is 372 to 1. The ratio of registered sex offenders to all residents in this zip code is near the state average.
Median resident age:
This zip code:
51.1 years
Virginia median age:
39.0 years
Average household size:
This zip code:
2.4 people
Virginia:
2.5 people
Averages for the 2020 tax year for zip code 23829, filed in 2021:
Average Adjusted Gross Income (AGI) in 2020: $49,403 (Individual Income Tax Returns)
Here:
$49,403
State:
$86,446
Salary/wage: $45,260 (reported on 71.6% of returns)
Here:
$45,260
State:
$71,185
(% of AGI for various income ranges: 1030.6% for AGIs below $25k, 3335.4% for AGIs $25k-50k, 6558.3% for AGIs $50k-75k, 10015.0% for AGIs $75k-100k, 19240.0% for AGIs $100k-200k)
Taxable interest for individuals: $705 (reported on 29.9% of returns)
This zip code:
$705
Virginia:
$1,805
(% of AGI for various income ranges: 8.8% for AGIs below $25k, 46.9% for AGIs $25k-50k, 62.5% for AGIs $75k-100k, 100.0% for AGIs $100k-200k)
Ordinary dividends: $4,043 (reported on 10.4% of returns)
Here:
$4,043
State:
$8,327
(% of AGI for various income ranges: 21.8% for AGIs below $25k, 250.0% for AGIs $50k-75k, 240.0% for AGIs $100k-200k)
Net capital gain/loss in AGI: +$24,040 (reported on 7.5% of returns)
Here:
+$24,040
State:
+$24,644
(% of AGI for various income ranges: 51.5% for AGIs $25k-50k, 2837.5% for AGIs $100k-200k)
Profit/loss from business: +$2,038 (reported on 11.9% of returns)
Here:
+$2,038
State:
+$12,836
(% of AGI for various income ranges: 27.1% for AGIs below $25k, 22.3% for AGIs $25k-50k, 220.0% for AGIs $75k-100k)
Taxable individual retirement arrangement distribution: $5,750 (reported on 6.0% of returns)
23829:
$5,750
Virginia:
$21,535
(% of AGI for various income ranges: 383.3% for AGIs $50k-75k)
Total itemized deductions: $31,760 (reported on 7.5% of returns)
Here:
$31,760
State:
$33,287
(% of AGI for various income ranges: 321.2% for AGIs below $25k, 2605.0% for AGIs $75k-100k)
Charity contributions: $13,420 (reported on 7.5% of returns)
Here:
$13,420
State:
$10,381
(% of AGI for various income ranges: 1677.5% for AGIs $75k-100k)
Taxes paid: $5,900 (reported on 7.5% of returns)
23829:
$5,900
State:
$8,284
(% of AGI for various income ranges: 40.0% for AGIs below $25k, 567.5% for AGIs $75k-100k)
Earned income credit: $1,900 (reported on 14.9% of returns)
Here:
$1,900
State:
$2,214
(% of AGI for various income ranges: 61.8% for AGIs below $25k, 65.4% for AGIs $25k-50k)
Percentage of individuals using paid preparers for their 2020 taxes: 82.1%
Here:
82%
State:
92%
(% for various income ranges: 67.9% for AGIs below $25k, 87.5% for AGIs $25k-50k, 88.9% for AGIs $50k-75k, 100.0% for AGIs $75k-100k, 100.0% for AGIs $100k-200k)
Averages for the 2012 tax year for zip code 23829, filed in 2013:
Average Adjusted Gross Income (AGI) in 2012: $42,385 (Individual Income Tax Returns)
Here:
$42,385
State:
$71,192
Salary/wage: $36,674 (reported on 83.6% of returns)
Here:
$36,674
State:
$59,229
(% of AGI for various income ranges: 72.8% for AGIs below $25k, 79.7% for AGIs $25k-50k, 68.6% for AGIs $50k-75k, 76.8% for AGIs $75k-100k, 63.9% for AGIs $100k-200k)
Taxable interest for individuals: $1,092 (reported on 23.6% of returns)
This zip code:
$1,092
Virginia:
$1,600
(% of AGI for various income ranges: 0.8% for AGIs below $25k, 0.4% for AGIs $25k-50k, 0.7% for AGIs $50k-75k, 1.4% for AGIs $75k-100k)
Ordinary dividends: $3,329 (reported on 12.7% of returns)
Here:
$3,329
State:
$6,959
(% of AGI for various income ranges: 1.3% for AGIs below $25k, 0.4% for AGIs $25k-50k, 3.9% for AGIs $75k-100k)
Net capital gain/loss in AGI: +$2,320 (reported on 9.1% of returns)
Here:
+$2,320
State:
+$16,672
Profit/loss from business: +$3,500 (reported on 10.9% of returns)
Here:
+$3,500
State:
+$14,116
Taxable individual retirement arrangement distribution: $7,875 (reported on 7.3% of returns)
23829:
$7,875
Virginia:
$16,667
Total itemized deductions: $19,681 (28% of AGI, reported on 29.1% of returns)
Here:
$19,681
State:
$26,596
Here:
27.8% of AGI
State:
20.1% of AGI
(% of AGI for various income ranges: 16.9% for AGIs $25k-50k, 12.5% for AGIs $50k-75k, 15.9% for AGIs $75k-100k, 16.6% for AGIs $100k-200k)
Charity contributions: $4,615 (reported on 23.6% of returns)
Here:
$4,615
State:
$4,443
(% of AGI for various income ranges: 1.8% for AGIs $25k-50k, 2.8% for AGIs $50k-75k, 4.3% for AGIs $75k-100k, 3.1% for AGIs $100k-200k)
Taxes paid: $5,225 (reported on 29.1% of returns)
23829:
$5,225
State:
$9,951
(% of AGI for various income ranges: 2.9% for AGIs $25k-50k, 3.8% for AGIs $50k-75k, 4.4% for AGIs $75k-100k, 5.5% for AGIs $100k-200k)
Earned income credit: $2,070 (reported on 18.2% of returns)
Here:
$2,070
State:
$2,211
(% of AGI for various income ranges: 4.8% for AGIs below $25k, 1.2% for AGIs $25k-50k)
Percentage of individuals using paid preparers for their 2012 taxes: 49.1%
Here:
49%
State:
46%
(% for various income ranges: 40.9% for AGIs below $25k, 53.3% for AGIs $25k-50k, 55.6% for AGIs $50k-75k, 60.0% for AGIs $75k-100k, 50.0% for AGIs $100k-200k)
Averages for the 2004 tax year for zip code 23829, filed in 2005:
Average Adjusted Gross Income (AGI) in 2004: $35,454 (Individual Income Tax Returns)
Here:
$35,454
State:
$56,704
Salary/wage: $32,826 (reported on 85.0% of returns)
Here:
$32,826
State:
$48,441
(% of AGI for various income ranges: 111.5% for AGIs below $10k, 79.6% for AGIs $10k-25k, 80.3% for AGIs $25k-50k, 79.9% for AGIs $50k-75k, 78.5% for AGIs $75k-100k, 66.0% for AGIs over 100k)
Taxable interest for individuals: $953 (reported on 35.2% of returns)
This zip code:
$953
Virginia:
$1,688
(% of AGI for various income ranges: 1.3% for AGIs below $10k, 0.7% for AGIs $10k-25k, 1.7% for AGIs $25k-50k, 0.8% for AGIs $50k-75k, 0.5% for AGIs $75k-100k, 0.5% for AGIs over 100k)
Taxable dividends: $1,589 (reported on 13.5% of returns)
Here:
$1,589
State:
$4,028
(% of AGI for various income ranges: 2.9% for AGIs below $10k, 1.1% for AGIs $10k-25k, 0.3% for AGIs $25k-50k, 0.1% for AGIs $50k-75k, 0.3% for AGIs $75k-100k, 1.8% for AGIs over 100k)
Net capital gain/loss: +$4,492 (reported on 11.3% of returns)
Here:
+$4,492
State:
+$14,375
(% of AGI for various income ranges: -2.7% for AGIs below $10k, 0.0% for AGIs $10k-25k, 1.3% for AGIs $25k-50k, 5.9% for AGIs $75k-100k)
Profit/loss from business: +$3,088 (reported on 10.6% of returns)
Here:
+$3,088
State:
+$13,342
Total itemized deductions: $15,263 (25% of AGI, reported on 28.1% of returns)
Here:
$15,263
State:
$21,492
Here:
24.8% of AGI
State:
21.0% of AGI
(% of AGI for various income ranges: 9.0% for AGIs $10k-25k, 13.0% for AGIs $25k-50k, 12.1% for AGIs $50k-75k, 14.2% for AGIs $75k-100k, 12.6% for AGIs over 100k)
Charity contributions deductions: $3,926 (6% of AGI, reported on 25.0% of returns)
Here:
$3,926
State:
$3,794
Here:
6.2% of AGI
State:
3.5% of AGI
(% of AGI for various income ranges: 1.4% for AGIs $10k-25k, 3.0% for AGIs $25k-50k, 2.7% for AGIs $50k-75k, 2.9% for AGIs $75k-100k, 4.1% for AGIs over 100k)
Total tax: $3,740 (reported on 72.0% of returns)
23829:
$3,740
State:
$9,537
(% of AGI for various income ranges: 1.9% for AGIs below $10k, 4.1% for AGIs $10k-25k, 6.8% for AGIs $25k-50k, 8.2% for AGIs $50k-75k, 9.9% for AGIs $75k-100k, 9.6% for AGIs over 100k)
Earned income credit: $1,830 (reported on 18.5% of returns)
Here:
$1,830
State:
$1,734
Percentage of individuals using paid preparers for their 2004 taxes: 56.1%
Here:
56%
State:
52%
(% for various income ranges: 55.6% for AGIs below $10k, 52.4% for AGIs $10k-25k, 55.9% for AGIs $25k-50k, 56.6% for AGIs $50k-75k, 60.5% for AGIs $75k-100k, 77.8% for AGIs over 100k)
Household received Food Stamps/SNAP in the past 12 months: 15 Household did not receive Food Stamps/SNAP in the past 12 months: 555
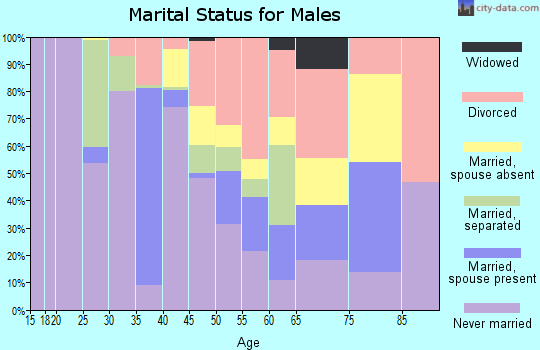
Women who did not have a birth in the past 12 months: 367 (178 now married, 188 unmarried)
Housing units in zip code 23829 with a mortgage: 306 (27 second mortgage, 19 both second mortgage and home equity loan) Median monthly owner costs for units with a mortgage: $1,373 Median monthly owner costs for units without a mortgage: $552
Residents with income below the poverty level in 2022:
This zip code:
4.8%
Whole state:
10.6%
Residents with income below 50% of the poverty level in 2022:
This zip code:
1.1%
Whole state:
5.2%
Median number of rooms in houses and condos:
Here:
6.5
State:
7.0
Median number of rooms in apartments:
Here:
4.7
State:
4.3
Notable locations in this zip code not listed on our city pages
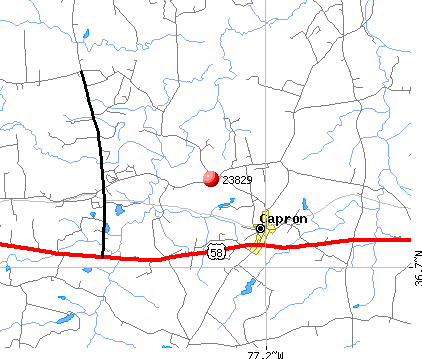
Notable locations in zip code 23829: Southampton Motor Speedway (A), Capron Volunteer Fire and First Aid Squad (B), Southampton State Correctional Farm (C). Display/hide their locations on the map
Churches in zip code 23829 include: Rising Star Church (A), Bethel Star Church (B), Mars Hill Church (C), Mill Neck Church (D). Display/hide their locations on the map
Streams, rivers, and creeks: Three Creek (A), Smith Swamp (B), Raccoon Creek (C), Poplar Swamp (D), Musgrave Branch (E), Hornet Swamp (F), Cobb Branch (G), Angelico Creek (H). Display/hide their locations on the map
In group quarters: 1,191 (-1 institutionalized population)
Size of family households: 194 2-persons, 82 3-persons, 128 4-persons, 10 5-persons
Size of nonfamily households: 108 1-person, 49 2-persons, 1 4-persons
210 married couples with children.
16 single-parent households (16 women).
93.3% of residents of 23829 zip code speak English at home.
5.2% of residents speak Spanish at home (34% very well, 63% well, 3% not well).
0.2% of residents speak other Indo-European language at home (100% very well).
0.1% of residents speak Asian or Pacific Island language at home (100% very well).
Foreign born population: 69 (2.7%) (89.0% of them are naturalized citizens)
This zip code:
2.7%
Whole state:
12.7%
80%Guyana
8%Bhutan
3%Thailand
3%Chile
2%Greece
18%English
13%African
10%American
6%Irish
2%Swiss
2%Haitian
2%German
Year of entry for the foreign-born population
52010 or later
542000 to 2009
211990 to 1999
15Before 1990
Facilities with environmental interests located in this zip code:
CAPRON ELEMENTARY SCHOOL (18414 SOUTHAMPTON PARKWAY in CAPRON, VA)
(National Center for Education Statistics) - STATE ID-0870710 National Pollutant Discharge Elimination System NON-MAJOR (Tracking pollutant discharge elimination systems) - permit Business SIC classification: ELEMENTARY AND SECONDARY SCHOOLS Organizations: CAPRON TOWN - ELEMENTARY SCHOO (CONTACT/OWNER)
, SOUTHAMPTON COUNTY PUBLIC SCHOOLS (SCHOOL DISTRICT)
65.3%Electricity
21.6%Bottled, tank, or LP gas
11.4%Fuel oil, kerosene, etc.
1.6%Other fuel
Population in 1990: 2,364. Population change in the 1990s: +313 (+13.2%).
Place of birth for U.S.-born residents:
This state: 1,740
Northeast: 224
Midwest: 85
South: 355
West: 53
43% of the 23829 zip code residents lived in the same house 5 years ago. Out of people who lived in different houses, 12% lived in this county. Out of people who lived in different counties, 50% lived in Virginia.
83% of the 23829 zip code residents lived in the same house 1 year ago. Out of people who lived in different houses, 5% moved from this county. Out of people who lived in different houses, 95% moved from different county within same state. Out of people who lived in different houses, 1% moved from different state.
Private vs. public school enrollment:
Students in private schools in grades 1 to 8 (elementary and middle school): 23
Here:
21.5%
Virginia:
13.2%
Students in private schools in grades 9 to 12 (high school): 52
Here:
30.7%
Virginia:
10.2%
Students in private undergraduate colleges: 22
Here:
44.0%
Virginia:
18.7%
Occupation by median earnings in the past 12 months ($)
80,462Production occupations
67,123Construction and extraction occupations
64,410Management occupations
55,281Business and financial operations occupations
52,302Sales and related occupations
41,090Farming, fishing, and forestry occupations
Top industries in this zip code by the number of employees in 2005:
Other Services (except Public Administration): Religious Organizations (1-4 employees: 2 establishments)
Wholesale Trade: Other Farm Product Raw Material Merchant Wholesalers (1-4: 1)
Construction: All Other Specialty Trade Contractors (1-4: 1)
Construction: Painting and Wall Covering Contractors (1-4: 1)
Real Estate and Rental and Leasing: Offices of Real Estate Agents and Brokers (1-4: 1)
Construction: Residential Remodelers (1-4: 1)
Finance and Insurance: Commercial Banking (1-4: 1)
People in group quarters in 2010:
1,283 people in state prisons
100 people in correctional residential facilities
People in group quarters in 2000:
1,374 people in state prisons
Fatal accident statistics in 2012:
Fatal accident count: 2
Vehicles involved in fatal accidents: 2
Fatal accidents caused by drunken drivers: 1
Fatalities: 2
Persons involved in fatal accidents: 3
Pedestrians involved in fatal accidents: 0
2003 - 2018 National Fire Incident Reporting System (NFIRS) incidents
According to the data from the years 2003 - 2018 the average number of fire incidents per year is 8. The highest number of reported fire incidents - 22 took place in 2006, and the least - 3 in 2003. The data has an increasing trend.
When looking into fire subcategories, the most incidents belonged to: Structure Fires (44.7%), and Outside Fires (40.7%).
Fire incident types reported to NFIRS in Zip Code 23829

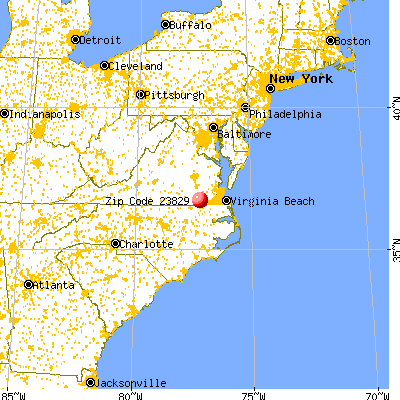


 Nearest zip codes: 23897, 23844, 23827, 23837, 23828, 23874.


 According to the data from the years 2003 - 2018 the average number of fire incidents per year is 8. The highest number of reported fire incidents - 22 took place in 2006, and the least - 3 in 2003. The data has an increasing trend.
 When looking into fire subcategories, the most incidents belonged to: Structure Fires (44.7%), and Outside Fires (40.7%).