Estimated zip code population in 2022: 2,330 Zip code population in 2010: 2,176 Zip code population in 2000: 4,472
Houses and condos: 1,202 Renter-occupied apartments: 223
% of renters here:
22%
State:
33%
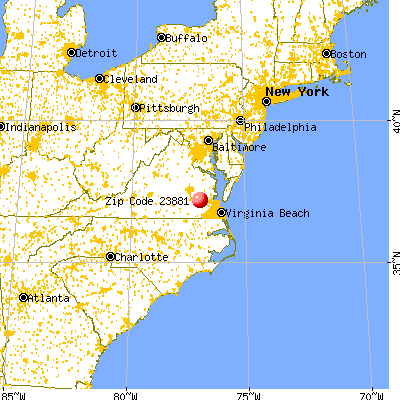
March 2022 cost of living index in zip code 23881: 85.3 (less than average, U.S. average is 100)
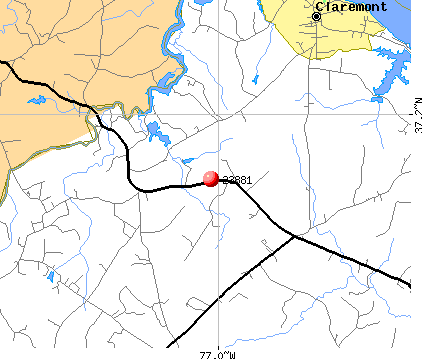
Land area: 119.6 sq. mi. Water area: 16.9 sq. mi.
Population density: 19 people per square mile
(very low).
OSM Map
General Map
Google Map
MSN Map
OSM Map
General Map
Google Map
MSN Map
OSM Map
General Map
Google Map
MSN Map
OSM Map
General Map
Google Map
MSN Map
Please wait while loading the map...
Real estate property taxes paid for housing units in 2022:
This zip code:
0.6% ($1,676)
Virginia:
0.7% ($2,617)
Median real estate property taxes paid for housing units with mortgages in 2022: $1,821 (0.7%) Median real estate property taxes paid for housing units with no mortgage in 2022: $1,359 (0.4%)
Business Search- 14 Million verified businesses
Males: 1,306
(56.0%)
Females: 1,024
(44.0%)
For population 25 years and over in 23881:
High school or higher: 89.1%
Bachelor's degree or higher: 21.7%
Graduate or professional degree: 8.8%
Unemployed: 6.2%
Mean travel time to work (commute): 36.8 minutes
For population 15 years and over in 23881:
Never married: 33.9%
Now married: 43.7%
Separated: 4.6%
Widowed: 7.2%
Divorced: 10.7%
Zip code 23881 compared to state average:
Unemployed percentage above state average.
Black race population percentage above state average.
Hispanic race population percentage significantly below state average.
Median age above state average.
Foreign-born population percentage significantly below state average.
Length of stay since moving in significantly above state average.
Percentage of population with a bachelor's degree or higher below state average.
Averages for the 2020 tax year for zip code 23881, filed in 2021:
Average Adjusted Gross Income (AGI) in 2020: $57,715 (Individual Income Tax Returns)
Here:
$57,715
State:
$86,446
Salary/wage: $51,554 (reported on 81.0% of returns)
Here:
$51,554
State:
$71,185
(% of AGI for various income ranges: 1102.9% for AGIs below $25k, 3379.4% for AGIs $25k-50k, 6210.0% for AGIs $50k-75k, 10888.0% for AGIs $75k-100k, 15462.9% for AGIs $100k-200k)
Taxable interest for individuals: $757 (reported on 27.4% of returns)
This zip code:
$757
Virginia:
$1,805
(% of AGI for various income ranges: 3.8% for AGIs below $25k, 26.5% for AGIs $25k-50k, 17.0% for AGIs $50k-75k, 30.0% for AGIs $75k-100k, 127.1% for AGIs $100k-200k)
Ordinary dividends: $5,364 (reported on 13.1% of returns)
Here:
$5,364
State:
$8,327
(% of AGI for various income ranges: 20.0% for AGIs below $25k, 78.0% for AGIs $50k-75k, 671.4% for AGIs $100k-200k)
Net capital gain/loss in AGI: +$7,100 (reported on 10.7% of returns)
Here:
+$7,100
State:
+$24,644
(% of AGI for various income ranges: 23.5% for AGIs $25k-50k, 855.7% for AGIs $100k-200k)
Taxable individual retirement arrangement distribution: $12,114 (reported on 8.3% of returns)
23881:
$12,114
Virginia:
$21,535
(% of AGI for various income ranges: 165.9% for AGIs $25k-50k, 1132.0% for AGIs $75k-100k)
Total itemized deductions: $25,412 (reported on 9.5% of returns)
Here:
$25,412
State:
$33,287
(% of AGI for various income ranges: 349.4% for AGIs $25k-50k, 481.0% for AGIs $50k-75k, 1368.6% for AGIs $100k-200k)
Charity contributions: $8,950 (reported on 7.1% of returns)
Here:
$8,950
State:
$10,381
(% of AGI for various income ranges: 150.0% for AGIs $25k-50k, 402.9% for AGIs $100k-200k)
Taxes paid: $6,038 (reported on 9.5% of returns)
23881:
$6,038
State:
$8,284
(% of AGI for various income ranges: 61.8% for AGIs $25k-50k, 112.0% for AGIs $50k-75k, 380.0% for AGIs $100k-200k)
Earned income credit: $2,320 (reported on 17.9% of returns)
Here:
$2,320
State:
$2,214
(% of AGI for various income ranges: 114.3% for AGIs below $25k, 63.5% for AGIs $25k-50k)
Percentage of individuals using paid preparers for their 2020 taxes: 91.7%
Here:
92%
State:
92%
(% for various income ranges: 88.9% for AGIs below $25k, 90.5% for AGIs $25k-50k, 84.6% for AGIs $50k-75k, 100.0% for AGIs $75k-100k, 100.0% for AGIs $100k-200k, 100.0% for AGIs over 200k)
Averages for the 2012 tax year for zip code 23881, filed in 2013:
Average Adjusted Gross Income (AGI) in 2012: $50,375 (Individual Income Tax Returns)
Here:
$50,375
State:
$71,192
Salary/wage: $42,133 (reported on 90.0% of returns)
Here:
$42,133
State:
$59,229
(% of AGI for various income ranges: 77.1% for AGIs below $25k, 84.6% for AGIs $25k-50k, 84.2% for AGIs $50k-75k, 72.8% for AGIs $75k-100k, 67.9% for AGIs $100k-200k)
Taxable interest for individuals: $558 (reported on 30.0% of returns)
This zip code:
$558
Virginia:
$1,600
(% of AGI for various income ranges: 0.6% for AGIs below $25k, 0.2% for AGIs $25k-50k, 0.1% for AGIs $50k-75k, 0.5% for AGIs $75k-100k, 0.3% for AGIs $100k-200k)
Ordinary dividends: $2,050 (reported on 12.5% of returns)
Here:
$2,050
State:
$6,959
(% of AGI for various income ranges: 0.4% for AGIs $25k-50k, 1.0% for AGIs $75k-100k, 0.7% for AGIs $100k-200k)
Net capital gain/loss in AGI: +$2,583 (reported on 7.5% of returns)
Here:
+$2,583
State:
+$16,672
Profit/loss from business: +$943 (reported on 8.8% of returns)
Here:
+$943
State:
+$14,116
(% of AGI for various income ranges: 1.5% for AGIs below $25k, 0.6% for AGIs $75k-100k)
Taxable individual retirement arrangement distribution: $11,867 (reported on 7.5% of returns)
23881:
$11,867
Virginia:
$16,667
Total itemized deductions: $19,943 (23% of AGI, reported on 35.0% of returns)
Here:
$19,943
State:
$26,596
Here:
22.9% of AGI
State:
20.1% of AGI
(% of AGI for various income ranges: 11.5% for AGIs below $25k, 11.2% for AGIs $25k-50k, 15.7% for AGIs $50k-75k, 13.5% for AGIs $75k-100k, 15.1% for AGIs $100k-200k)
Charity contributions: $3,754 (reported on 30.0% of returns)
Here:
$3,754
State:
$4,443
(% of AGI for various income ranges: 1.8% for AGIs below $25k, 2.4% for AGIs $25k-50k, 3.0% for AGIs $50k-75k, 2.0% for AGIs $75k-100k, 2.1% for AGIs $100k-200k)
Taxes paid: $6,382 (reported on 35.0% of returns)
23881:
$6,382
State:
$9,951
(% of AGI for various income ranges: 2.0% for AGIs below $25k, 2.7% for AGIs $25k-50k, 4.2% for AGIs $50k-75k, 4.6% for AGIs $75k-100k, 5.9% for AGIs $100k-200k)
Earned income credit: $2,165 (reported on 21.2% of returns)
Here:
$2,165
State:
$2,211
(% of AGI for various income ranges: 7.2% for AGIs below $25k, 1.0% for AGIs $25k-50k)
Percentage of individuals using paid preparers for their 2012 taxes: 46.2%
Here:
46%
State:
46%
(% for various income ranges: 37.5% for AGIs below $25k, 50.0% for AGIs $25k-50k, 50.0% for AGIs $50k-75k, 50.0% for AGIs $75k-100k, 60.0% for AGIs $100k-200k)
Averages for the 2004 tax year for zip code 23881, filed in 2005:
Average Adjusted Gross Income (AGI) in 2004: $41,501 (Individual Income Tax Returns)
Here:
$41,501
State:
$56,704
Salary/wage: $37,462 (reported on 90.5% of returns)
Here:
$37,462
State:
$48,441
(% of AGI for various income ranges: 113.6% for AGIs below $10k, 82.2% for AGIs $10k-25k, 85.2% for AGIs $25k-50k, 86.3% for AGIs $50k-75k, 86.8% for AGIs $75k-100k, 66.0% for AGIs over 100k)
Taxable interest for individuals: $793 (reported on 35.7% of returns)
This zip code:
$793
Virginia:
$1,688
(% of AGI for various income ranges: 0.9% for AGIs below $10k, 1.4% for AGIs $10k-25k, 0.4% for AGIs $25k-50k, 0.5% for AGIs $50k-75k, 0.2% for AGIs $75k-100k, 1.1% for AGIs over 100k)
Taxable dividends: $983 (reported on 15.5% of returns)
Here:
$983
State:
$4,028
(% of AGI for various income ranges: 0.4% for AGIs $10k-25k, 0.1% for AGIs $25k-50k, 0.1% for AGIs $50k-75k, 0.6% for AGIs $75k-100k, 0.7% for AGIs over 100k)
Net capital gain/loss: +$5,500 (reported on 9.6% of returns)
Here:
+$5,500
State:
+$14,375
(% of AGI for various income ranges: 1.9% for AGIs $10k-25k, 0.2% for AGIs $25k-50k, -0.2% for AGIs $75k-100k, 4.7% for AGIs over 100k)
Profit/loss from business: +$3,984 (reported on 8.2% of returns)
Here:
+$3,984
State:
+$13,342
Profit/loss from farming: +$200 (reported on 1.3% of returns)
Here:
+$200
State:
-$5,267
IRA payment deduction: $2,077 (reported on 1.7% of returns)
23881:
$2,077
Virginia:
$2,943
Total itemized deductions: $17,092 (24% of AGI, reported on 36.8% of returns)
Here:
$17,092
State:
$21,492
Here:
23.8% of AGI
State:
21.0% of AGI
(% of AGI for various income ranges: 7.7% for AGIs $10k-25k, 13.8% for AGIs $25k-50k, 16.7% for AGIs $50k-75k, 18.5% for AGIs $75k-100k, 17.2% for AGIs over 100k)
Charity contributions deductions: $3,276 (5% of AGI, reported on 31.6% of returns)
Here:
$3,276
State:
$3,794
Here:
4.5% of AGI
State:
3.5% of AGI
(% of AGI for various income ranges: 1.0% for AGIs $10k-25k, 2.6% for AGIs $25k-50k, 3.0% for AGIs $50k-75k, 2.7% for AGIs $75k-100k, 2.8% for AGIs over 100k)
Total tax: $5,039 (reported on 74.2% of returns)
23881:
$5,039
State:
$9,537
(% of AGI for various income ranges: 1.4% for AGIs below $10k, 3.3% for AGIs $10k-25k, 6.8% for AGIs $25k-50k, 8.9% for AGIs $50k-75k, 9.3% for AGIs $75k-100k, 15.0% for AGIs over 100k)
Earned income credit: $1,987 (reported on 19.5% of returns)
Here:
$1,987
State:
$1,734
Percentage of individuals using paid preparers for their 2004 taxes: 52.7%
Here:
53%
State:
52%
(% for various income ranges: 48.1% for AGIs below $10k, 52.8% for AGIs $10k-25k, 49.5% for AGIs $25k-50k, 60.0% for AGIs $50k-75k, 52.8% for AGIs $75k-100k, 60.9% for AGIs over 100k)
Household received Food Stamps/SNAP in the past 12 months: 214 Household did not receive Food Stamps/SNAP in the past 12 months: 797
Women who had a birth in the past 12 months: 32 (8 now married, 22 unmarried) Women who did not have a birth in the past 12 months: 348 (166 now married, 181 unmarried)
Housing units in zip code 23881 with a mortgage: 502 (22 second mortgage, 21 both second mortgage and home equity loan) Median monthly owner costs for units with a mortgage: $1,470 Median monthly owner costs for units without a mortgage: $369
Residents with income below the poverty level in 2022:
This zip code:
23.8%
Whole state:
10.6%
Residents with income below 50% of the poverty level in 2022:
This zip code:
14.5%
Whole state:
5.2%
Median number of rooms in houses and condos:
Here:
6.4
State:
7.0
Median number of rooms in apartments:
Here:
3.9
State:
4.3
Notable locations in this zip code not listed on our city pages
Notable locations in zip code 23881: Dancing Point Shoal Channel Range (A), Old Courthouse Corners (B), Pipsico Boy Scout Reservation (C), Four Mile Tree (D), Dillard Wharf (E), Swanns Point Plantation (F), Brandon Plantation (G), Clarks Landing (H), Cross Creek Landing (I), Johnsons Landing (J), Camp Lions (K), Camp Kiwanis (L), Cabin Point (M), Upper Brandon Farms Wharf (N), Ritchie Wharf (O), Claremont Volunteer Fire Department Station 1 (P). Display/hide their locations on the map
Churches in zip code 23881 include: Brandon Church (A), Salem Church (B), Church of All Nations (C), Swanns Point Church (D), Gravel Hill Church (E), Lebanon Church (F), Mercy Seat Church (G), Morning Star Church (H). Display/hide their locations on the map
Cemeteries: Wier Neck Cemetery (1), Swanns Point Plantation Cemetery (2), Salem Cemetery (3), Brandon Plantation Cemetery (4), Brandon Cemetery (5). Display/hide their locations on the map
Lakes, reservoirs, and swamps: Black Duck Gut (A), Sunken Meadow Pond (B), Gray Pond (C), Eastover Pond (D), Low Point Millpond (E), Sunken Meadow Lake (F), Cerneys Pond (G), Manns Pond (H). Display/hide their locations on the map
Streams, rivers, and creeks: Wards Creek (A), Sunken Meadow Creek (B), Spring Run (C), Spring Grove Swamp (D), Flowerdew Hundred Creek (E), Cross Creek (F), Brandon Gut (G), Bailey Branch (H). Display/hide their locations on the map
Size of family households: 407 2-persons, 106 3-persons, 133 4-persons, 13 5-persons, 17 7-or-more-persons
Size of nonfamily households: 281 1-person, 32 2-persons
245 married couples with children.
129 single-parent households (4 men, 125 women).
97.4% of residents of 23881 zip code speak English at home.
1.9% of residents speak Spanish at home (100% very well).
Foreign born population: 19 (0.8%) (100.0% of them are naturalized citizens)
This zip code:
0.8%
Whole state:
12.7%
83%France
29%African
22%American
12%English
4%Irish
2%German
Year of entry for the foreign-born population
02010 or later
02000 to 2009
171990 to 1999
58Before 1990
Housing units lacking complete plumbing facilities: 2.4% Housing units lacking complete kitchen facilities: 0.5%
75.6%Electricity
9.1%Fuel oil, kerosene, etc.
8.5%Bottled, tank, or LP gas
3.3%Wood
2.0%Utility gas
1.8%Other fuel
Population in 1990: 1,746. Population change in the 1990s: +2,726 (+156.1%).
Place of birth for U.S.-born residents:
This state: 1,732
Northeast: 160
Midwest: 43
South: 274
West: 25
52% of the 23881 zip code residents lived in the same house 5 years ago. Out of people who lived in different houses, 21% lived in this county. Out of people who lived in different counties, 50% lived in Virginia.
97% of the 23881 zip code residents lived in the same house 1 year ago. Out of people who lived in different houses, 123% moved from different county within same state.
Private vs. public school enrollment:
Students in private schools in grades 1 to 8 (elementary and middle school): 27
Here:
15.2%
Virginia:
13.2%
Students in private schools in grades 9 to 12 (high school):
Here:
0.0%
Virginia:
10.2%
Students in private undergraduate colleges:
Here:
0.0%
Virginia:
18.7%
Occupation by median earnings in the past 12 months ($)
110,052Transportation occupations
79,471Community and social service occupations
58,086Installation, maintenance, and repair occupations
45,678Education, training, and library occupations
40,414Construction and extraction occupations
38,780Material moving occupations
Companies with federal contracts located in this zip code:
PENINSULA BAPTIST ASSC (601 EASTOVER DR in SPRING GROVE, VA; small business)
$10,000 with Navy for Lease or Rental of Facilities -- Miscellaneous Buildings. Signed on 2005-01-18. Completion date: 2006-01-09.
UPPERBRANDON LLC (1802 UPPER BRANDON ROAD in SPRING GROVE, VA; small business) : $3,540 in 2 contractsin 2003
$8,850 with Army for Lodging - Hotel/Motel. Signed on 2003-02-03. Completion date: 2003-03-13.
-$5,310, same as above.Signed on 2003-03-17. Completion date: 2003-03-13.
Top industries in this zip code by the number of employees in 2005:
Other Services (except Public Administration): Religious Organizations (5-9 employees: 3 establishments, 1-4 employees: 2 establishments)
Real Estate and Rental and Leasing: Lessors of Nonresidential Buildings (except Miniwarehouses) (10-19: 1)
Administrative and Support and Waste Management and Remediation Services: Landscaping Services (5-9: 1)
Real Estate and Rental and Leasing: Lessors of Residential Buildings and Dwellings (1-4: 2)
Health Care and Social Assistance: Child Day Care Services (1-4: 2)
Information: Data Processing, Hosting, and Related Services (1-4: 1)
Construction: Painting and Wall Covering Contractors (1-4: 1)
People in group quarters in 2000:
1,525 people in federal prisons and detention centers
621 people in local jails and other confinement facilities (including police lockups)
Fatal accident statistics in 2013:
Fatal accident count: 1
Vehicles involved in fatal accidents: 1
Fatal accidents caused by drunken drivers: 0
Fatalities: 1
Persons involved in fatal accidents: 1
Pedestrians involved in fatal accidents: 0
Home Mortgage Disclosure Act Aggregated Statistics For Year 2009 (Based on 2 partial tracts)
A) FHA, FSA/RHS & VA Home Purchase Loans
B) Conventional Home Purchase Loans
C) Refinancings
D) Home Improvement Loans
F) Non-occupant Loans on < 5 Family Dwellings (A B C & D)
G) Loans On Manufactured Home Dwelling (A B C & D)
Number
Average Value
Number
Average Value
Number
Average Value
Number
Average Value
Number
Average Value
Number
Average Value
LOANS ORIGINATED
15
$226,512
15
$113,040
85
$194,546
6
$62,910
4
$191,295
6
$48,690
APPLICATIONS APPROVED, NOT ACCEPTED
0
$0
1
$15,660
6
$232,560
1
$148,500
0
$0
1
$16,740
APPLICATIONS DENIED
2
$177,660
2
$108,270
28
$215,749
5
$39,204
3
$85,320
2
$6,480
APPLICATIONS WITHDRAWN
4
$204,930
2
$181,710
18
$222,390
0
$0
1
$104,220
1
$12,960
FILES CLOSED FOR INCOMPLETENESS
1
$88,560
0
$0
6
$225,360
0
$0
1
$91,800
0
$0
Aggregated Statistics For Year 2008 (Based on 2 partial tracts)
A) FHA, FSA/RHS & VA Home Purchase Loans
B) Conventional Home Purchase Loans
C) Refinancings
D) Home Improvement Loans
F) Non-occupant Loans on < 5 Family Dwellings (A B C & D)
G) Loans On Manufactured Home Dwelling (A B C & D)
Number
Average Value
Number
Average Value
Number
Average Value
Number
Average Value
Number
Average Value
Number
Average Value
LOANS ORIGINATED
8
$212,152
12
$133,290
49
$167,995
14
$78,146
9
$90,540
3
$49,320
APPLICATIONS APPROVED, NOT ACCEPTED
0
$0
4
$98,415
7
$181,594
1
$186,300
0
$0
2
$43,200
APPLICATIONS DENIED
3
$203,940
2
$77,220
37
$169,983
11
$112,762
3
$124,380
3
$29,160
APPLICATIONS WITHDRAWN
1
$104,220
3
$219,060
13
$224,017
2
$104,760
1
$78,300
1
$51,840
FILES CLOSED FOR INCOMPLETENESS
0
$0
1
$132,840
3
$158,400
1
$5,940
1
$86,400
0
$0
Aggregated Statistics For Year 2007 (Based on 2 partial tracts)
A) FHA, FSA/RHS & VA Home Purchase Loans
B) Conventional Home Purchase Loans
C) Refinancings
D) Home Improvement Loans
F) Non-occupant Loans on < 5 Family Dwellings (A B C & D)
G) Loans On Manufactured Home Dwelling (A B C & D)
Number
Average Value
Number
Average Value
Number
Average Value
Number
Average Value
Number
Average Value
Number
Average Value
LOANS ORIGINATED
8
$198,180
37
$170,246
53
$170,263
16
$57,881
5
$204,228
6
$64,170
APPLICATIONS APPROVED, NOT ACCEPTED
0
$0
2
$162,540
10
$130,248
3
$30,240
0
$0
1
$16,200
APPLICATIONS DENIED
0
$0
3
$224,100
44
$148,721
9
$114,540
3
$156,960
2
$189,000
APPLICATIONS WITHDRAWN
0
$0
2
$148,770
26
$164,326
2
$62,910
1
$161,460
2
$71,280
FILES CLOSED FOR INCOMPLETENESS
1
$96,120
0
$0
5
$200,448
1
$67,500
0
$0
0
$0
Aggregated Statistics For Year 2006 (Based on 2 partial tracts)
A) FHA, FSA/RHS & VA Home Purchase Loans
B) Conventional Home Purchase Loans
C) Refinancings
D) Home Improvement Loans
F) Non-occupant Loans on < 5 Family Dwellings (A B C & D)
G) Loans On Manufactured Home Dwelling (A B C & D)
Number
Average Value
Number
Average Value
Number
Average Value
Number
Average Value
Number
Average Value
Number
Average Value
LOANS ORIGINATED
5
$271,620
33
$183,338
68
$132,236
10
$68,364
3
$81,000
2
$71,550
APPLICATIONS APPROVED, NOT ACCEPTED
0
$0
6
$173,520
12
$150,795
2
$109,890
1
$161,460
1
$154,980
APPLICATIONS DENIED
0
$0
8
$154,778
33
$135,949
8
$46,035
2
$87,210
1
$82,080
APPLICATIONS WITHDRAWN
1
$248,940
5
$143,964
39
$137,382
1
$6,480
2
$122,850
0
$0
FILES CLOSED FOR INCOMPLETENESS
0
$0
0
$0
8
$148,838
0
$0
1
$48,060
0
$0
Aggregated Statistics For Year 2005 (Based on 2 partial tracts)
A) FHA, FSA/RHS & VA Home Purchase Loans
B) Conventional Home Purchase Loans
C) Refinancings
D) Home Improvement Loans
F) Non-occupant Loans on < 5 Family Dwellings (A B C & D)
G) Loans On Manufactured Home Dwelling (A B C & D)
Number
Average Value
Number
Average Value
Number
Average Value
Number
Average Value
Number
Average Value
Number
Average Value
LOANS ORIGINATED
14
$186,994
31
$157,227
69
$134,890
8
$56,970
6
$117,990
1
$54,000
APPLICATIONS APPROVED, NOT ACCEPTED
0
$0
4
$165,105
14
$89,293
4
$32,130
2
$121,230
1
$7,020
APPLICATIONS DENIED
1
$104,760
11
$85,909
42
$112,719
3
$36,360
5
$95,904
3
$57,780
APPLICATIONS WITHDRAWN
0
$0
11
$116,296
33
$129,715
5
$147,096
1
$153,360
0
$0
FILES CLOSED FOR INCOMPLETENESS
0
$0
1
$117,720
5
$162,216
1
$30,240
2
$98,550
0
$0
Aggregated Statistics For Year 2004 (Based on 2 partial tracts)
A) FHA, FSA/RHS & VA Home Purchase Loans
B) Conventional Home Purchase Loans
C) Refinancings
D) Home Improvement Loans
F) Non-occupant Loans on < 5 Family Dwellings (A B C & D)
G) Loans On Manufactured Home Dwelling (A B C & D)
Number
Average Value
Number
Average Value
Number
Average Value
Number
Average Value
Number
Average Value
Number
Average Value
LOANS ORIGINATED
6
$156,420
30
$140,742
53
$105,758
9
$36,840
4
$165,645
4
$62,235
APPLICATIONS APPROVED, NOT ACCEPTED
0
$0
3
$160,560
9
$89,880
1
$86,400
0
$0
1
$10,260
APPLICATIONS DENIED
2
$145,530
15
$96,588
39
$106,878
6
$20,880
4
$71,820
7
$71,974
APPLICATIONS WITHDRAWN
0
$0
4
$132,300
20
$123,147
1
$48,600
1
$144,720
1
$59,400
FILES CLOSED FOR INCOMPLETENESS
0
$0
0
$0
8
$120,218
0
$0
0
$0
0
$0
Aggregated Statistics For Year 2003 (Based on 2 partial tracts)
A) FHA, FSA/RHS & VA Home Purchase Loans
B) Conventional Home Purchase Loans
C) Refinancings
D) Home Improvement Loans
F) Non-occupant Loans on < 5 Family Dwellings (A B C & D)
Detailed PMIC statistics for the following Tracts:8504.00
2002 - 2018 National Fire Incident Reporting System (NFIRS) incidents
According to the data from the years 2002 - 2018 the average number of fires per year is 9. The highest number of reported fires - 34 took place in 2010, and the least - 2 in 2002. The data has a rising trend.
When looking into fire subcategories, the most incidents belonged to: Outside Fires (59.9%), and Structure Fires (32.2%).
Fire incident types reported to NFIRS in Zip Code 23881


+$200
-$5,267
 Nearest zip codes: 23899, 23839, 23030, 23846, 23890, 23888.


 According to the data from the years 2002 - 2018 the average number of fires per year is 9. The highest number of reported fires - 34 took place in 2010, and the least - 2 in 2002. The data has a rising trend.
 When looking into fire subcategories, the most incidents belonged to: Outside Fires (59.9%), and Structure Fires (32.2%).