Estimated zip code population in 2022: 2,202 Zip code population in 2010: 2,592 Zip code population in 2000: 2,184
Houses and condos: 1,125 Renter-occupied apartments: 269
% of renters here:
30%
State:
33%
March 2022 cost of living index in zip code 23923: 84.2 (less than average, U.S. average is 100)
Land area: 88.7 sq. mi. Water area: 0.2 sq. mi.
Population density: 25 people per square mile
(very low).
OSM Map
General Map
Google Map
MSN Map
OSM Map
General Map
Google Map
MSN Map
OSM Map
General Map
Google Map
MSN Map
OSM Map
General Map
Google Map
MSN Map
Please wait while loading the map...
Real estate property taxes paid for housing units in 2022:
This zip code:
0.5% ($804)
Virginia:
0.7% ($2,617)
Median real estate property taxes paid for housing units with mortgages in 2022: $739 (0.4%) Median real estate property taxes paid for housing units with no mortgage in 2022: $860 (0.5%)
Business Search- 14 Million verified businesses
Males: 1,080
(49.1%)
Females: 1,122
(50.9%)
For population 25 years and over in 23923:
High school or higher: 87.8%
Bachelor's degree or higher: 24.2%
Graduate or professional degree: 13.5%
Unemployed: 0.5%
Mean travel time to work (commute): 29.2 minutes
For population 15 years and over in 23923:
Never married: 30.5%
Now married: 37.6%
Separated: 2.4%
Widowed: 12.7%
Divorced: 16.9%
Zip code 23923 compared to state average:
Median household income below state average.
Median house value below state average.
Unemployed percentage significantly below state average.
Median age above state average.
Foreign-born population percentage significantly below state average.
Length of stay since moving in significantly above state average.
Number of college students below state average.
Percentage of population with a bachelor's degree or higher below state average.
Estimated median house/condo value in 2022: $171,657
23923:
$171,657
Virginia:
$365,700
According to our research of Virginia and other state lists, there were 5 registered sex offenders living in 23923 zip code as of May 28, 2024. The ratio of all residents to sex offenders in zip code 23923 is 487 to 1. The ratio of registered sex offenders to all residents in this zip code is lower than the state average.
Median resident age:
This zip code:
44.4 years
Virginia median age:
39.0 years
Average household size:
This zip code:
2.4 people
Virginia:
2.5 people
Averages for the 2020 tax year for zip code 23923, filed in 2021:
Average Adjusted Gross Income (AGI) in 2020: $45,719 (Individual Income Tax Returns)
Here:
$45,719
State:
$86,446
Salary/wage: $39,322 (reported on 75.5% of returns)
Here:
$39,322
State:
$71,185
(% of AGI for various income ranges: 1118.2% for AGIs below $25k, 3715.0% for AGIs $25k-50k, 6588.8% for AGIs $50k-75k, 7850.0% for AGIs $75k-100k, 17112.0% for AGIs $100k-200k)
Taxable interest for individuals: $771 (reported on 24.5% of returns)
This zip code:
$771
Virginia:
$1,805
(% of AGI for various income ranges: 8.9% for AGIs below $25k, 10.5% for AGIs $25k-50k, 20.0% for AGIs $50k-75k, 40.0% for AGIs $75k-100k, 198.0% for AGIs $100k-200k)
Ordinary dividends: $2,981 (reported on 16.3% of returns)
Here:
$2,981
State:
$8,327
(% of AGI for various income ranges: 13.2% for AGIs below $25k, 20.5% for AGIs $25k-50k, 61.3% for AGIs $50k-75k, 190.0% for AGIs $75k-100k, 472.0% for AGIs $100k-200k)
Net capital gain/loss in AGI: +$6,660 (reported on 10.2% of returns)
Here:
+$6,660
State:
+$24,644
(% of AGI for various income ranges: 24.6% for AGIs below $25k, 10.0% for AGIs $25k-50k, 120.0% for AGIs $50k-75k, 962.0% for AGIs $100k-200k)
Profit/loss from business: +$9,139 (reported on 18.4% of returns)
Here:
+$9,139
State:
+$12,836
(% of AGI for various income ranges: 179.3% for AGIs below $25k, 276.0% for AGIs $25k-50k, 418.8% for AGIs $50k-75k, 426.7% for AGIs $75k-100k)
Taxable individual retirement arrangement distribution: $13,833 (reported on 9.2% of returns)
23923:
$13,833
Virginia:
$21,535
(% of AGI for various income ranges: 84.3% for AGIs below $25k, 185.5% for AGIs $25k-50k, 1063.3% for AGIs $75k-100k)
Total itemized deductions: $25,833 (reported on 3.1% of returns)
Here:
$25,833
State:
$33,287
(% of AGI for various income ranges: 968.8% for AGIs $50k-75k)
Charity contributions: $12,650 (reported on 2.0% of returns)
Here:
$12,650
State:
$10,381
(% of AGI for various income ranges: 90.4% for AGIs below $25k)
Taxes paid: $5,400 (reported on 3.1% of returns)
23923:
$5,400
State:
$8,284
(% of AGI for various income ranges: 202.5% for AGIs $50k-75k)
Earned income credit: $2,443 (reported on 23.5% of returns)
Here:
$2,443
State:
$2,214
(% of AGI for various income ranges: 137.5% for AGIs below $25k, 88.5% for AGIs $25k-50k)
Percentage of individuals using paid preparers for their 2020 taxes: 92.9%
Here:
93%
State:
92%
(% for various income ranges: 92.5% for AGIs below $25k, 96.3% for AGIs $25k-50k, 92.3% for AGIs $50k-75k, 87.5% for AGIs $75k-100k, 90.0% for AGIs $100k-200k)
Averages for the 2012 tax year for zip code 23923, filed in 2013:
Average Adjusted Gross Income (AGI) in 2012: $37,077 (Individual Income Tax Returns)
Here:
$37,077
State:
$71,192
Salary/wage: $32,915 (reported on 78.3% of returns)
Here:
$32,915
State:
$59,229
(% of AGI for various income ranges: 71.1% for AGIs below $25k, 74.3% for AGIs $25k-50k, 70.3% for AGIs $50k-75k, 69.6% for AGIs $75k-100k, 61.7% for AGIs $100k-200k)
Taxable interest for individuals: $744 (reported on 29.3% of returns)
This zip code:
$744
Virginia:
$1,600
(% of AGI for various income ranges: 1.3% for AGIs below $25k, 0.4% for AGIs $25k-50k, 0.2% for AGIs $50k-75k, 0.4% for AGIs $75k-100k, 0.7% for AGIs $100k-200k)
Ordinary dividends: $2,800 (reported on 15.2% of returns)
Here:
$2,800
State:
$6,959
(% of AGI for various income ranges: 0.9% for AGIs below $25k, 0.6% for AGIs $25k-50k, 1.4% for AGIs $50k-75k, 2.2% for AGIs $100k-200k)
Net capital gain/loss in AGI: +$3,183 (reported on 13.0% of returns)
Here:
+$3,183
State:
+$16,672
(% of AGI for various income ranges: 1.4% for AGIs $25k-50k, 0.7% for AGIs $50k-75k, 2.8% for AGIs $100k-200k)
Profit/loss from business: +$9,733 (reported on 16.3% of returns)
Here:
+$9,733
State:
+$14,116
(% of AGI for various income ranges: 7.7% for AGIs below $25k, 7.0% for AGIs $25k-50k, 9.2% for AGIs $75k-100k)
Taxable individual retirement arrangement distribution: $8,800 (reported on 9.8% of returns)
23923:
$8,800
Virginia:
$16,667
(% of AGI for various income ranges: 2.8% for AGIs below $25k, 4.2% for AGIs $25k-50k, 5.9% for AGIs $75k-100k)
Total itemized deductions: $20,522 (28% of AGI, reported on 19.6% of returns)
Here:
$20,522
State:
$26,596
Here:
28.2% of AGI
State:
20.1% of AGI
(% of AGI for various income ranges: 12.1% for AGIs $25k-50k, 13.7% for AGIs $50k-75k, 11.7% for AGIs $75k-100k, 13.9% for AGIs $100k-200k)
Charity contributions: $4,571 (reported on 15.2% of returns)
Here:
$4,571
State:
$4,443
(% of AGI for various income ranges: 1.5% for AGIs $25k-50k, 3.4% for AGIs $50k-75k, 3.3% for AGIs $100k-200k)
Taxes paid: $4,578 (reported on 19.6% of returns)
23923:
$4,578
State:
$9,951
(% of AGI for various income ranges: 1.5% for AGIs $25k-50k, 2.7% for AGIs $50k-75k, 3.3% for AGIs $75k-100k, 4.5% for AGIs $100k-200k)
Earned income credit: $2,233 (reported on 26.1% of returns)
Here:
$2,233
State:
$2,211
(% of AGI for various income ranges: 7.1% for AGIs below $25k, 1.5% for AGIs $25k-50k)
Percentage of individuals using paid preparers for their 2012 taxes: 64.1%
Here:
64%
State:
46%
(% for various income ranges: 59.5% for AGIs below $25k, 66.7% for AGIs $25k-50k, 75.0% for AGIs $50k-75k, 60.0% for AGIs $75k-100k, 66.7% for AGIs $100k-200k)
Averages for the 2004 tax year for zip code 23923, filed in 2005:
Average Adjusted Gross Income (AGI) in 2004: $32,020 (Individual Income Tax Returns)
Here:
$32,020
State:
$56,704
Salary/wage: $28,891 (reported on 81.6% of returns)
Here:
$28,891
State:
$48,441
(% of AGI for various income ranges: 123.8% for AGIs below $10k, 72.3% for AGIs $10k-25k, 79.5% for AGIs $25k-50k, 77.9% for AGIs $50k-75k, 71.5% for AGIs $75k-100k, 47.8% for AGIs over 100k)
Taxable interest for individuals: $1,803 (reported on 36.7% of returns)
This zip code:
$1,803
Virginia:
$1,688
(% of AGI for various income ranges: 11.2% for AGIs below $10k, 2.6% for AGIs $10k-25k, 1.5% for AGIs $25k-50k, 2.4% for AGIs $50k-75k, 1.4% for AGIs $75k-100k, 1.3% for AGIs over 100k)
Taxable dividends: $2,514 (reported on 16.2% of returns)
Here:
$2,514
State:
$4,028
(% of AGI for various income ranges: 10.1% for AGIs below $10k, 0.8% for AGIs $10k-25k, 0.5% for AGIs $25k-50k, 1.3% for AGIs $50k-75k, 0.8% for AGIs $75k-100k, 2.7% for AGIs over 100k)
Net capital gain/loss: +$4,772 (reported on 12.5% of returns)
Here:
+$4,772
State:
+$14,375
(% of AGI for various income ranges: -5.1% for AGIs below $10k, 0.7% for AGIs $10k-25k, 1.0% for AGIs $25k-50k, 1.7% for AGIs $50k-75k, 8.8% for AGIs over 100k)
Profit/loss from business: +$5,961 (reported on 14.1% of returns)
Here:
+$5,961
State:
+$13,342
(% of AGI for various income ranges: -8.7% for AGIs below $10k, 5.2% for AGIs $10k-25k, 1.3% for AGIs $25k-50k, 3.0% for AGIs $50k-75k, 6.2% for AGIs $75k-100k)
IRA payment deduction: $3,692 (reported on 1.4% of returns)
23923:
$3,692
Virginia:
$2,943
Total itemized deductions: $15,980 (27% of AGI, reported on 22.4% of returns)
Here:
$15,980
State:
$21,492
Here:
26.7% of AGI
State:
21.0% of AGI
(% of AGI for various income ranges: 12.4% for AGIs $10k-25k, 9.3% for AGIs $25k-50k, 11.1% for AGIs $50k-75k, 14.5% for AGIs $75k-100k, 12.5% for AGIs over 100k)
Charity contributions deductions: $3,313 (6% of AGI, reported on 18.2% of returns)
Here:
$3,313
State:
$3,794
Here:
5.5% of AGI
State:
3.5% of AGI
(% of AGI for various income ranges: 1.1% for AGIs $10k-25k, 1.2% for AGIs $25k-50k, 2.3% for AGIs $50k-75k, 3.1% for AGIs $75k-100k, 2.7% for AGIs over 100k)
Total tax: $3,754 (reported on 66.7% of returns)
23923:
$3,754
State:
$9,537
(% of AGI for various income ranges: 2.8% for AGIs below $10k, 3.4% for AGIs $10k-25k, 5.7% for AGIs $25k-50k, 8.0% for AGIs $50k-75k, 10.1% for AGIs $75k-100k, 16.4% for AGIs over 100k)
Earned income credit: $1,720 (reported on 23.4% of returns)
Here:
$1,720
State:
$1,734
Percentage of individuals using paid preparers for their 2004 taxes: 69.5%
Here:
69%
State:
52%
(% for various income ranges: 66.2% for AGIs below $10k, 69.8% for AGIs $10k-25k, 68.8% for AGIs $25k-50k, 71.8% for AGIs $50k-75k, 72.0% for AGIs $75k-100k, 86.4% for AGIs over 100k)
Household received Food Stamps/SNAP in the past 12 months: 262 Household did not receive Food Stamps/SNAP in the past 12 months: 652
Women who had a birth in the past 12 months: 24 (18 now married, 5 unmarried) Women who did not have a birth in the past 12 months: 399 (155 now married, 244 unmarried)
Housing units in zip code 23923 with a mortgage: 245 (17 second mortgage, 1 home equity loan, 16 both second mortgage and home equity loan) Houses without a mortgage: 32
Median monthly owner costs for units with a mortgage: $1,105 Median monthly owner costs for units without a mortgage: $336
Residents with income below the poverty level in 2022:
This zip code:
33.2%
Whole state:
10.6%
Residents with income below 50% of the poverty level in 2022:
This zip code:
13.5%
Whole state:
5.2%
Median number of rooms in houses and condos:
Here:
6.4
State:
7.0
Median number of rooms in apartments:
Here:
4.7
State:
4.3
Notable locations in this zip code not listed on our city pages
Notable locations in zip code 23923: Greenfield Plantation (A), Virginia Polytechnic Institute Experimental Farm (B), Charlotte County Courthouse (C). Display/hide their locations on the map
Churches in zip code 23923 include: Roanoke Church (A), Bethlehem Church (B), Saint Douglas Church (C), Saint Louis Church (D), Cetenary Church (E), Concord Church (F), Village Church (G), Charlotte Court House United Methodist Church (H), Morrison Grove Church (I). Display/hide their locations on the map
Reservoirs: Roanoke Creek Site 43a Lake (A), Roanoke Creek Site 54 Lake (B), Roanoke Creek Site 35-A Lake (C), Lake Gayle (D), Roanoke Creek Site 4a Lake (E). Display/hide their locations on the map
Streams, rivers, and creeks: Terrys Creek (A), Spring Creek (B), Sandy Creek (C), Roaches Branch (D), Middle Branch Wards Fork Creek (E), Hills Creek (F), Flintoy Creek (G), East Branch Wards Fork Creek (H), Coldwater Creek (I). Display/hide their locations on the map
In group quarters: 61 (-1 institutionalized population)
Size of family households: 310 2-persons, 91 3-persons, 79 4-persons, 24 5-persons, 48 6-persons
Size of nonfamily households: 294 1-person, 42 2-persons, 2 4-persons
255 married couples with children.
258 single-parent households (26 men, 232 women).
97.3% of residents of 23923 zip code speak English at home.
0.4% of residents speak Spanish at home (100% very well).
1.5% of residents speak other Indo-European language at home (73% very well, 9% well, 18% not well).
0.5% of residents speak Asian or Pacific Island language at home (36% very well, 36% well, 27% not well).
Foreign born population: 36 (1.6%) (100.0% of them are naturalized citizens)
This zip code:
1.6%
Whole state:
12.7%
26%Sweden
26%United Kingdom, excluding England and Scotland
21%Grenada
18%Japan
12%Singapore
9%Thailand
33%American
10%English
6%European
3%German
2%Irish
1%African
1%Italian
Year of entry for the foreign-born population
42010 or later
92000 to 2009
31990 to 1999
15Before 1990
Facilities with environmental interests located in this zip code:
CHARLOTTE COUNTY SCHOOLS JEFFRESS ELEMENTARY (STATE ROUTE 40 in CHARLOTTE COURTHOUSE, VA)
AIR MINOR (AIRS/AFS) STATE MASTER (Virginia pollutants databases) - CEDS-30344, AIR PROGRAM National Pollutant Discharge Elimination System NON-MAJOR (Tracking pollutant discharge elimination systems) - permit Business SIC and NAICS classification: ELEMENTARY AND SECONDARY SCHOOLS Alternative names: J MURRY JEFFRESS ELEMENTARY SC
CHARLOTTE COUNTY SCHOOLS CENTRAL ELEMENTARY (STATE ROUTE 40 in CHARLOTTE COURT HOUSE, VA)
AIR MINOR (AIRS/AFS) STATE MASTER (Virginia pollutants databases) - CEDS-30341, AIR PROGRAM Business SIC and NAICS classification: ELEMENTARY AND SECONDARY SCHOOLS
CHARLOTTE COUNTY SCHOOLS CENTRAL MIDDLE SCHOOL (STATE ROUTE 40 in CHARLOTTE COURT HOUSE, VA)
AIR MINOR (AIRS/AFS) STATE MASTER (Virginia pollutants databases) - CEDS-30342, AIR PROGRAM Business SIC and NAICS classification: ELEMENTARY AND SECONDARY SCHOOLS Alternative names: CHARLOTTE COUNTY SCHOOLS CENTRAL JR HIGH
CHARLOTTE COUNTY SCHOOLS CHARLOTTE ELEM (RT 40 in CHARLOTTE COURT HOUSE, VA)
AIR MINOR (AIRS/AFS) STATE MASTER (Virginia pollutants databases) - CEDS-30346, AIR PROGRAM Business SIC and NAICS classification: ELEMENTARY AND SECONDARY SCHOOLS
CHARLOTTE COUNTY SCHOOLS RANDOLPH HENRY HIGH (STATE ROUTE 40 in CHARLOTTE COURT HOUSE, VA)
AIR MINOR (AIRS/AFS) STATE MASTER (Virginia pollutants databases) - CEDS-30345, AIR PROGRAM Business SIC and NAICS classification: ELEMENTARY AND SECONDARY SCHOOLS Alternative names: CHARLOTTE COUNTY RANDOLPH HENRY HIGH
CENTRAL MIDDLE (250 STATESMAN DR in CHARLOTTE COURT HOUSE, VA)
(National Center for Education Statistics) - STATE ID-0200210 Organizations: CHARLOTTE COUNTY PUBLIC SCHOOLS (SCHOOL DISTRICT)
CHARLOTTE COUNTY SCHOOL DISTRICT (HIGHWAY 47 SOUTH in CHARLOTTE COURT HOUSE, VA)
COMPLIANCE ACTIVITY (Tracking inspections of insecticide, fungicide, and rodenticide, and toxic substances)
Housing units lacking complete plumbing facilities: 1.2% Housing units lacking complete kitchen facilities: 0.3%
59.0%Electricity
12.8%Bottled, tank, or LP gas
9.6%Fuel oil, kerosene, etc.
9.3%Wood
4.6%Utility gas
3.6%Solar energy
1.3%Other fuel
Population in 1990: 2,061. Population change in the 1990s: +123 (+6.0%).
Place of birth for U.S.-born residents:
This state: 1,527
Northeast: 191
Midwest: 62
South: 338
West: 37
69% of the 23923 zip code residents lived in the same house 5 years ago. Out of people who lived in different houses, 43% lived in this county. Out of people who lived in different counties, 50% lived in Virginia.
96% of the 23923 zip code residents lived in the same house 1 year ago. Out of people who lived in different houses, 48% moved from this county. Out of people who lived in different houses, 49% moved from different county within same state. Out of people who lived in different houses, 10% moved from different state.
Private vs. public school enrollment:
Students in private schools in grades 1 to 8 (elementary and middle school): 20
Here:
9.9%
Virginia:
13.2%
Students in private schools in grades 9 to 12 (high school): 53
Here:
23.9%
Virginia:
10.2%
Students in private undergraduate colleges: 15
Here:
30.4%
Virginia:
18.7%
Occupation by median earnings in the past 12 months ($)
95,756Production occupations
69,285Law enforcement workers including supervisors
62,416Fire fighting and prevention, and other protective service workers including supervisors
45,067Education, training, and library occupations
42,751Management occupations
38,117Material moving occupations
Companies with federal contracts located in this zip code:
TIMBERLINE TREE & LANDSCAPING (1481 JUNCTION CANAL ROAD in CHARLOTTE CH, VA; small business) : $3,628,548 in 69 contractsfrom 2000 to 2006
Contracts for Landscaping/Groundskeeping Services, Tree Breeding Services by Army Signed by year:2000: $65,000; 2001: $30,000; 2002: $0; 2003: $1,148,405; 2004: $1,496,865; 2005: $512,744; 2006: $375,534.
Biggest contracts:
$608,445 with Army for Landscaping/Groundskeeping Services. Signed on 2003-12-23. Completion date: 2004-01-20.
$550,000 with Army for Tree Breeding Services. Signed on 2004-09-14. Completion date: 2005-03-31.
$373,390, same as above.Signed on 2004-07-12. Completion date: 2005-03-31.
$373,350, same as above.Signed on 2006-03-08. Completion date: 2005-03-31.
Top industries in this zip code by the number of employees in 2005:
Health Care and Social Assistance: Services for the Elderly and Persons with Disabilities (20-49 employees: 2 establishments)
Health Care and Social Assistance: All Other Outpatient Care Centers (20-49: 1)
Other Services (except Public Administration): Industrial Launderers (20-49: 1)
Accommodation and Food Services: Full-Service Restaurants (10-19: 1, 5-9: 1)
Administrative and Support and Waste Management and Remediation Services: Landscaping Services (5-9: 1, 1-4: 1)
People in group quarters in 2010:
83 people in local jails and other municipal confinement facilities
People in group quarters in 2000:
51 people in local jails and other confinement facilities (including police lockups)
10 people in agriculture workers' dormitories on farms
Fatal accident statistics in 2011:
Fatal accident count: 1
Vehicles involved in fatal accidents: 1
Fatal accidents caused by drunken drivers: 1
Fatalities: 2
Persons involved in fatal accidents: 2
Pedestrians involved in fatal accidents: 0
Fatal accident statistics in 2010:
Fatal accident count: 1
Vehicles involved in fatal accidents: 1
Fatal accidents caused by drunken drivers: 0
Fatalities: 1
Persons involved in fatal accidents: 1
Pedestrians involved in fatal accidents: 1
2002 - 2018 National Fire Incident Reporting System (NFIRS) incidents
According to the data from the years 2002 - 2018 the average number of fires per year is 10. The highest number of fire incidents - 19 took place in 2007, and the least - 0 in 2015. The data has a declining trend.
When looking into fire subcategories, the most reports belonged to: Structure Fires (54.6%), and Outside Fires (34.4%).
Fire incident types reported to NFIRS in Zip Code 23923

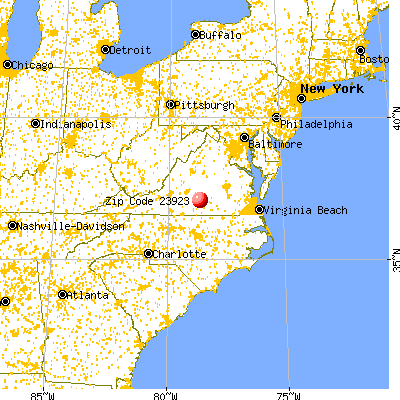


 Nearest zip codes: 23934, 23962, 23959, 23967, 23958, 23963.


 According to the data from the years 2002 - 2018 the average number of fires per year is 10. The highest number of fire incidents - 19 took place in 2007, and the least - 0 in 2015. The data has a declining trend.
 When looking into fire subcategories, the most reports belonged to: Structure Fires (54.6%), and Outside Fires (34.4%).