Estimated zip code population in 2022: 3,806 Zip code population in 2010: 4,261 Zip code population in 2000: 4,321
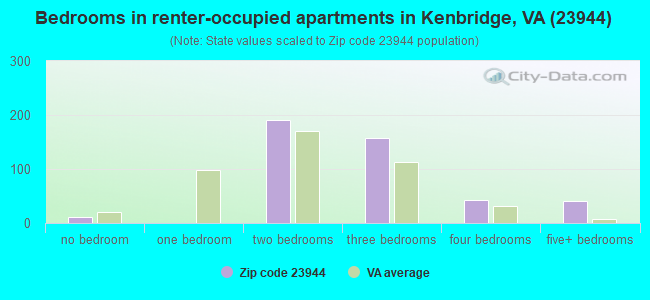
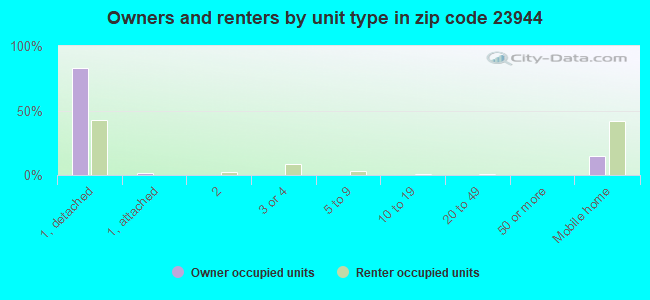
Houses and condos: 1,997 Renter-occupied apartments: 446
% of renters here:
31%
State:
33%
March 2022 cost of living index in zip code 23944: 83.2 (low, U.S. average is 100)
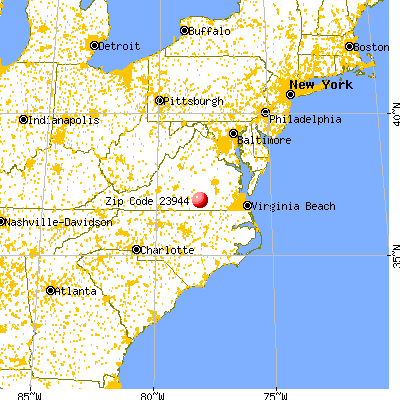
Land area: 140.1 sq. mi. Water area: 0.2 sq. mi.
Population density: 27 people per square mile
(very low).
OSM Map
General Map
Google Map
MSN Map
OSM Map
General Map
Google Map
MSN Map
OSM Map
General Map
Google Map
MSN Map
OSM Map
General Map
Google Map
MSN Map
Please wait while loading the map...
Real estate property taxes paid for housing units in 2022:
This zip code:
0.6% ($716)
Virginia:
0.7% ($2,617)
Median real estate property taxes paid for housing units with mortgages in 2022: $807 (0.7%) Median real estate property taxes paid for housing units with no mortgage in 2022: $609 (0.5%)
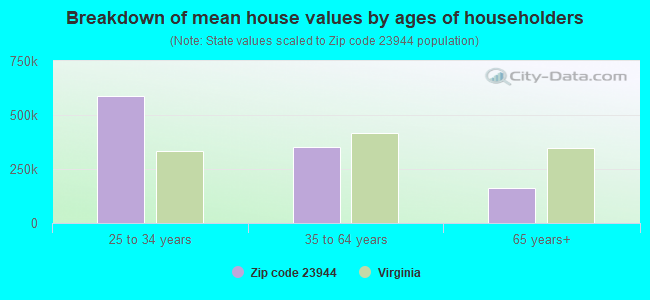
Estimated median house/condo value in 2022: $122,043
23944:
$122,043
Virginia:
$365,700
According to our research of Virginia and other state lists, there were 13 registered sex offenders living in 23944 zip code as of May 28, 2024. The ratio of all residents to sex offenders in zip code 23944 is 310 to 1. The ratio of registered sex offenders to all residents in this zip code is near the state average.
Median resident age:
This zip code:
38.7 years
Virginia median age:
39.0 years
Average household size:
This zip code:
2.6 people
Virginia:
2.5 people
Averages for the 2020 tax year for zip code 23944, filed in 2021:
Average Adjusted Gross Income (AGI) in 2020: $51,139 (Individual Income Tax Returns)
Here:
$51,139
State:
$86,446
Salary/wage: $42,959 (reported on 80.1% of returns)
Here:
$42,959
State:
$71,185
(% of AGI for various income ranges: 1374.4% for AGIs below $25k, 3783.7% for AGIs $25k-50k, 6794.4% for AGIs $50k-75k, 9324.4% for AGIs $75k-100k, 17073.8% for AGIs $100k-200k)
Taxable interest for individuals: $1,163 (reported on 26.9% of returns)
This zip code:
$1,163
Virginia:
$1,805
(% of AGI for various income ranges: 6.7% for AGIs below $25k, 10.3% for AGIs $25k-50k, 75.6% for AGIs $50k-75k, 38.9% for AGIs $75k-100k, 158.8% for AGIs $100k-200k)
Ordinary dividends: $7,537 (reported on 15.8% of returns)
Here:
$7,537
State:
$8,327
(% of AGI for various income ranges: 27.7% for AGIs below $25k, 18.7% for AGIs $25k-50k, 150.6% for AGIs $50k-75k, 262.2% for AGIs $75k-100k, 837.5% for AGIs $100k-200k)
Net capital gain/loss in AGI: +$11,443 (reported on 12.3% of returns)
Here:
+$11,443
State:
+$24,644
(% of AGI for various income ranges: 4.7% for AGIs below $25k, 28.2% for AGIs $25k-50k, 108.7% for AGIs $50k-75k, 142.2% for AGIs $75k-100k, 1106.2% for AGIs $100k-200k)
Profit/loss from business: +$6,519 (reported on 15.2% of returns)
Here:
+$6,519
State:
+$12,836
(% of AGI for various income ranges: 95.1% for AGIs below $25k, 132.9% for AGIs $25k-50k, 215.0% for AGIs $50k-75k, 546.2% for AGIs $100k-200k)
Taxable individual retirement arrangement distribution: $11,986 (reported on 8.2% of returns)
23944:
$11,986
Virginia:
$21,535
(% of AGI for various income ranges: 39.3% for AGIs below $25k, 56.8% for AGIs $25k-50k, 134.4% for AGIs $50k-75k, 382.2% for AGIs $75k-100k, 917.5% for AGIs $100k-200k)
Total itemized deductions: $37,375 (reported on 4.7% of returns)
Here:
$37,375
State:
$33,287
(% of AGI for various income ranges: 733.1% for AGIs $50k-75k, 2271.2% for AGIs $100k-200k)
Charity contributions: $13,675 (reported on 4.7% of returns)
Here:
$13,675
State:
$10,381
(% of AGI for various income ranges: 180.6% for AGIs $50k-75k, 1006.2% for AGIs $100k-200k)
Taxes paid: $6,375 (reported on 4.7% of returns)
23944:
$6,375
State:
$8,284
(% of AGI for various income ranges: 104.4% for AGIs $50k-75k, 428.7% for AGIs $100k-200k)
Earned income credit: $2,361 (reported on 22.2% of returns)
Here:
$2,361
State:
$2,214
(% of AGI for various income ranges: 127.7% for AGIs below $25k, 91.6% for AGIs $25k-50k)
Percentage of individuals using paid preparers for their 2020 taxes: 87.7%
Here:
88%
State:
92%
(% for various income ranges: 87.1% for AGIs below $25k, 90.2% for AGIs $25k-50k, 92.0% for AGIs $50k-75k, 78.6% for AGIs $75k-100k, 86.7% for AGIs $100k-200k, 75.0% for AGIs over 200k)
Averages for the 2012 tax year for zip code 23944, filed in 2013:
Average Adjusted Gross Income (AGI) in 2012: $38,741 (Individual Income Tax Returns)
Here:
$38,741
State:
$71,192
Salary/wage: $32,616 (reported on 85.5% of returns)
Here:
$32,616
State:
$59,229
(% of AGI for various income ranges: 82.0% for AGIs below $25k, 77.1% for AGIs $25k-50k, 73.0% for AGIs $50k-75k, 72.2% for AGIs $75k-100k, 58.2% for AGIs $100k-200k)
Taxable interest for individuals: $1,408 (reported on 30.1% of returns)
This zip code:
$1,408
Virginia:
$1,600
(% of AGI for various income ranges: 1.1% for AGIs below $25k, 1.1% for AGIs $25k-50k, 1.2% for AGIs $50k-75k, 1.0% for AGIs $75k-100k, 1.1% for AGIs $100k-200k)
Ordinary dividends: $4,412 (reported on 15.0% of returns)
Here:
$4,412
State:
$6,959
(% of AGI for various income ranges: 0.5% for AGIs below $25k, 0.9% for AGIs $25k-50k, 1.0% for AGIs $50k-75k, 2.4% for AGIs $75k-100k, 3.7% for AGIs $100k-200k)
Net capital gain/loss in AGI: +$4,748 (reported on 12.1% of returns)
Here:
+$4,748
State:
+$16,672
(% of AGI for various income ranges: 0.3% for AGIs below $25k, 0.9% for AGIs $25k-50k, 1.3% for AGIs $50k-75k, 1.3% for AGIs $75k-100k, 3.2% for AGIs $100k-200k)
Profit/loss from business: +$7,343 (reported on 12.1% of returns)
Here:
+$7,343
State:
+$14,116
(% of AGI for various income ranges: 4.1% for AGIs below $25k, 1.9% for AGIs $25k-50k, 4.2% for AGIs $50k-75k, 1.3% for AGIs $100k-200k)
Taxable individual retirement arrangement distribution: $12,129 (reported on 8.1% of returns)
23944:
$12,129
Virginia:
$16,667
(% of AGI for various income ranges: 2.2% for AGIs below $25k, 1.8% for AGIs $25k-50k, 3.2% for AGIs $50k-75k, 4.6% for AGIs $100k-200k)
Total itemized deductions: $19,192 (26% of AGI, reported on 21.4% of returns)
Here:
$19,192
State:
$26,596
Here:
25.9% of AGI
State:
20.1% of AGI
(% of AGI for various income ranges: 5.3% for AGIs below $25k, 8.1% for AGIs $25k-50k, 11.9% for AGIs $50k-75k, 12.3% for AGIs $75k-100k, 15.0% for AGIs $100k-200k)
Charity contributions: $4,421 (reported on 16.2% of returns)
Here:
$4,421
State:
$4,443
(% of AGI for various income ranges: 0.4% for AGIs below $25k, 1.2% for AGIs $25k-50k, 1.7% for AGIs $50k-75k, 2.0% for AGIs $75k-100k, 3.7% for AGIs $100k-200k)
Taxes paid: $4,606 (reported on 20.8% of returns)
23944:
$4,606
State:
$9,951
(% of AGI for various income ranges: 0.5% for AGIs below $25k, 1.3% for AGIs $25k-50k, 2.5% for AGIs $50k-75k, 3.0% for AGIs $75k-100k, 4.9% for AGIs $100k-200k)
Earned income credit: $2,372 (reported on 26.6% of returns)
Here:
$2,372
State:
$2,211
(% of AGI for various income ranges: 7.3% for AGIs below $25k, 1.5% for AGIs $25k-50k)
Percentage of individuals using paid preparers for their 2012 taxes: 61.3%
Here:
61%
State:
46%
(% for various income ranges: 60.5% for AGIs below $25k, 59.2% for AGIs $25k-50k, 61.9% for AGIs $50k-75k, 66.7% for AGIs $75k-100k, 70.0% for AGIs $100k-200k)
Averages for the 2004 tax year for zip code 23944, filed in 2005:
Average Adjusted Gross Income (AGI) in 2004: $35,292 (Individual Income Tax Returns)
Here:
$35,292
State:
$56,704
Salary/wage: $29,756 (reported on 84.7% of returns)
Here:
$29,756
State:
$48,441
(% of AGI for various income ranges: 111.2% for AGIs below $10k, 80.6% for AGIs $10k-25k, 79.8% for AGIs $25k-50k, 78.2% for AGIs $50k-75k, 78.9% for AGIs $75k-100k, 44.0% for AGIs over 100k)
Taxable interest for individuals: $1,969 (reported on 34.8% of returns)
This zip code:
$1,969
Virginia:
$1,688
(% of AGI for various income ranges: 5.4% for AGIs below $10k, 2.0% for AGIs $10k-25k, 1.6% for AGIs $25k-50k, 1.5% for AGIs $50k-75k, 1.7% for AGIs $75k-100k, 2.5% for AGIs over 100k)
Taxable dividends: $3,337 (reported on 20.4% of returns)
Here:
$3,337
State:
$4,028
(% of AGI for various income ranges: 5.7% for AGIs below $10k, 1.4% for AGIs $10k-25k, 1.0% for AGIs $25k-50k, 1.4% for AGIs $50k-75k, 1.7% for AGIs $75k-100k, 3.4% for AGIs over 100k)
Net capital gain/loss: +$8,762 (reported on 14.6% of returns)
Here:
+$8,762
State:
+$14,375
(% of AGI for various income ranges: -1.1% for AGIs below $10k, 0.7% for AGIs $10k-25k, 1.8% for AGIs $25k-50k, 1.2% for AGIs $50k-75k, 1.7% for AGIs $75k-100k, 10.8% for AGIs over 100k)
Profit/loss from business: +$7,657 (reported on 12.0% of returns)
Here:
+$7,657
State:
+$13,342
(% of AGI for various income ranges: 3.7% for AGIs below $10k, 2.3% for AGIs $10k-25k, 2.8% for AGIs $25k-50k, 2.7% for AGIs $50k-75k, -0.1% for AGIs $75k-100k, 3.5% for AGIs over 100k)
IRA payment deduction: $3,136 (reported on 1.3% of returns)
23944:
$3,136
Virginia:
$2,943
Total itemized deductions: $16,647 (21% of AGI, reported on 20.0% of returns)
Here:
$16,647
State:
$21,492
Here:
21.2% of AGI
State:
21.0% of AGI
(% of AGI for various income ranges: 5.5% for AGIs $10k-25k, 8.5% for AGIs $25k-50k, 11.6% for AGIs $50k-75k, 12.7% for AGIs $75k-100k, 10.6% for AGIs over 100k)
Charity contributions deductions: $3,591 (4% of AGI, reported on 17.8% of returns)
Here:
$3,591
State:
$3,794
Here:
4.4% of AGI
State:
3.5% of AGI
(% of AGI for various income ranges: 1.0% for AGIs $10k-25k, 1.4% for AGIs $25k-50k, 1.9% for AGIs $50k-75k, 2.0% for AGIs $75k-100k, 2.8% for AGIs over 100k)
Total tax: $5,112 (reported on 68.5% of returns)
23944:
$5,112
State:
$9,537
(% of AGI for various income ranges: 2.4% for AGIs below $10k, 3.0% for AGIs $10k-25k, 6.5% for AGIs $25k-50k, 8.8% for AGIs $50k-75k, 9.8% for AGIs $75k-100k, 19.7% for AGIs over 100k)
Earned income credit: $1,835 (reported on 26.1% of returns)
Here:
$1,835
State:
$1,734
Percentage of individuals using paid preparers for their 2004 taxes: 70.4%
Here:
70%
State:
52%
(% for various income ranges: 72.9% for AGIs below $10k, 71.6% for AGIs $10k-25k, 67.1% for AGIs $25k-50k, 66.5% for AGIs $50k-75k, 68.5% for AGIs $75k-100k, 82.9% for AGIs over 100k)
Household received Food Stamps/SNAP in the past 12 months: 335 Household did not receive Food Stamps/SNAP in the past 12 months: 1,156
Women who had a birth in the past 12 months: 22 (22 now married, 0 unmarried) Women who did not have a birth in the past 12 months: 770 (319 now married, 451 unmarried)
Housing units in zip code 23944 with a mortgage: 480 (68 second mortgage, 52 both second mortgage and home equity loan) Houses without a mortgage: 22
Median monthly owner costs for units with a mortgage: $1,285 Median monthly owner costs for units without a mortgage: $379
Residents with income below the poverty level in 2022:
This zip code:
13.2%
Whole state:
10.6%
Residents with income below 50% of the poverty level in 2022:
This zip code:
9.3%
Whole state:
5.2%
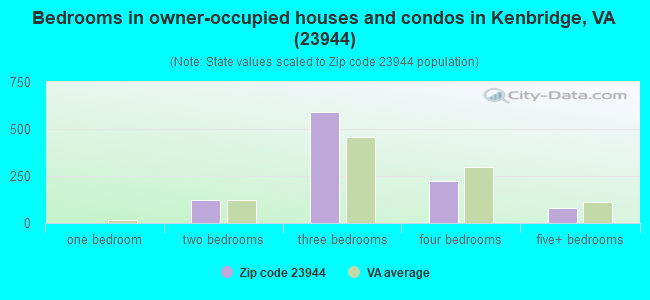
Median number of rooms in houses and condos:
Here:
6.6
State:
7.0
Median number of rooms in apartments:
Here:
5.5
State:
4.3
Notable locations in this zip code not listed on our city pages
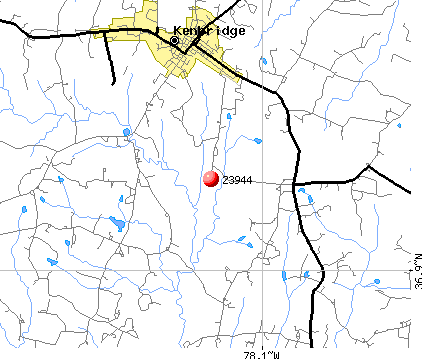
Notable locations in zip code 23944: Lunenburg Country Club (A), Kenbridge Emergency Squad (B), Kenbridge Police Department (C), Kenbridge Fire Department (D). Display/hide their locations on the map
Churches in zip code 23944 include: Providence Church (A), Antioch Church (B), Bethany Church (C), Rosebud Church (D), Saint Marks Church (E), Starlight Church (F), Unity Church (G), Fletchers Chapel (H), Varicks Chapel (I). Display/hide their locations on the map
Cemeteries: Kenbridge Heights Cemetery (1), Bell Cemetery (2), Hite Cemetery (3), Manson Cemetery (4), Marshall Cemetery (5), McDaniel Cemetery (6), Neblett Cemetery (7). Display/hide their locations on the map
Streams, rivers, and creeks: Seay Creek (A), Reedy Branch (B), Long Branch (C), Little Nottoway River (D), Little Hounds Creek (E), Kettlesticks Creek (F), Broad Branch (G), Big Hounds Creek (H), Beaver Pond Creek (I). Display/hide their locations on the map
In group quarters: 5 (-1 institutionalized population)
Size of family households: 439 2-persons, 212 3-persons, 133 4-persons, 127 5-persons, 6 6-persons, 75 7-or-more-persons
Size of nonfamily households: 439 1-person, 26 2-persons
365 married couples with children.
300 single-parent households (84 men, 216 women).
85.6% of residents of 23944 zip code speak English at home.
12.7% of residents speak Spanish at home (20% very well, 39% well, 39% not well, 1% not at all).
1.0% of residents speak other Indo-European language at home (100% very well).
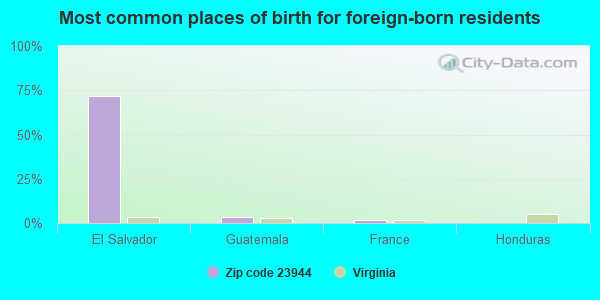
Foreign born population: 399 (10.5%) (1.3% of them are naturalized citizens)
This zip code:
10.5%
Whole state:
12.7%
72%El Salvador
3%Guatemala
1%France
0%Honduras
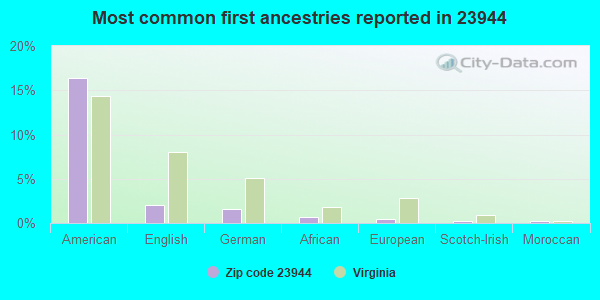
16%American
2%English
2%German
1%African
0%European
0%Scotch-Irish
0%Moroccan
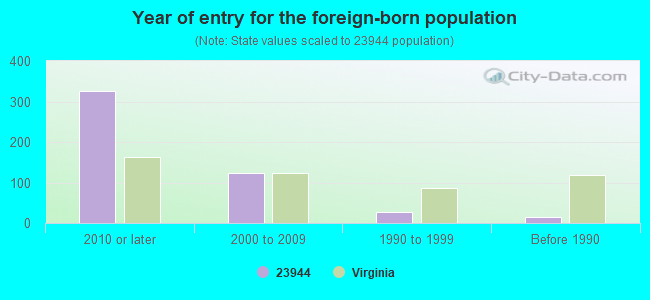
Year of entry for the foreign-born population
3262010 or later
1242000 to 2009
281990 to 1999
15Before 1990
Facilities with environmental interests located in this zip code:
COASTAL MART INC #902 (4TH & BROAD ST in KENBRIDGE, VA)
Conditionally Exempt Small Quantity Generators, less than 100 kg/month of hazardous waste (Resource Conservation and Recovery Act (tracking hazardous waste)) - notification Organizations: OPERNAME (CONTACT/OPERATOR)
, HUGHEY L M CO (CONTACT/OWNER)
Housing units lacking complete plumbing facilities: 5.2% Housing units lacking complete kitchen facilities: 6.2%
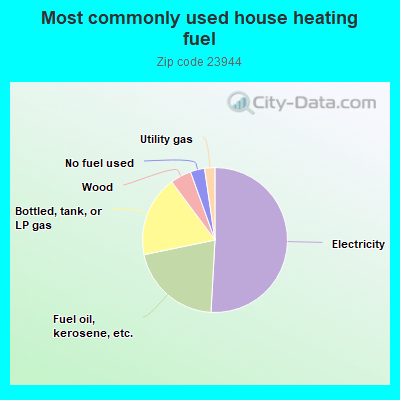
51.0%Electricity
20.9%Fuel oil, kerosene, etc.
18.1%Bottled, tank, or LP gas
4.7%Wood
3.2%No fuel used
2.3%Utility gas
Population in 1990: 4,269. Population change in the 1990s: +52 (+1.2%).
Place of birth for U.S.-born residents:
This state: 2,577
Northeast: 206
Midwest: 95
South: 415
West: 29
71% of the 23944 zip code residents lived in the same house 5 years ago. Out of people who lived in different houses, 58% lived in this county. Out of people who lived in different counties, 50% lived in Virginia.
98% of the 23944 zip code residents lived in the same house 1 year ago. Out of people who lived in different houses, 76% moved from this county. Out of people who lived in different houses, 45% moved from different county within same state.
Private vs. public school enrollment:
Students in private schools in grades 1 to 8 (elementary and middle school):
Here:
0.0%
Virginia:
13.2%
Students in private schools in grades 9 to 12 (high school): 28
Here:
10.3%
Virginia:
10.2%
Students in private undergraduate colleges: 31
Here:
41.5%
Virginia:
18.7%
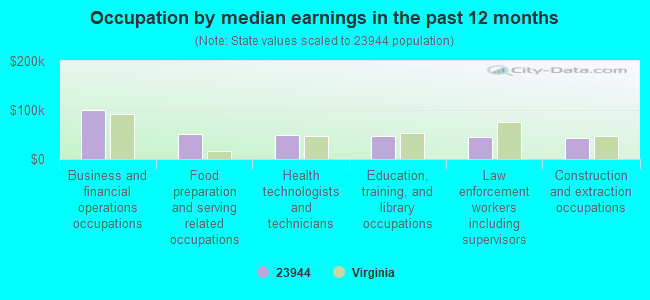
Occupation by median earnings in the past 12 months ($)
100,993Business and financial operations occupations
51,241Food preparation and serving related occupations
47,973Health technologists and technicians
46,093Education, training, and library occupations
44,188Law enforcement workers including supervisors
43,622Construction and extraction occupations
Top industries in this zip code by the number of employees in 2005:
Health Care and Social Assistance: Residential Mental Health and Substance Abuse Facilities (100-249 employees: 1 establishment)
Other Services (except Public Administration): Reupholstery and Furniture Repair (20-49: 1, 1-4: 1)
People in group quarters in 2010:
21 people in nursing facilities/skilled-nursing facilities
People in group quarters in 2000:
50 people in unknown juvenile institutions
18 people in homes for the physically handicapped
4 people in nursing homes
Fatal accident statistics in 2014:
Fatal accident count: 1
Vehicles involved in fatal accidents: 1
Fatal accidents caused by drunken drivers: 1
Fatalities: 1
Persons involved in fatal accidents: 1
Pedestrians involved in fatal accidents: 0
Fatal accident statistics in 2013:
Fatal accident count: 2
Vehicles involved in fatal accidents: 2
Fatal accidents caused by drunken drivers: 1
Fatalities: 2
Persons involved in fatal accidents: 2
Pedestrians involved in fatal accidents: 0
2002 - 2018 National Fire Incident Reporting System (NFIRS) incidents
According to the data from the years 2002 - 2018 the average number of fires per year is 30. The highest number of fires - 55 took place in 2007, and the least - 0 in 2003. The data has an increasing trend.
When looking into fire subcategories, the most incidents belonged to: Structure Fires (43.5%), and Outside Fires (40.2%).
Fire incident types reported to NFIRS in Zip Code 23944


 Nearest zip codes: 23974, 23938, 23952, 23970, 23821, 23824.


 According to the data from the years 2002 - 2018 the average number of fires per year is 30. The highest number of fires - 55 took place in 2007, and the least - 0 in 2003. The data has an increasing trend.
 When looking into fire subcategories, the most incidents belonged to: Structure Fires (43.5%), and Outside Fires (40.2%).