Estimated zip code population in 2022: 7,979 Zip code population in 2010: 8,684 Zip code population in 2000: 7,984
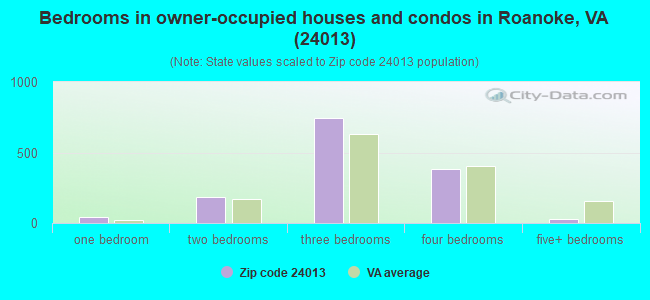
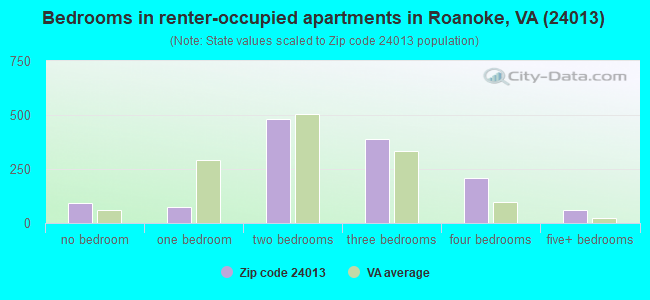
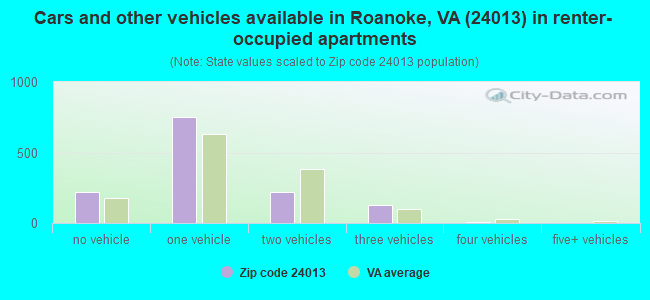
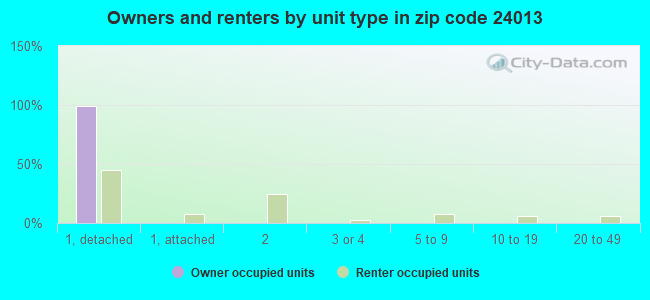
Houses and condos: 3,404 Renter-occupied apartments: 1,313
% of renters here:
49%
State:
33%
March 2022 cost of living index in zip code 24013: 84.5 (less than average, U.S. average is 100)
Land area: 2.3 sq. mi. Water area: 0.0 sq. mi.
Population density: 3,530 people per square mile
(average).
OSM Map
General Map
Google Map
MSN Map
OSM Map
General Map
Google Map
MSN Map
OSM Map
General Map
Google Map
MSN Map
OSM Map
General Map
Google Map
MSN Map
Please wait while loading the map...
Real estate property taxes paid for housing units in 2022:
This zip code:
1.0% ($1,112)
Virginia:
0.7% ($2,617)
Median real estate property taxes paid for housing units with mortgages in 2022: $1,240 (1.1%) Median real estate property taxes paid for housing units with no mortgage in 2022: $934 (0.9%)
Business Search- 14 Million verified businesses
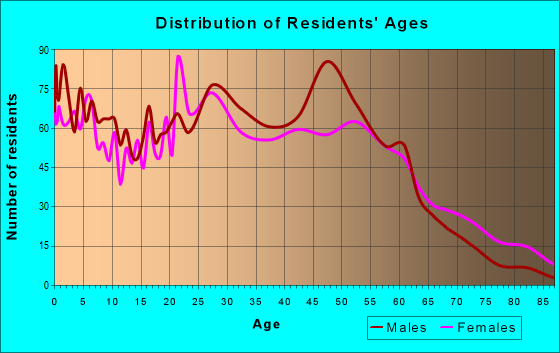
Males: 3,607
(45.2%)
Females: 4,371
(54.8%)
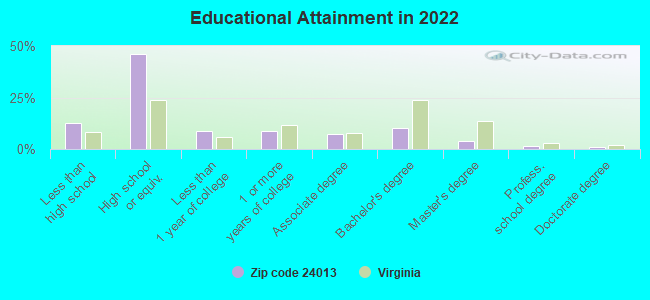
For population 25 years and over in 24013:
High school or higher: 86.6%
Bachelor's degree or higher: 16.4%
Graduate or professional degree: 6.1%
Unemployed: 4.1%
Mean travel time to work (commute): 22.1 minutes
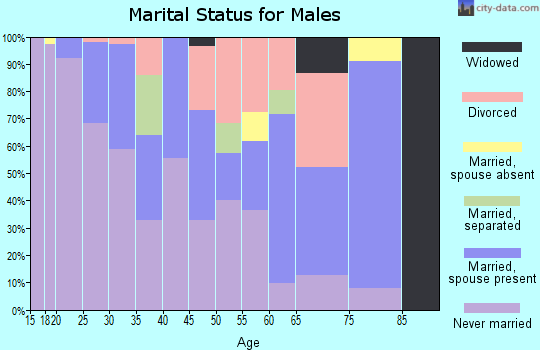
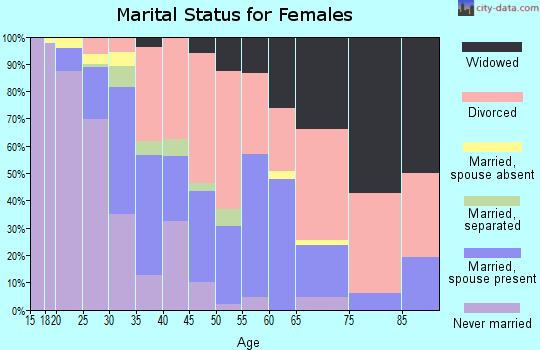
For population 15 years and over in 24013:
Never married: 51.4%
Now married: 29.3%
Separated: 0.7%
Widowed: 5.3%
Divorced: 13.3%
Zip code 24013 compared to state average:
Median household income below state average.
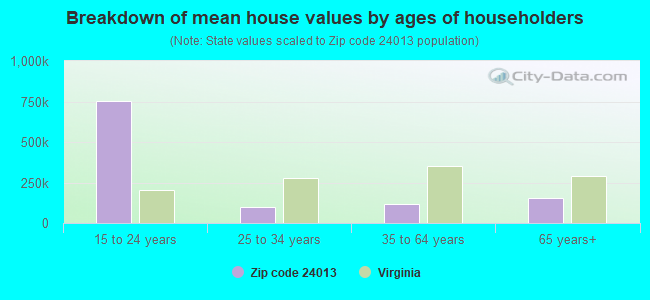
Median house value significantly below state average.
Hispanic race population percentage below state average.
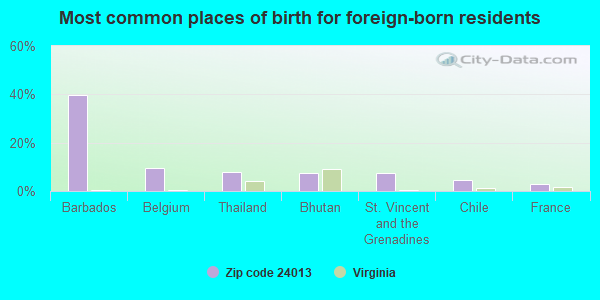
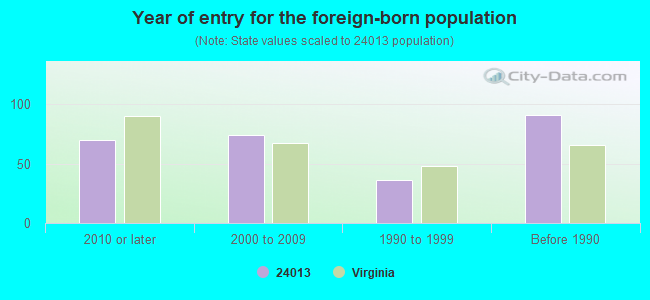
Foreign-born population percentage significantly below state average.
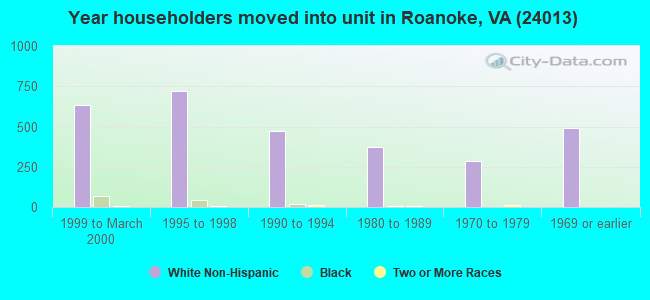
Length of stay since moving in significantly above state average.
House age significantly above state average.
Number of college students below state average.
Percentage of population with a bachelor's degree or higher significantly below state average.
Averages for the 2020 tax year for zip code 24013, filed in 2021:
Average Adjusted Gross Income (AGI) in 2020: $29,175 (Individual Income Tax Returns)
Here:
$29,175
State:
$86,446
Salary/wage: $27,086 (reported on 89.8% of returns)
Here:
$27,086
State:
$71,185
(% of AGI for various income ranges: 1184.6% for AGIs below $25k, 3638.0% for AGIs $25k-50k, 6727.8% for AGIs $50k-75k, 9001.2% for AGIs $75k-100k, 13284.0% for AGIs $100k-200k)
Taxable interest for individuals: $307 (reported on 8.9% of returns)
This zip code:
$307
Virginia:
$1,805
(% of AGI for various income ranges: 2.2% for AGIs below $25k, 3.3% for AGIs $25k-50k, 9.1% for AGIs $50k-75k, 3.8% for AGIs $75k-100k, 10.0% for AGIs $100k-200k)
Ordinary dividends: $1,317 (reported on 3.8% of returns)
Here:
$1,317
State:
$8,327
(% of AGI for various income ranges: 1.0% for AGIs below $25k, 4.9% for AGIs $25k-50k, 8.7% for AGIs $50k-75k, 102.5% for AGIs $75k-100k)
Net capital gain/loss in AGI: +$5,750 (reported on 3.2% of returns)
Here:
+$5,750
State:
+$24,644
(% of AGI for various income ranges: 4.0% for AGIs below $25k, 10.9% for AGIs $25k-50k, 9.1% for AGIs $50k-75k, 508.8% for AGIs $75k-100k)
Profit/loss from business: +$7,023 (reported on 11.2% of returns)
Here:
+$7,023
State:
+$12,836
(% of AGI for various income ranges: 115.7% for AGIs below $25k, 52.4% for AGIs $25k-50k, 201.3% for AGIs $50k-75k)
Taxable individual retirement arrangement distribution: $8,529 (reported on 2.2% of returns)
24013:
$8,529
Virginia:
$21,535
(% of AGI for various income ranges: 16.2% for AGIs below $25k, 44.7% for AGIs $25k-50k)
Total itemized deductions: $20,000 (reported on 1.0% of returns)
Here:
$20,000
State:
$33,287
(% of AGI for various income ranges: 70.6% for AGIs $25k-50k)
Taxes paid: $3,733 (reported on 1.0% of returns)
24013:
$3,733
State:
$8,284
(% of AGI for various income ranges: 13.2% for AGIs $25k-50k)
Earned income credit: $2,530 (reported on 35.8% of returns)
Here:
$2,530
State:
$2,214
(% of AGI for various income ranges: 146.3% for AGIs below $25k, 102.8% for AGIs $25k-50k)
Percentage of individuals using paid preparers for their 2020 taxes: 93.9%
Here:
94%
State:
92%
(% for various income ranges: 93.3% for AGIs below $25k, 95.0% for AGIs $25k-50k, 93.3% for AGIs $50k-75k, 90.9% for AGIs $75k-100k, 100.0% for AGIs $100k-200k)
Averages for the 2012 tax year for zip code 24013, filed in 2013:
Average Adjusted Gross Income (AGI) in 2012: $25,597 (Individual Income Tax Returns)
Here:
$25,597
State:
$71,192
Salary/wage: $24,536 (reported on 91.9% of returns)
Here:
$24,536
State:
$59,229
(% of AGI for various income ranges: 85.9% for AGIs below $25k, 91.9% for AGIs $25k-50k, 89.3% for AGIs $50k-75k, 88.0% for AGIs $75k-100k, 67.1% for AGIs $100k-200k)
Taxable interest for individuals: $648 (reported on 9.7% of returns)
This zip code:
$648
Virginia:
$1,600
(% of AGI for various income ranges: 0.3% for AGIs below $25k, 0.3% for AGIs $25k-50k, 0.2% for AGIs $50k-75k)
Ordinary dividends: $883 (reported on 3.8% of returns)
Here:
$883
State:
$6,959
(% of AGI for various income ranges: 0.1% for AGIs below $25k, 0.1% for AGIs $25k-50k, 0.2% for AGIs $50k-75k)
Net capital gain/loss in AGI: +$33 (reported on 1.9% of returns)
Here:
+$33
State:
+$16,672
Profit/loss from business: +$7,324 (reported on 9.1% of returns)
Here:
+$7,324
State:
+$14,116
(% of AGI for various income ranges: 6.5% for AGIs below $25k, 1.3% for AGIs $25k-50k, 0.6% for AGIs $50k-75k)
Taxable individual retirement arrangement distribution: $8,280 (reported on 3.1% of returns)
24013:
$8,280
Virginia:
$16,667
(% of AGI for various income ranges: 1.0% for AGIs below $25k, 0.8% for AGIs $25k-50k, 2.0% for AGIs $50k-75k)
Total itemized deductions: $12,820 (27% of AGI, reported on 9.4% of returns)
Here:
$12,820
State:
$26,596
Here:
27.0% of AGI
State:
20.1% of AGI
(% of AGI for various income ranges: 2.3% for AGIs below $25k, 5.0% for AGIs $25k-50k, 4.6% for AGIs $50k-75k, 17.7% for AGIs $75k-100k)
Charity contributions: $2,300 (reported on 5.9% of returns)
Here:
$2,300
State:
$4,443
(% of AGI for various income ranges: 0.2% for AGIs below $25k, 0.5% for AGIs $25k-50k, 0.8% for AGIs $50k-75k, 2.5% for AGIs $75k-100k)
Taxes paid: $3,459 (reported on 9.1% of returns)
24013:
$3,459
State:
$9,951
(% of AGI for various income ranges: 0.3% for AGIs below $25k, 1.1% for AGIs $25k-50k, 1.5% for AGIs $50k-75k, 6.4% for AGIs $75k-100k)
Earned income credit: $2,474 (reported on 37.8% of returns)
Here:
$2,474
State:
$2,211
(% of AGI for various income ranges: 10.0% for AGIs below $25k, 1.5% for AGIs $25k-50k)
Percentage of individuals using paid preparers for their 2012 taxes: 45.0%
Here:
45%
State:
46%
(% for various income ranges: 47.1% for AGIs below $25k, 40.6% for AGIs $25k-50k, 41.7% for AGIs $50k-75k, 83.3% for AGIs $75k-100k)
Averages for the 2004 tax year for zip code 24013, filed in 2005:
Average Adjusted Gross Income (AGI) in 2004: $22,140 (Individual Income Tax Returns)
Here:
$22,140
State:
$56,704
Salary/wage: $21,559 (reported on 92.2% of returns)
Here:
$21,559
State:
$48,441
(% of AGI for various income ranges: 90.5% for AGIs below $10k, 90.0% for AGIs $10k-25k, 91.9% for AGIs $25k-50k, 88.2% for AGIs $50k-75k, 78.1% for AGIs $75k-100k)
Taxable interest for individuals: $583 (reported on 16.0% of returns)
This zip code:
$583
Virginia:
$1,688
(% of AGI for various income ranges: 0.9% for AGIs below $10k, 0.6% for AGIs $10k-25k, 0.4% for AGIs $25k-50k, 0.1% for AGIs $50k-75k, 0.0% for AGIs $75k-100k)
Taxable dividends: $645 (reported on 4.8% of returns)
Here:
$645
State:
$4,028
(% of AGI for various income ranges: 0.1% for AGIs below $10k, 0.2% for AGIs $10k-25k, 0.1% for AGIs $25k-50k, 0.1% for AGIs $50k-75k)
Net capital gain/loss: +$2,010 (reported on 3.4% of returns)
Here:
+$2,010
State:
+$14,375
Profit/loss from business: +$5,224 (reported on 8.2% of returns)
Here:
+$5,224
State:
+$13,342
(% of AGI for various income ranges: 6.3% for AGIs below $10k, 3.0% for AGIs $10k-25k, 1.2% for AGIs $25k-50k, 0.9% for AGIs $50k-75k)
IRA payment deduction: $1,680 (reported on 0.9% of returns)
24013:
$1,680
Virginia:
$2,943
Total itemized deductions: $10,799 (26% of AGI, reported on 10.0% of returns)
Here:
$10,799
State:
$21,492
Here:
26.3% of AGI
State:
21.0% of AGI
(% of AGI for various income ranges: 3.3% for AGIs $10k-25k, 4.8% for AGIs $25k-50k, 7.4% for AGIs $50k-75k, 11.1% for AGIs $75k-100k)
Charity contributions deductions: $1,623 (4% of AGI, reported on 7.3% of returns)
Here:
$1,623
State:
$3,794
Here:
3.7% of AGI
State:
3.5% of AGI
(% of AGI for various income ranges: 0.2% for AGIs $10k-25k, 0.5% for AGIs $25k-50k, 1.0% for AGIs $50k-75k, 1.3% for AGIs $75k-100k)
Total tax: $2,119 (reported on 62.1% of returns)
24013:
$2,119
State:
$9,537
(% of AGI for various income ranges: 1.7% for AGIs below $10k, 3.5% for AGIs $10k-25k, 6.3% for AGIs $25k-50k, 8.5% for AGIs $50k-75k, 13.0% for AGIs $75k-100k)
Earned income credit: $1,790 (reported on 33.9% of returns)
Here:
$1,790
State:
$1,734
Percentage of individuals using paid preparers for their 2004 taxes: 54.9%
Here:
55%
State:
52%
(% for various income ranges: 52.3% for AGIs below $10k, 58.9% for AGIs $10k-25k, 50.9% for AGIs $25k-50k, 53.8% for AGIs $50k-75k, 65.9% for AGIs $75k-100k)
Likely homosexual households (counted as self-reported same-sex unmarried-partner households)
Lesbian couples: 0.1% of all households
Gay men: 0.6% of all households
Household received Food Stamps/SNAP in the past 12 months: 764 Household did not receive Food Stamps/SNAP in the past 12 months: 2,029
Women who had a birth in the past 12 months: 70 (24 now married, 42 unmarried) Women who did not have a birth in the past 12 months: 1,881 (428 now married, 1,468 unmarried)
Housing units in zip code 24013 with a mortgage: 800 (27 second mortgage) Median monthly owner costs for units with a mortgage: $925 Median monthly owner costs for units without a mortgage: $384
Residents with income below the poverty level in 2022:
This zip code:
21.8%
Whole state:
10.6%
Residents with income below 50% of the poverty level in 2022:
This zip code:
11.4%
Whole state:
5.2%
Median number of rooms in houses and condos:
Here:
6.9
State:
7.0
Median number of rooms in apartments:
Here:
5.2
State:
4.3
Notable locations in this zip code not listed on our city pages
Notable locations in zip code 24013: Roanoke Industrial Center (A), Southeast Community Center (B), Jackson Park Branch Roanoke City Public Library (C), Fire Station Number 6 (D), Buena Vista (E). Display/hide their locations on the map
Churches in zip code 24013 include: Belmont Baptist Church (A), Belmont Christian Church (B), Belmont Church of God (C), Belmont Presbyterian Church (D), Belmont United Methodist Church (E), Fellowship Baptist Church (F), Free Saints Temple (G), Grandview Heights Church of the Nazarene (H), House of Prayer Church (I). Display/hide their locations on the map
Parks in zip code 24013 include: Morningside Park (1), Southeast Recreation Center (2), Jackson Park (3), Fallon Park (4). Display/hide their locations on the map
573 married couples with children.
1,444 single-parent households (224 men, 1,220 women).
94.9% of residents of 24013 zip code speak English at home.
2.5% of residents speak Spanish at home (81% very well, 19% not well).
0.9% of residents speak other Indo-European language at home (100% very well).
0.6% of residents speak Asian or Pacific Island language at home (100% well).
0.2% of residents speak other language at home (100% very well).
Foreign born population: 171 (2.1%) (15.5% of them are naturalized citizens)
Facilities with environmental interests located in this zip code:
AEP ROANOKE SERVICE CENTER (802 RIVER AVE in ROANOKE, VA)
(Integrated Compliance Information System) - ICIS-03-1986-0060, FORMAL ENFORCEMENT ACTION Conditionally Exempt Small Quantity Generators, less than 100 kg/month of hazardous waste (Resource Conservation and Recovery Act (tracking hazardous waste)) - notification USED OIL PROGRAM (Resource Conservation and Recovery Act (tracking hazardous waste)) Organizations: APPALACHIAN POWER CO (CONTACT/OWNER)
Alternative names: AMER ELECTRIC POWER CORP
CHEMSOLV INCORPORATED (1140 INDUSTRY AVENUE SOUTHEAST in ROANOKE, VA)
ENFORCEMENT/COMPLIANCE ACTIVITY (Integrated Compliance Information System) COMPLIANCE ACTIVITY (Tracking inspections of insecticide, fungicide, and rodenticide, and toxic substances) CRITERIA AND HAZARDOUS AIR POLLUTANT INVENTORY (Inventory of air pollution sources) HAZARDOUS WASTE BIENNIAL REPORTER (Resource Conservation and Recovery Act (tracking hazardous waste)) Large Quantity Generators, more that 1000 kg of hazardous waste/month (Resource Conservation and Recovery Act (tracking hazardous waste)) TRANSPORTER (Resource Conservation and Recovery Act (tracking hazardous waste)) TRI REPORTER (Tracking of toxic chemicals releasing facilities) Business SIC classification: CHEMICALS AND ALLIED PRODUCTS Organizations: AUSTIN L GLENN (CONTACT/OWNER)
Alternative names: CHEMICALS & SOLVENTS INC, CHEM-SOLV, INC.
BRIGHT PRODUCTS INC (907 4TH ST in ROANOKE, VA)
(Resource Conservation and Recovery Act (tracking hazardous waste)) Organizations: OPERNAME (CONTACT/OPERATOR)
, BRIGHT, JOHN A (CONTACT/OWNER)
ANDREWS-TROUT INC (1140 -A INDUSTRY AVE in ROANOKE, VA)
7 ELEVEN #21878 (1701 9TH STREET AND BUENA VISTA in ROANOKE, VA)
Small Quantity Generators, between 100 kg and 1000 kg of hazardous waste/month (Resource Conservation and Recovery Act (tracking hazardous waste)) - notification Organizations: OPERNAME (CONTACT/OPERATOR)
, SOUTHLAND CORPORATION THE (CONTACT/OWNER)
AMOCO #812-TANKS (401 ELM AVE SE in ROANOKE, VA)
Small Quantity Generators, between 100 kg and 1000 kg of hazardous waste/month (Resource Conservation and Recovery Act (tracking hazardous waste)) - notification Organizations: OPERNAME (CONTACT/OPERATOR)
, AMOCO OIL COMPANY (CONTACT/OWNER)
AMERICAN VISCOSE CO (1912 9TH ST SE in ROANOKE, VA)
SUPERFUND (Superfund database)
APB WHITING OIL COMPANY (1415 EASTERN ROAD in ROANOKE, VA)
ENFORCEMENT/COMPLIANCE ACTIVITY (Integrated Compliance Information System)
Housing units lacking complete plumbing facilities: 1.7% Housing units lacking complete kitchen facilities: 9.0%
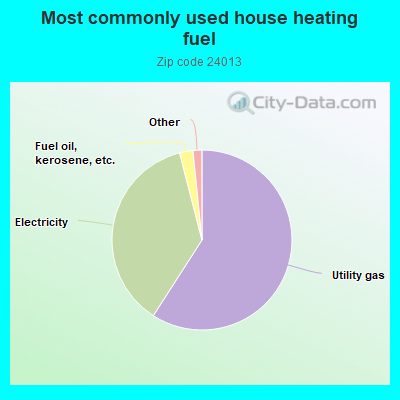
59.1%Utility gas
36.9%Electricity
2.4%Fuel oil, kerosene, etc.
0.8%Wood
0.6%Bottled, tank, or LP gas
Population in 1990: 8,347.
Place of birth for U.S.-born residents:
This state: 5,913
Northeast: 346
Midwest: 459
South: 794
West: 139
57% of the 24013 zip code residents lived in the same house 5 years ago. Out of people who lived in different houses, 66% lived in this county. Out of people who lived in different counties, 50% lived in Virginia.
89% of the 24013 zip code residents lived in the same house 1 year ago. Out of people who lived in different houses, 49% moved from this county. Out of people who lived in different houses, 19% moved from different county within same state. Out of people who lived in different houses, 30% moved from different state. Out of people who lived in different houses, 0% moved from abroad.
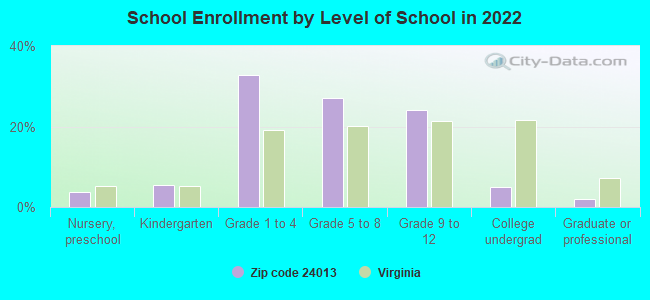
Private vs. public school enrollment:
Students in private schools in grades 1 to 8 (elementary and middle school): 364
Here:
28.8%
Virginia:
13.2%
Students in private schools in grades 9 to 12 (high school): 45
Here:
9.1%
Virginia:
10.2%
Students in private undergraduate colleges: 20
Here:
20.1%
Virginia:
18.7%
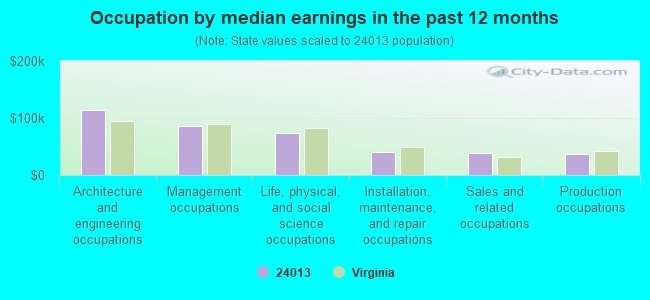
Occupation by median earnings in the past 12 months ($)
113,518Architecture and engineering occupations
86,452Management occupations
73,865Life, physical, and social science occupations
39,769Installation, maintenance, and repair occupations
38,296Sales and related occupations
36,018Production occupations
Companies with federal contracts located in this zip code:
TIME TECHNOLOGIES, INC (326 TAZEWELL AVENUE SE in ROANOKE, VA; small business) : $48,575 in 3 contractsfrom 2001 to 2003
$25,055 with Army for Equipment and Materials Testing -- Recreational and Athletic Equipment. Taking place in MD. Signed on 2003-09-30. Completion date: 2003-10-30.
$13,650 with Army for Athletic and Sporting Equipment. Signed on 2002-11-18. Completion date: 2002-12-16.
$9,870 with Army for Athletic and Sporting Equipment. Taking place in MD. Signed on 2001-09-26. Completion date: 2001-10-26.
Top industries in this zip code by the number of employees in 2005:
Health Care and Social Assistance: Offices of Physicians (except Mental Health Specialists) (50-99 employees: 2 establishments, 20-49 employees: 2 establishments, 10-19 employees: 2 establishments, 1-4 employees: 1 establishment)
Utilities: Fossil Fuel Electric Power Generation (100-249: 1)
Accommodation and Food Services: Limited-Service Restaurants (20-49: 4)
Wholesale Trade: Motor Vehicle Supplies and New Parts Merchant Wholesalers (50-99: 1, 10-19: 1, 5-9: 1, 1-4: 2)
Construction: Poured Concrete Foundation and Structure Contractors (50-99: 1, 10-19: 1)
Other Services (except Public Administration): Civic and Social Organizations (50-99: 1, 5-9: 1)
People in group quarters in 2010:
512 people in emergency and transitional shelters (with sleeping facilities) for people experiencing homelessness
124 people in other noninstitutional facilities
74 people in college/university student housing
People in group quarters in 2000:
88 people in other noninstitutional group quarters
32 people in homes or halfway houses for drug/alcohol abuse
Fatal accident statistics in 2014:
Fatal accident count: 1
Vehicles involved in fatal accidents: 1
Fatal accidents caused by drunken drivers: 0
Fatalities: 1
Persons involved in fatal accidents: 1
Pedestrians involved in fatal accidents: 1
Fatal accident statistics in 2013:
Fatal accident count: 1
Vehicles involved in fatal accidents: 2
Fatal accidents caused by drunken drivers: 0
Fatalities: 1
Persons involved in fatal accidents: 2
Pedestrians involved in fatal accidents: 0
Home Mortgage Disclosure Act Aggregated Statistics For Year 2009 (Based on 4 full tracts)
A) FHA, FSA/RHS & VA Home Purchase Loans
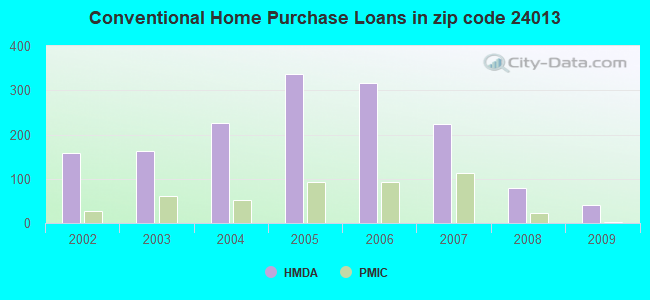
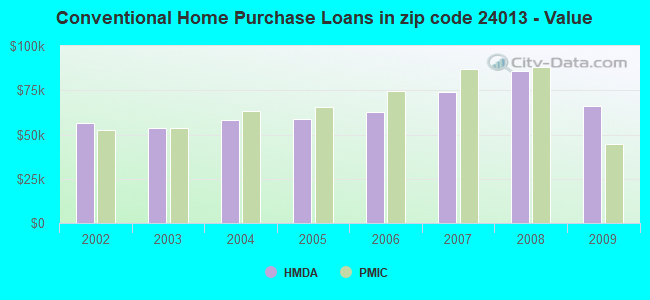
B) Conventional Home Purchase Loans
C) Refinancings
D) Home Improvement Loans
E) Loans on Dwellings For 5+ Families
F) Non-occupant Loans on < 5 Family Dwellings (A B C & D)
G) Loans On Manufactured Home Dwelling (A B C & D)
Number
Average Value
Number
Average Value
Number
Average Value
Number
Average Value
Number
Average Value
Number
Average Value
Number
Average Value
LOANS ORIGINATED
129
$68,849
40
$65,906
147
$83,535
28
$24,944
0
$0
40
$83,032
2
$5,985
APPLICATIONS APPROVED, NOT ACCEPTED
0
$0
2
$31,925
14
$67,739
0
$0
0
$0
10
$58,611
0
$0
APPLICATIONS DENIED
12
$58,503
16
$51,406
72
$79,945
20
$17,183
2
$188,650
18
$53,222
0
$0
APPLICATIONS WITHDRAWN
10
$60,404
6
$17,950
46
$86,952
4
$28,310
0
$0
10
$68,637
0
$0
FILES CLOSED FOR INCOMPLETENESS
2
$114,725
0
$0
22
$86,269
0
$0
0
$0
0
$0
0
$0
Aggregated Statistics For Year 2008 (Based on 4 full tracts)
A) FHA, FSA/RHS & VA Home Purchase Loans
B) Conventional Home Purchase Loans
C) Refinancings
D) Home Improvement Loans
E) Loans on Dwellings For 5+ Families
F) Non-occupant Loans on < 5 Family Dwellings (A B C & D)
Number
Average Value
Number
Average Value
Number
Average Value
Number
Average Value
Number
Average Value
Number
Average Value
LOANS ORIGINATED
86
$90,030
78
$86,051
167
$74,617
36
$33,189
0
$0
72
$82,237
APPLICATIONS APPROVED, NOT ACCEPTED
2
$83,800
2
$81,805
14
$74,038
0
$0
0
$0
2
$81,805
APPLICATIONS DENIED
2
$108,225
24
$68,143
245
$79,794
46
$38,635
2
$163,830
36
$66,191
APPLICATIONS WITHDRAWN
8
$85,225
16
$57,206
58
$85,108
14
$35,506
0
$0
12
$62,167
FILES CLOSED FOR INCOMPLETENESS
0
$0
4
$77,185
14
$93,951
0
$0
0
$0
0
$0
Aggregated Statistics For Year 2007 (Based on 4 full tracts)
A) FHA, FSA/RHS & VA Home Purchase Loans
B) Conventional Home Purchase Loans
C) Refinancings
D) Home Improvement Loans
F) Non-occupant Loans on < 5 Family Dwellings (A B C & D)
G) Loans On Manufactured Home Dwelling (A B C & D)
Number
Average Value
Number
Average Value
Number
Average Value
Number
Average Value
Number
Average Value
Number
Average Value
LOANS ORIGINATED
52
$91,890
223
$73,945
241
$71,901
56
$42,605
117
$68,806
2
$43,895
APPLICATIONS APPROVED, NOT ACCEPTED
4
$53,120
22
$83,187
60
$63,086
8
$39,116
30
$63,634
2
$139,005
APPLICATIONS DENIED
8
$84,205
54
$68,623
316
$84,895
76
$48,924
56
$84,086
0
$0
APPLICATIONS WITHDRAWN
16
$71,888
20
$76,968
181
$86,419
16
$51,596
28
$84,653
0
$0
FILES CLOSED FOR INCOMPLETENESS
0
$0
6
$80,040
32
$69,348
0
$0
4
$61,700
0
$0
Aggregated Statistics For Year 2006 (Based on 4 full tracts)
A) FHA, FSA/RHS & VA Home Purchase Loans
B) Conventional Home Purchase Loans
C) Refinancings
D) Home Improvement Loans
F) Non-occupant Loans on < 5 Family Dwellings (A B C & D)
G) Loans On Manufactured Home Dwelling (A B C & D)
Number
Average Value
Number
Average Value
Number
Average Value
Number
Average Value
Number
Average Value
Number
Average Value
LOANS ORIGINATED
74
$78,382
316
$62,601
277
$65,490
84
$38,251
185
$56,292
2
$14,965
APPLICATIONS APPROVED, NOT ACCEPTED
8
$91,165
34
$55,261
42
$68,804
4
$11,925
14
$63,649
6
$82,410
APPLICATIONS DENIED
10
$77,613
127
$66,018
306
$65,101
119
$28,620
44
$59,040
14
$75,446
APPLICATIONS WITHDRAWN
2
$62,555
58
$57,056
235
$68,252
20
$26,168
40
$59,788
0
$0
FILES CLOSED FOR INCOMPLETENESS
2
$104,750
12
$49,423
42
$80,275
0
$0
10
$56,550
0
$0
Aggregated Statistics For Year 2005 (Based on 4 full tracts)
A) FHA, FSA/RHS & VA Home Purchase Loans
B) Conventional Home Purchase Loans
C) Refinancings
D) Home Improvement Loans
F) Non-occupant Loans on < 5 Family Dwellings (A B C & D)
G) Loans On Manufactured Home Dwelling (A B C & D)
Number
Average Value
Number
Average Value
Number
Average Value
Number
Average Value
Number
Average Value
Number
Average Value
LOANS ORIGINATED
76
$82,334
337
$58,764
287
$64,798
58
$39,150
203
$57,596
0
$0
APPLICATIONS APPROVED, NOT ACCEPTED
8
$82,302
50
$58,969
100
$60,578
12
$28,643
38
$53,924
4
$71,828
APPLICATIONS DENIED
10
$90,017
104
$60,672
312
$67,467
82
$30,476
36
$53,600
22
$63,538
APPLICATIONS WITHDRAWN
2
$118,155
32
$64,056
193
$73,916
20
$40,252
34
$68,534
0
$0
FILES CLOSED FOR INCOMPLETENESS
2
$96,765
2
$42,695
52
$78,923
2
$35,915
12
$79,277
0
$0
Aggregated Statistics For Year 2004 (Based on 4 full tracts)
A) FHA, FSA/RHS & VA Home Purchase Loans
B) Conventional Home Purchase Loans
C) Refinancings
D) Home Improvement Loans
F) Non-occupant Loans on < 5 Family Dwellings (A B C & D)
G) Loans On Manufactured Home Dwelling (A B C & D)
Number
Average Value
Number
Average Value
Number
Average Value
Number
Average Value
Number
Average Value
Number
Average Value
LOANS ORIGINATED
74
$70,603
225
$58,363
297
$59,821
48
$47,325
169
$57,673
0
$0
APPLICATIONS APPROVED, NOT ACCEPTED
10
$84,628
32
$60,959
76
$63,779
8
$42,199
14
$54,157
4
$63,050
APPLICATIONS DENIED
16
$68,450
111
$60,617
289
$66,550
56
$21,891
34
$59,485
22
$50,235
APPLICATIONS WITHDRAWN
12
$64,772
40
$64,048
155
$67,757
6
$23,258
12
$74,330
2
$59,575
FILES CLOSED FOR INCOMPLETENESS
0
$0
8
$72,460
24
$66,499
6
$42,695
0
$0
0
$0
Aggregated Statistics For Year 2003 (Based on 4 full tracts)
A) FHA, FSA/RHS & VA Home Purchase Loans
B) Conventional Home Purchase Loans
C) Refinancings
D) Home Improvement Loans
F) Non-occupant Loans on < 5 Family Dwellings (A B C & D)
Number
Average Value
Number
Average Value
Number
Average Value
Number
Average Value
Number
Average Value
LOANS ORIGINATED
52
$71,452
163
$53,818
398
$57,404
50
$20,713
147
$53,074
APPLICATIONS APPROVED, NOT ACCEPTED
4
$78,638
24
$48,775
92
$54,306
4
$29,788
16
$51,418
APPLICATIONS DENIED
10
$60,241
82
$63,626
231
$57,843
26
$20,663
30
$47,618
APPLICATIONS WITHDRAWN
6
$62,765
24
$56,597
153
$65,435
2
$10,975
18
$47,039
FILES CLOSED FOR INCOMPLETENESS
0
$0
8
$62,421
16
$57,151
0
$0
4
$65,035
Aggregated Statistics For Year 2002 (Based on 4 full tracts)
A) FHA, FSA/RHS & VA Home Purchase Loans
B) Conventional Home Purchase Loans
C) Refinancings
D) Home Improvement Loans
F) Non-occupant Loans on < 5 Family Dwellings (A B C & D)
Detailed PMIC statistics for the following Tracts:0013.00
, 0014.00
2002 - 2018 National Fire Incident Reporting System (NFIRS) incidents
Based on the data from the years 2002 - 2018 the average number of fires per year is 65. The highest number of reported fire incidents - 78 took place in 2003, and the least - 52 in 2013. The data has a decreasing trend.
When looking into fire subcategories, the most incidents belonged to: Outside Fires (45.3%), and Structure Fires (32.3%).
Fire incident types reported to NFIRS in Zip Code 24013


 Nearest zip codes: 24011, 24016, 24014, 24012, 24015, 24017.
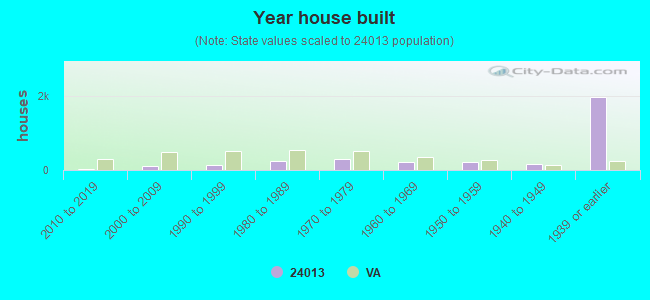


 Based on the data from the years 2002 - 2018 the average number of fires per year is 65. The highest number of reported fire incidents - 78 took place in 2003, and the least - 52 in 2013. The data has a decreasing trend.
 When looking into fire subcategories, the most incidents belonged to: Outside Fires (45.3%), and Structure Fires (32.3%).