Estimated zip code population in 2022: 2,323 Zip code population in 2010: 2,182 Zip code population in 2000: 2,223
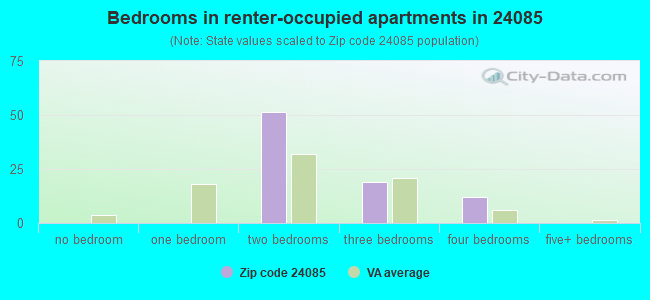
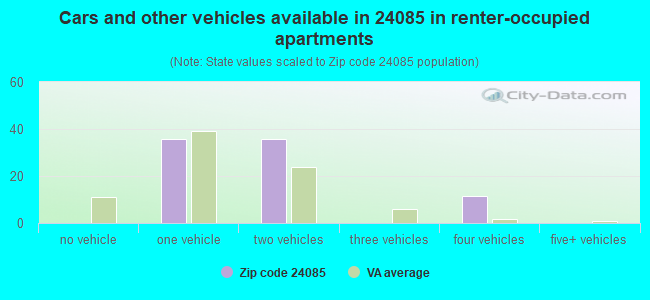
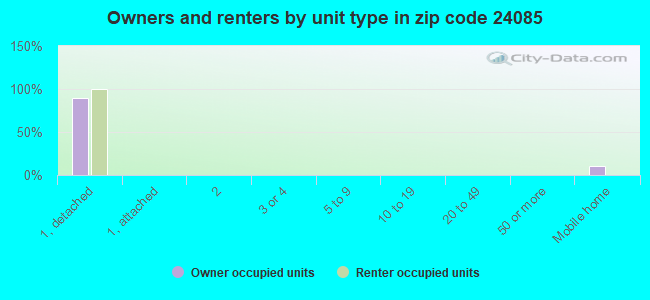
Houses and condos: 1,382 Renter-occupied apartments: 83
% of renters here:
7%
State:
33%
March 2022 cost of living index in zip code 24085: 84.6 (less than average, U.S. average is 100)
Land area: 175.6 sq. mi. Water area: 1.9 sq. mi.
Population density: 13 people per square mile
(very low).
OSM Map
General Map
Google Map
MSN Map
OSM Map
General Map
Google Map
MSN Map
OSM Map
General Map
Google Map
MSN Map
OSM Map
General Map
Google Map
MSN Map
Please wait while loading the map...
Real estate property taxes paid for housing units in 2022:
This zip code:
0.6% ($956)
Virginia:
0.7% ($2,617)
Median real estate property taxes paid for housing units with mortgages in 2022: $874 (0.7%) Median real estate property taxes paid for housing units with no mortgage in 2022: $1,152 (0.6%)
Business Search- 14 Million verified businesses
Males: 1,248
(53.7%)
Females: 1,075
(46.3%)
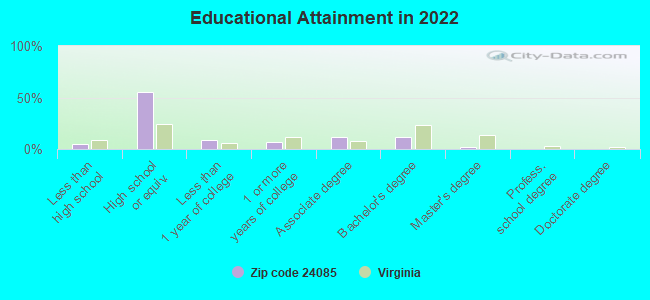
For population 25 years and over in 24085:
High school or higher: 94.6%
Bachelor's degree or higher: 13.2%
Graduate or professional degree: 2.1%
Unemployed: 4.6%
Mean travel time to work (commute): 34.3 minutes
For population 15 years and over in 24085:
Never married: 23.6%
Now married: 54.0%
Separated: 0.9%
Widowed: 8.8%
Divorced: 12.8%
Zip code 24085 compared to state average:
Median household income below state average.
Median house value below state average.
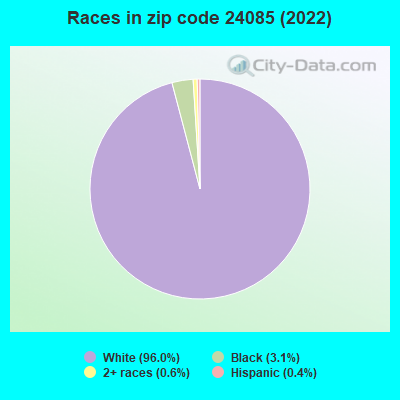
Black race population percentage significantly below state average.
Hispanic race population percentage significantly below state average.
Median age significantly above state average.
Foreign-born population percentage significantly below state average.
Renting percentage significantly below state average.
Length of stay since moving in significantly above state average.
Number of college students significantly below state average.
Percentage of population with a bachelor's degree or higher significantly below state average.
Averages for the 2020 tax year for zip code 24085, filed in 2021:
Average Adjusted Gross Income (AGI) in 2020: $56,316 (Individual Income Tax Returns)
Here:
$56,316
State:
$86,446
Salary/wage: $48,785 (reported on 79.3% of returns)
Here:
$48,785
State:
$71,185
(% of AGI for various income ranges: 1120.5% for AGIs below $25k, 3535.0% for AGIs $25k-50k, 5585.8% for AGIs $50k-75k, 9314.3% for AGIs $75k-100k, 16208.8% for AGIs $100k-200k)
Taxable interest for individuals: $487 (reported on 33.7% of returns)
This zip code:
$487
Virginia:
$1,805
(% of AGI for various income ranges: 12.4% for AGIs below $25k, 17.5% for AGIs $25k-50k, 18.3% for AGIs $50k-75k, 17.1% for AGIs $75k-100k, 70.0% for AGIs $100k-200k)
Ordinary dividends: $3,083 (reported on 19.6% of returns)
Here:
$3,083
State:
$8,327
(% of AGI for various income ranges: 22.4% for AGIs below $25k, 12.0% for AGIs $25k-50k, 135.8% for AGIs $50k-75k, 10.0% for AGIs $75k-100k, 392.5% for AGIs $100k-200k)
Net capital gain/loss in AGI: +$11,922 (reported on 9.8% of returns)
Here:
+$11,922
State:
+$24,644
(% of AGI for various income ranges: 18.1% for AGIs below $25k, 113.3% for AGIs $50k-75k, 1123.8% for AGIs $100k-200k)
Profit/loss from business: +$6,450 (reported on 10.9% of returns)
Here:
+$6,450
State:
+$12,836
(% of AGI for various income ranges: 37.1% for AGIs below $25k, 101.0% for AGIs $25k-50k, 197.5% for AGIs $50k-75k, 160.0% for AGIs $100k-200k)
Taxable individual retirement arrangement distribution: $23,017 (reported on 13.0% of returns)
24085:
$23,017
Virginia:
$21,535
(% of AGI for various income ranges: 85.2% for AGIs below $25k, 96.0% for AGIs $25k-50k, 855.0% for AGIs $50k-75k, 1706.2% for AGIs $100k-200k)
Total itemized deductions: $30,580 (reported on 5.4% of returns)
Here:
$30,580
State:
$33,287
(% of AGI for various income ranges: 1911.2% for AGIs $100k-200k)
Charity contributions: $11,875 (reported on 4.3% of returns)
Here:
$11,875
State:
$10,381
(% of AGI for various income ranges: 593.8% for AGIs $100k-200k)
Taxes paid: $6,340 (reported on 5.4% of returns)
24085:
$6,340
State:
$8,284
(% of AGI for various income ranges: 396.2% for AGIs $100k-200k)
Earned income credit: $2,162 (reported on 14.1% of returns)
Here:
$2,162
State:
$2,214
(% of AGI for various income ranges: 74.3% for AGIs below $25k, 62.5% for AGIs $25k-50k)
Percentage of individuals using paid preparers for their 2020 taxes: 94.6%
Here:
95%
State:
92%
(% for various income ranges: 92.9% for AGIs below $25k, 95.8% for AGIs $25k-50k, 93.8% for AGIs $50k-75k, 100.0% for AGIs $75k-100k, 92.9% for AGIs $100k-200k)
Averages for the 2012 tax year for zip code 24085, filed in 2013:
Average Adjusted Gross Income (AGI) in 2012: $48,036 (Individual Income Tax Returns)
Here:
$48,036
State:
$71,192
Salary/wage: $43,682 (reported on 82.0% of returns)
Here:
$43,682
State:
$59,229
(% of AGI for various income ranges: 67.9% for AGIs below $25k, 77.0% for AGIs $25k-50k, 82.6% for AGIs $50k-75k, 72.4% for AGIs $75k-100k, 69.9% for AGIs $100k-200k)
Taxable interest for individuals: $524 (reported on 37.1% of returns)
This zip code:
$524
Virginia:
$1,600
(% of AGI for various income ranges: 1.0% for AGIs below $25k, 0.5% for AGIs $25k-50k, 0.4% for AGIs $50k-75k, 0.2% for AGIs $75k-100k, 0.2% for AGIs $100k-200k)
Ordinary dividends: $3,088 (reported on 18.0% of returns)
Here:
$3,088
State:
$6,959
(% of AGI for various income ranges: 3.0% for AGIs below $25k, 2.1% for AGIs $25k-50k, 0.8% for AGIs $50k-75k, 0.9% for AGIs $100k-200k)
Net capital gain/loss in AGI: +$2,500 (reported on 7.9% of returns)
Here:
+$2,500
State:
+$16,672
(% of AGI for various income ranges: 0.2% for AGIs below $25k, 0.7% for AGIs $50k-75k, 0.8% for AGIs $100k-200k)
Profit/loss from business: +$9,473 (reported on 12.4% of returns)
Here:
+$9,473
State:
+$14,116
(% of AGI for various income ranges: 6.0% for AGIs below $25k, 4.7% for AGIs $25k-50k, 2.3% for AGIs $50k-75k, 2.1% for AGIs $75k-100k)
Taxable individual retirement arrangement distribution: $11,300 (reported on 12.4% of returns)
24085:
$11,300
Virginia:
$16,667
(% of AGI for various income ranges: 4.5% for AGIs below $25k, 6.0% for AGIs $25k-50k, 6.7% for AGIs $75k-100k)
Total itemized deductions: $17,809 (23% of AGI, reported on 25.8% of returns)
Here:
$17,809
State:
$26,596
Here:
22.5% of AGI
State:
20.1% of AGI
(% of AGI for various income ranges: 10.4% for AGIs $25k-50k, 10.1% for AGIs $50k-75k, 10.6% for AGIs $75k-100k, 11.1% for AGIs $100k-200k)
Charity contributions: $4,788 (reported on 18.0% of returns)
Here:
$4,788
State:
$4,443
(% of AGI for various income ranges: 1.5% for AGIs $25k-50k, 1.9% for AGIs $50k-75k, 2.6% for AGIs $75k-100k, 2.0% for AGIs $100k-200k)
Taxes paid: $5,348 (reported on 25.8% of returns)
24085:
$5,348
State:
$9,951
(% of AGI for various income ranges: 1.7% for AGIs $25k-50k, 2.6% for AGIs $50k-75k, 3.1% for AGIs $75k-100k, 4.7% for AGIs $100k-200k)
Earned income credit: $1,829 (reported on 15.7% of returns)
Here:
$1,829
State:
$2,211
(% of AGI for various income ranges: 4.4% for AGIs below $25k, 0.9% for AGIs $25k-50k)
Percentage of individuals using paid preparers for their 2012 taxes: 52.8%
Here:
53%
State:
46%
(% for various income ranges: 45.2% for AGIs below $25k, 58.3% for AGIs $25k-50k, 56.2% for AGIs $50k-75k, 55.6% for AGIs $75k-100k, 55.6% for AGIs $100k-200k)
Averages for the 2004 tax year for zip code 24085, filed in 2005:
Average Adjusted Gross Income (AGI) in 2004: $35,804 (Individual Income Tax Returns)
Here:
$35,804
State:
$56,704
Salary/wage: $35,775 (reported on 85.0% of returns)
Here:
$35,775
State:
$48,441
(% of AGI for various income ranges: 105.7% for AGIs below $10k, 74.3% for AGIs $10k-25k, 85.8% for AGIs $25k-50k, 90.3% for AGIs $50k-75k, 85.8% for AGIs $75k-100k, 76.6% for AGIs over 100k)
Taxable interest for individuals: $775 (reported on 43.5% of returns)
This zip code:
$775
Virginia:
$1,688
(% of AGI for various income ranges: 6.4% for AGIs below $10k, 1.9% for AGIs $10k-25k, 1.0% for AGIs $25k-50k, 0.7% for AGIs $50k-75k, 0.1% for AGIs $75k-100k, 0.4% for AGIs over 100k)
Taxable dividends: $1,848 (reported on 16.3% of returns)
Here:
$1,848
State:
$4,028
(% of AGI for various income ranges: 1.5% for AGIs below $10k, 0.8% for AGIs $10k-25k, 1.3% for AGIs $25k-50k, 0.3% for AGIs $50k-75k, 0.1% for AGIs $75k-100k, 1.8% for AGIs over 100k)
Net capital gain/loss: +$1,069 (reported on 8.1% of returns)
Here:
+$1,069
State:
+$14,375
(% of AGI for various income ranges: 0.3% for AGIs $10k-25k, 0.7% for AGIs $25k-50k, 0.0% for AGIs $50k-75k, -0.1% for AGIs $75k-100k)
Profit/loss from business: +$5,829 (reported on 13.8% of returns)
Here:
+$5,829
State:
+$13,342
(% of AGI for various income ranges: 7.5% for AGIs below $10k, 3.2% for AGIs $10k-25k, 3.1% for AGIs $25k-50k, 1.4% for AGIs $50k-75k, 2.7% for AGIs $75k-100k)
IRA payment deduction: $2,364 (reported on 2.5% of returns)
24085:
$2,364
Virginia:
$2,943
Total itemized deductions: $13,778 (22% of AGI, reported on 23.8% of returns)
Here:
$13,778
State:
$21,492
Here:
22.5% of AGI
State:
21.0% of AGI
(% of AGI for various income ranges: 8.1% for AGIs $10k-25k, 8.7% for AGIs $25k-50k, 7.8% for AGIs $50k-75k, 12.5% for AGIs $75k-100k, 12.8% for AGIs over 100k)
Charity contributions deductions: $2,686 (4% of AGI, reported on 17.9% of returns)
Here:
$2,686
State:
$3,794
Here:
4.1% of AGI
State:
3.5% of AGI
(% of AGI for various income ranges: 1.2% for AGIs $10k-25k, 1.0% for AGIs $25k-50k, 1.1% for AGIs $50k-75k, 1.8% for AGIs $75k-100k, 2.7% for AGIs over 100k)
Total tax: $4,071 (reported on 77.3% of returns)
24085:
$4,071
State:
$9,537
(% of AGI for various income ranges: 2.9% for AGIs below $10k, 3.8% for AGIs $10k-25k, 6.7% for AGIs $25k-50k, 9.1% for AGIs $50k-75k, 10.8% for AGIs $75k-100k, 17.1% for AGIs over 100k)
Earned income credit: $1,302 (reported on 14.5% of returns)
Here:
$1,302
State:
$1,734
Percentage of individuals using paid preparers for their 2004 taxes: 57.5%
Here:
57%
State:
52%
(% for various income ranges: 51.6% for AGIs below $10k, 56.5% for AGIs $10k-25k, 65.8% for AGIs $25k-50k, 55.7% for AGIs $50k-75k, 45.1% for AGIs $75k-100k, 55.6% for AGIs over 100k)
Household received Food Stamps/SNAP in the past 12 months: 49 Household did not receive Food Stamps/SNAP in the past 12 months: 1,055
Women who had a birth in the past 12 months: 8 (0 now married, 7 unmarried) Women who did not have a birth in the past 12 months: 269 (156 now married, 111 unmarried)
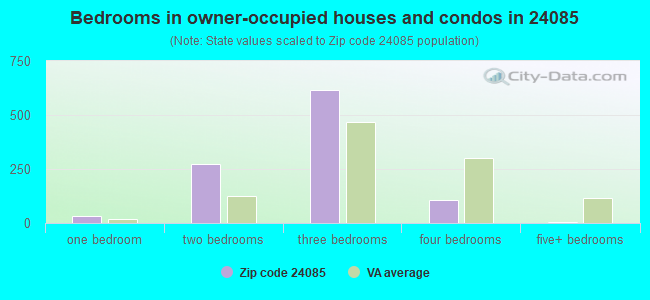
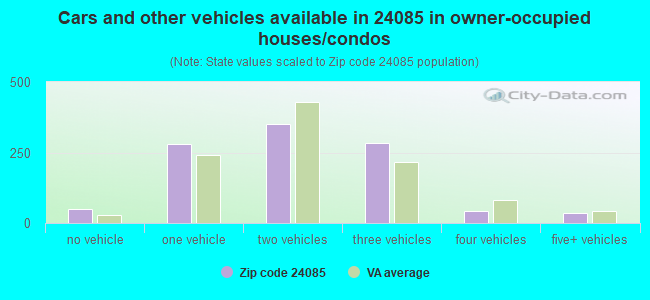
Housing units in zip code 24085 with a mortgage: 441 (34 second mortgage, 22 both second mortgage and home equity loan) Houses without a mortgage: 57
Median monthly owner costs for units with a mortgage: $1,069 Median monthly owner costs for units without a mortgage: $316
Residents with income below the poverty level in 2022:
This zip code:
14.8%
Whole state:
10.6%
Residents with income below 50% of the poverty level in 2022:
This zip code:
12.1%
Whole state:
5.2%
Median number of rooms in houses and condos:
Here:
5.7
State:
7.0
Median number of rooms in apartments:
Here:
4.2
State:
4.3
Notable locations in this zip code not listed on our city pages
Notable locations in zip code 24085: Lick Run (A), Grace Furnace (B), Rebecca Furnace (C), Roaring Run Furnace Recreation Site (D), Craig Creek Campground (E), Roaring Run Furnace (F), Silent Dell (G), Rocky Ford (H), Saltpetre Cave (I), Callie Furnace (J), Jane Furnace (K), Horton (L), Eagle Rock Volunteer Fire Department and Rescue Squad (M). Display/hide their locations on the map
Churches in zip code 24085 include: Bethel Church (A), Cedar Grove Church (B), Emmanuel Church (C), Forest Grove Church (D), Galatia Church (E), King Memorial Church (F), Locust Bottom Church (G), Longdale Church (H), Mount Bethel Church (I). Display/hide their locations on the map
Cemeteries: Piney Grove Cemetery (1), Rudisill Cemetery (2), Wesley Chapel Cemetery (3), Crawford Cemetery (4), Deisher Cemetery (5), Haden Cemetery (6), Anderson Cemetery (7). Display/hide their locations on the map
Streams, rivers, and creeks: Wolf Branch (A), Trout Run (B), Swanson Branch (C), Stull Run (D), Stony Run (E), Smith Branch (F), Sloan Branch (G), Sinking Creek (H), Shirkey Mill Branch (I). Display/hide their locations on the map
Facilities with environmental interests located in this zip code:
BOTETOURT CO - EAGLE ROCK WWT (CHURCH ST RT 43 in EAGLE ROCK, VA)
National Pollutant Discharge Elimination System NON-MAJOR (Tracking pollutant discharge elimination systems) - permit Business SIC classification: SEWERAGE SYSTEMS Alternative names: EAGLE ROCK COMMUNITY WWTP, EAGLE ROCK - WASTEWATER TREATM
Housing units lacking complete plumbing facilities: 7.6% Housing units lacking complete kitchen facilities: 6.8%
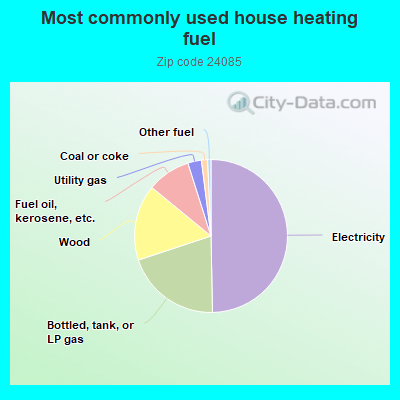
49.9%Electricity
20.3%Bottled, tank, or LP gas
16.1%Wood
9.2%Fuel oil, kerosene, etc.
2.9%Utility gas
1.3%Coal or coke
0.7%Other fuel
Population in 1990: 2,939.
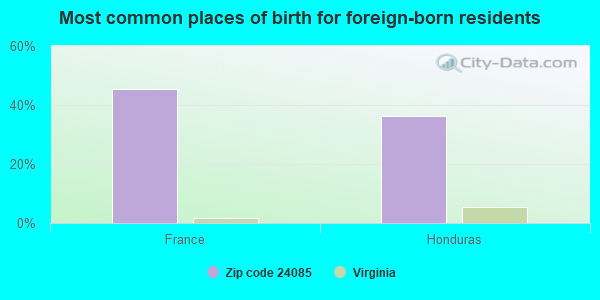
Place of birth for U.S.-born residents:
This state: 1,870
Northeast: 149
Midwest: 18
South: 206
West: 41
77% of the 24085 zip code residents lived in the same house 5 years ago. Out of people who lived in different houses, 48% lived in this county. Out of people who lived in different counties, 50% lived in Virginia.
99% of the 24085 zip code residents lived in the same house 1 year ago. Out of people who lived in different houses, 164% moved from this county.
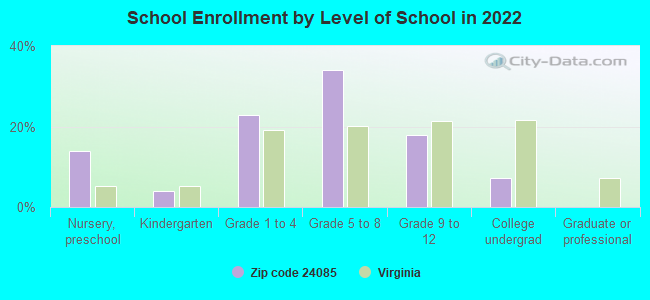
Private vs. public school enrollment:
Students in private schools in grades 1 to 8 (elementary and middle school): 51
Here:
27.6%
Virginia:
13.2%
Students in private schools in grades 9 to 12 (high school): 48
Here:
85.9%
Virginia:
10.2%
Students in private undergraduate colleges:
Here:
0.0%
Virginia:
18.7%
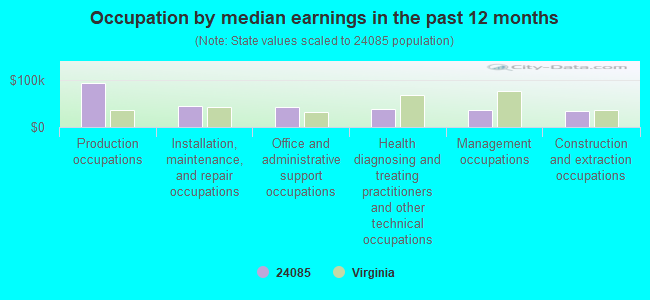
Occupation by median earnings in the past 12 months ($)
93,134Production occupations
43,449Installation, maintenance, and repair occupations
42,702Office and administrative support occupations
38,593Health diagnosing and treating practitioners and other technical occupations
36,124Management occupations
33,915Construction and extraction occupations
Top industries in this zip code by the number of employees in 2005:
Wholesale Trade: Petroleum and Petroleum Products Merchant Wholesalers (except Bulk Stations and Terminals) (5-9 employees: 1 establishment)
Administrative and Support and Waste Management and Remediation Services: Janitorial Services (5-9: 1)
Construction: Site Preparation Contractors (1-4: 2)
Health Care and Social Assistance: Child Day Care Services (1-4: 2)
Other Services (except Public Administration): Religious Organizations (1-4: 1)
Construction: Drywall and Insulation Contractors (1-4: 1)
People in group quarters in 2000:
47 people in nursing homes
Fatal accident statistics in 2014:
Fatal accident count: 1
Vehicles involved in fatal accidents: 2
Fatal accidents caused by drunken drivers: 0
Fatalities: 1
Persons involved in fatal accidents: 2
Pedestrians involved in fatal accidents: 0
Fatal accident statistics in 2013:
Fatal accident count: 1
Vehicles involved in fatal accidents: 1
Fatal accidents caused by drunken drivers: 0
Fatalities: 1
Persons involved in fatal accidents: 2
Pedestrians involved in fatal accidents: 0
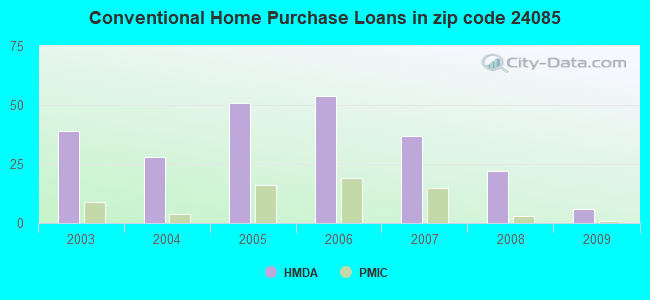
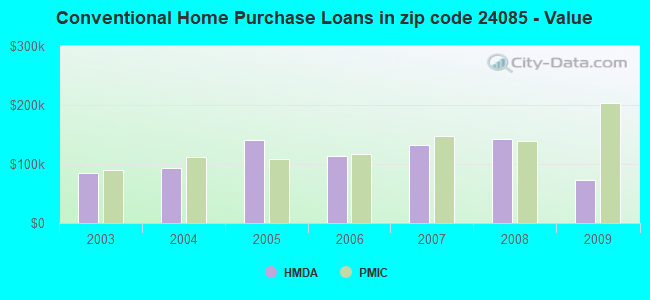
Home Mortgage Disclosure Act Aggregated Statistics For Year 2009 (Based on 2 partial tracts)
A) FHA, FSA/RHS & VA Home Purchase Loans
B) Conventional Home Purchase Loans
C) Refinancings
D) Home Improvement Loans
F) Non-occupant Loans on < 5 Family Dwellings (A B C & D)
G) Loans On Manufactured Home Dwelling (A B C & D)
Number
Average Value
Number
Average Value
Number
Average Value
Number
Average Value
Number
Average Value
Number
Average Value
LOANS ORIGINATED
12
$143,779
6
$72,077
129
$139,177
10
$24,242
6
$102,253
13
$110,273
APPLICATIONS APPROVED, NOT ACCEPTED
1
$80,810
0
$0
7
$188,760
0
$0
0
$0
0
$0
APPLICATIONS DENIED
4
$156,000
7
$73,964
40
$122,032
3
$91,280
6
$119,463
10
$115,971
APPLICATIONS WITHDRAWN
0
$0
4
$114,475
19
$134,361
4
$155,625
1
$104,750
1
$193,040
FILES CLOSED FOR INCOMPLETENESS
3
$100,757
0
$0
7
$129,119
0
$0
0
$0
1
$169,090
Aggregated Statistics For Year 2008 (Based on 2 partial tracts)
A) FHA, FSA/RHS & VA Home Purchase Loans
B) Conventional Home Purchase Loans
C) Refinancings
D) Home Improvement Loans
F) Non-occupant Loans on < 5 Family Dwellings (A B C & D)
G) Loans On Manufactured Home Dwelling (A B C & D)
Number
Average Value
Number
Average Value
Number
Average Value
Number
Average Value
Number
Average Value
Number
Average Value
LOANS ORIGINATED
10
$132,132
22
$141,614
85
$112,476
21
$17,030
12
$88,537
10
$82,452
APPLICATIONS APPROVED, NOT ACCEPTED
0
$0
0
$0
6
$114,973
3
$6,483
0
$0
0
$0
APPLICATIONS DENIED
9
$99,094
3
$60,853
49
$127,499
9
$56,697
4
$87,165
13
$103,367
APPLICATIONS WITHDRAWN
6
$113,477
1
$116,720
30
$154,877
4
$143,655
0
$0
4
$129,438
FILES CLOSED FOR INCOMPLETENESS
0
$0
0
$0
6
$142,158
0
$0
0
$0
1
$148,140
Aggregated Statistics For Year 2007 (Based on 2 partial tracts)
A) FHA, FSA/RHS & VA Home Purchase Loans
B) Conventional Home Purchase Loans
C) Refinancings
D) Home Improvement Loans
F) Non-occupant Loans on < 5 Family Dwellings (A B C & D)
G) Loans On Manufactured Home Dwelling (A B C & D)
Number
Average Value
Number
Average Value
Number
Average Value
Number
Average Value
Number
Average Value
Number
Average Value
LOANS ORIGINATED
13
$137,093
37
$132,654
103
$126,235
27
$78,921
16
$119,712
16
$80,806
APPLICATIONS APPROVED, NOT ACCEPTED
0
$0
7
$69,049
7
$169,521
1
$359,140
1
$76,320
1
$200,520
APPLICATIONS DENIED
0
$0
6
$135,923
99
$107,877
19
$62,140
3
$99,760
19
$97,345
APPLICATIONS WITHDRAWN
3
$76,317
9
$107,242
40
$134,078
3
$49,880
1
$166,100
3
$103,250
FILES CLOSED FOR INCOMPLETENESS
0
$0
3
$93,773
9
$150,638
0
$0
1
$151,140
0
$0
Aggregated Statistics For Year 2006 (Based on 2 partial tracts)
A) FHA, FSA/RHS & VA Home Purchase Loans
B) Conventional Home Purchase Loans
C) Refinancings
D) Home Improvement Loans
F) Non-occupant Loans on < 5 Family Dwellings (A B C & D)
G) Loans On Manufactured Home Dwelling (A B C & D)
Number
Average Value
Number
Average Value
Number
Average Value
Number
Average Value
Number
Average Value
Number
Average Value
LOANS ORIGINATED
12
$104,374
54
$113,228
87
$106,416
36
$26,395
22
$90,940
33
$79,264
APPLICATIONS APPROVED, NOT ACCEPTED
1
$197,520
19
$73,245
19
$178,151
3
$13,467
3
$34,917
12
$93,650
APPLICATIONS DENIED
1
$154,130
15
$59,657
76
$149,679
19
$51,272
7
$65,414
18
$77,231
APPLICATIONS WITHDRAWN
0
$0
6
$153,630
60
$127,144
4
$37,410
0
$0
3
$103,750
FILES CLOSED FOR INCOMPLETENESS
0
$0
3
$97,267
18
$98,929
0
$0
0
$0
1
$164,600
Aggregated Statistics For Year 2005 (Based on 2 partial tracts)
A) FHA, FSA/RHS & VA Home Purchase Loans
B) Conventional Home Purchase Loans
C) Refinancings
D) Home Improvement Loans
F) Non-occupant Loans on < 5 Family Dwellings (A B C & D)
G) Loans On Manufactured Home Dwelling (A B C & D)
Number
Average Value
Number
Average Value
Number
Average Value
Number
Average Value
Number
Average Value
Number
Average Value
LOANS ORIGINATED
9
$106,910
51
$140,955
109
$90,127
13
$64,805
10
$214,434
27
$70,608
APPLICATIONS APPROVED, NOT ACCEPTED
0
$0
6
$76,067
10
$130,785
7
$32,921
1
$97,270
6
$65,592
APPLICATIONS DENIED
1
$76,320
16
$76,784
90
$87,290
25
$58,300
1
$146,650
27
$72,437
APPLICATIONS WITHDRAWN
1
$152,630
6
$55,617
39
$99,261
3
$39,903
0
$0
6
$106,245
FILES CLOSED FOR INCOMPLETENESS
0
$0
0
$0
6
$67,587
1
$29,930
0
$0
0
$0
Aggregated Statistics For Year 2004 (Based on 2 partial tracts)
A) FHA, FSA/RHS & VA Home Purchase Loans
B) Conventional Home Purchase Loans
C) Refinancings
D) Home Improvement Loans
F) Non-occupant Loans on < 5 Family Dwellings (A B C & D)
G) Loans On Manufactured Home Dwelling (A B C & D)
Number
Average Value
Number
Average Value
Number
Average Value
Number
Average Value
Number
Average Value
Number
Average Value
LOANS ORIGINATED
10
$85,594
28
$93,632
127
$94,214
12
$53,372
12
$65,967
21
$67,196
APPLICATIONS APPROVED, NOT ACCEPTED
0
$0
6
$116,968
27
$74,266
3
$18,953
3
$37,910
1
$79,310
APPLICATIONS DENIED
1
$97,270
15
$72,525
111
$90,229
13
$18,762
3
$116,220
24
$76,005
APPLICATIONS WITHDRAWN
0
$0
6
$76,565
66
$101,665
0
$0
1
$172,090
9
$92,112
FILES CLOSED FOR INCOMPLETENESS
1
$73,320
1
$287,310
6
$88,537
0
$0
0
$0
0
$0
Aggregated Statistics For Year 2003 (Based on 2 partial tracts)
A) FHA, FSA/RHS & VA Home Purchase Loans
B) Conventional Home Purchase Loans
C) Refinancings
D) Home Improvement Loans
F) Non-occupant Loans on < 5 Family Dwellings (A B C & D)
Detailed PMIC statistics for the following Tracts:0401.00
2002 - 2018 National Fire Incident Reporting System (NFIRS) incidents
Based on the data from the years 2002 - 2018 the average number of fire incidents per year is 20. The highest number of reported fire incidents - 42 took place in 2010, and the least - 1 in 2003. The data has a rising trend.
When looking into fire subcategories, the most incidents belonged to: Outside Fires (40.4%), and Structure Fires (40.1%).
Fire incident types reported to NFIRS in Zip Code 24085


 Nearest zip codes: 24448, 24474, 24457, 24422, 24090, 24130.
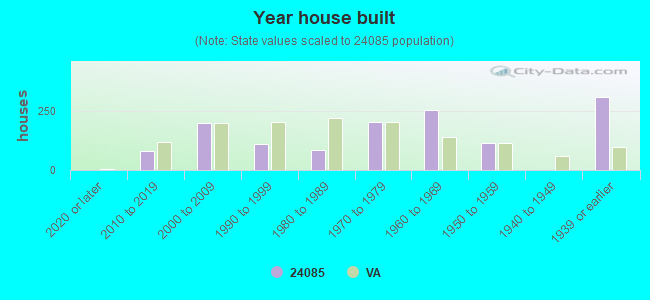


 (Students: 167, Location: 145 EAGLES NEST DR, Grades: PK-5)

 Based on the data from the years 2002 - 2018 the average number of fire incidents per year is 20. The highest number of reported fire incidents - 42 took place in 2010, and the least - 1 in 2003. The data has a rising trend.
 When looking into fire subcategories, the most incidents belonged to: Outside Fires (40.4%), and Structure Fires (40.1%).