Estimated zip code population in 2022: 2,598 Zip code population in 2010: 2,539 Zip code population in 2000: 2,429
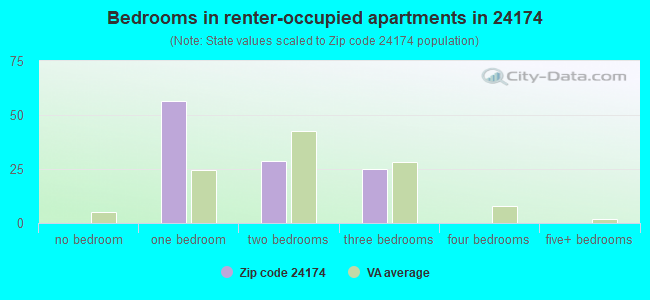
Houses and condos: 1,220 Renter-occupied apartments: 109
% of renters here:
10%
State:
33%
March 2022 cost of living index in zip code 24174: 83.1 (low, U.S. average is 100)
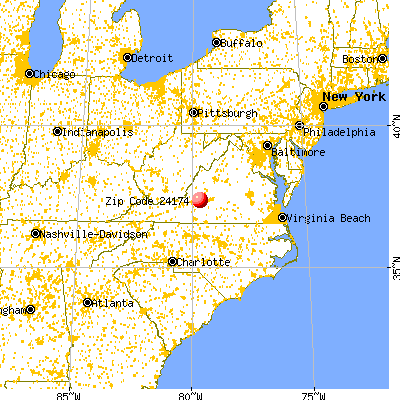
Land area: 34.2 sq. mi. Water area: 0.0 sq. mi.
Population density: 76 people per square mile
(very low).
OSM Map
General Map
Google Map
MSN Map
OSM Map
General Map
Google Map
MSN Map
OSM Map
General Map
Google Map
MSN Map
OSM Map
General Map
Google Map
MSN Map
Please wait while loading the map...
Real estate property taxes paid for housing units in 2022:
This zip code:
0.5% ($784)
Virginia:
0.7% ($2,617)
Median real estate property taxes paid for housing units with mortgages in 2022: $916 (0.5%) Median real estate property taxes paid for housing units with no mortgage in 2022: $513 (0.4%)
Business Search- 14 Million verified businesses
Males: 1,328
(51.1%)
Females: 1,270
(48.9%)
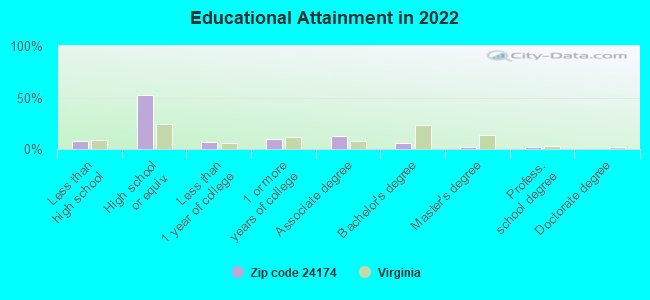
For population 25 years and over in 24174:
High school or higher: 90.9%
Bachelor's degree or higher: 10.1%
Graduate or professional degree: 4.1%
Unemployed: 3.1%
Mean travel time to work (commute): 27.3 minutes
For population 15 years and over in 24174:
Never married: 20.8%
Now married: 60.8%
Separated: 4.2%
Widowed: 3.7%
Divorced: 10.6%
Zip code 24174 compared to state average:
Median household income below state average.
Median house value below state average.
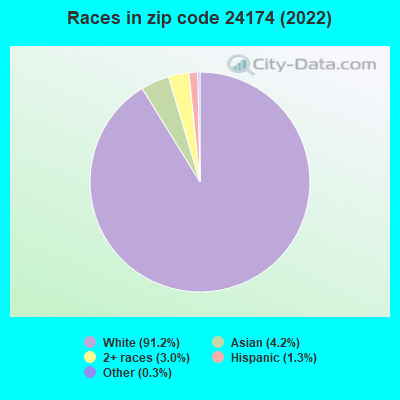
Black race population percentage significantly below state average.
Hispanic race population percentage significantly below state average.
Foreign-born population percentage significantly below state average.
Renting percentage significantly below state average.
Length of stay since moving in above state average.
Number of college students below state average.
Percentage of population with a bachelor's degree or higher significantly below state average.
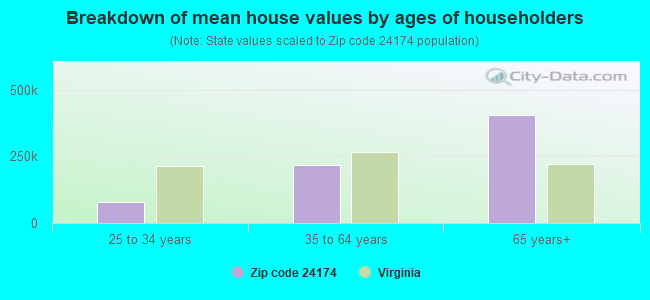
Estimated median house/condo value in 2022: $171,442
24174:
$171,442
Virginia:
$365,700
According to our research of Virginia and other state lists, there were 10 registered sex offenders living in 24174 zip code as of May 28, 2024. The ratio of all residents to sex offenders in zip code 24174 is 290 to 1. The ratio of registered sex offenders to all residents in this zip code is near the state average.
Median resident age:
This zip code:
36.9 years
Virginia median age:
39.0 years
Average household size:
This zip code:
2.4 people
Virginia:
2.5 people
Averages for the 2020 tax year for zip code 24174, filed in 2021:
Average Adjusted Gross Income (AGI) in 2020: $50,920 (Individual Income Tax Returns)
Here:
$50,920
State:
$86,446
Salary/wage: $43,810 (reported on 81.9% of returns)
Here:
$43,810
State:
$71,185
(% of AGI for various income ranges: 1031.7% for AGIs below $25k, 3518.0% for AGIs $25k-50k, 6847.5% for AGIs $50k-75k, 8986.7% for AGIs $75k-100k, 15975.0% for AGIs $100k-200k)
Taxable interest for individuals: $800 (reported on 22.9% of returns)
This zip code:
$800
Virginia:
$1,805
(% of AGI for various income ranges: 5.9% for AGIs below $25k, 5.2% for AGIs $25k-50k, 55.0% for AGIs $50k-75k, 10.0% for AGIs $75k-100k, 145.0% for AGIs $100k-200k)
Ordinary dividends: $3,745 (reported on 10.5% of returns)
Here:
$3,745
State:
$8,327
(% of AGI for various income ranges: 16.6% for AGIs below $25k, 15.2% for AGIs $25k-50k, 117.5% for AGIs $50k-75k, 308.3% for AGIs $100k-200k)
Net capital gain/loss in AGI: +$15,360 (reported on 9.5% of returns)
Here:
+$15,360
State:
+$24,644
(% of AGI for various income ranges: 22.1% for AGIs below $25k, 103.3% for AGIs $50k-75k, 2246.7% for AGIs $100k-200k)
Profit/loss from business: +$5,317 (reported on 11.4% of returns)
Here:
+$5,317
State:
+$12,836
(% of AGI for various income ranges: 119.7% for AGIs below $25k, 24.4% for AGIs $25k-50k, 161.7% for AGIs $50k-75k, 40.0% for AGIs $75k-100k)
Taxable individual retirement arrangement distribution: $18,229 (reported on 6.7% of returns)
24174:
$18,229
Virginia:
$21,535
(% of AGI for various income ranges: 204.4% for AGIs $25k-50k, 850.0% for AGIs $75k-100k)
Earned income credit: $1,995 (reported on 19.0% of returns)
Here:
$1,995
State:
$2,214
(% of AGI for various income ranges: 89.7% for AGIs below $25k, 55.6% for AGIs $25k-50k)
Percentage of individuals using paid preparers for their 2020 taxes: 97.1%
Here:
97%
State:
92%
(% for various income ranges: 97.3% for AGIs below $25k, 96.7% for AGIs $25k-50k, 94.1% for AGIs $50k-75k, 100.0% for AGIs $75k-100k, 100.0% for AGIs $100k-200k)
Averages for the 2012 tax year for zip code 24174, filed in 2013:
Average Adjusted Gross Income (AGI) in 2012: $40,142 (Individual Income Tax Returns)
Here:
$40,142
State:
$71,192
Salary/wage: $35,075 (reported on 85.8% of returns)
Here:
$35,075
State:
$59,229
(% of AGI for various income ranges: 77.6% for AGIs below $25k, 81.9% for AGIs $25k-50k, 83.4% for AGIs $50k-75k, 78.5% for AGIs $75k-100k, 44.0% for AGIs $100k-200k)
Taxable interest for individuals: $786 (reported on 26.4% of returns)
This zip code:
$786
Virginia:
$1,600
(% of AGI for various income ranges: 0.7% for AGIs below $25k, 0.5% for AGIs $25k-50k, 0.4% for AGIs $50k-75k, 0.2% for AGIs $75k-100k, 0.9% for AGIs $100k-200k)
Ordinary dividends: $2,550 (reported on 13.2% of returns)
Here:
$2,550
State:
$6,959
(% of AGI for various income ranges: 1.1% for AGIs below $25k, 0.4% for AGIs $25k-50k, 0.3% for AGIs $50k-75k, 0.5% for AGIs $75k-100k, 2.5% for AGIs $100k-200k)
Net capital gain/loss in AGI: +$6,344 (reported on 8.5% of returns)
Here:
+$6,344
State:
+$16,672
(% of AGI for various income ranges: 0.3% for AGIs $25k-50k, 7.8% for AGIs $100k-200k)
Profit/loss from business: +$4,636 (reported on 10.4% of returns)
Here:
+$4,636
State:
+$14,116
(% of AGI for various income ranges: 3.5% for AGIs below $25k, 2.3% for AGIs $25k-50k, 0.6% for AGIs $75k-100k)
Taxable individual retirement arrangement distribution: $11,575 (reported on 7.5% of returns)
24174:
$11,575
Virginia:
$16,667
(% of AGI for various income ranges: 1.6% for AGIs below $25k, 3.2% for AGIs $25k-50k, 6.1% for AGIs $75k-100k)
Total itemized deductions: $18,136 (25% of AGI, reported on 20.8% of returns)
Here:
$18,136
State:
$26,596
Here:
24.7% of AGI
State:
20.1% of AGI
(% of AGI for various income ranges: 3.6% for AGIs below $25k, 7.4% for AGIs $25k-50k, 9.6% for AGIs $50k-75k, 10.2% for AGIs $75k-100k, 16.4% for AGIs $100k-200k)
Charity contributions: $2,994 (reported on 16.0% of returns)
Here:
$2,994
State:
$4,443
(% of AGI for various income ranges: 1.0% for AGIs $25k-50k, 0.9% for AGIs $50k-75k, 1.6% for AGIs $75k-100k, 2.6% for AGIs $100k-200k)
Taxes paid: $4,527 (reported on 20.8% of returns)
24174:
$4,527
State:
$9,951
(% of AGI for various income ranges: 0.5% for AGIs below $25k, 1.5% for AGIs $25k-50k, 2.2% for AGIs $50k-75k, 3.0% for AGIs $75k-100k, 4.9% for AGIs $100k-200k)
Earned income credit: $2,055 (reported on 18.9% of returns)
Here:
$2,055
State:
$2,211
(% of AGI for various income ranges: 5.3% for AGIs below $25k, 0.9% for AGIs $25k-50k)
Percentage of individuals using paid preparers for their 2012 taxes: 50.0%
Here:
50%
State:
46%
(% for various income ranges: 47.6% for AGIs below $25k, 48.5% for AGIs $25k-50k, 50.0% for AGIs $50k-75k, 55.6% for AGIs $75k-100k, 75.0% for AGIs $100k-200k)
Averages for the 2004 tax year for zip code 24174, filed in 2005:
Average Adjusted Gross Income (AGI) in 2004: $35,516 (Individual Income Tax Returns)
Here:
$35,516
State:
$56,704
Salary/wage: $31,126 (reported on 89.1% of returns)
Here:
$31,126
State:
$48,441
(% of AGI for various income ranges: 81.5% for AGIs below $10k, 81.6% for AGIs $10k-25k, 87.3% for AGIs $25k-50k, 84.0% for AGIs $50k-75k, 74.6% for AGIs $75k-100k, 48.7% for AGIs over 100k)
Taxable interest for individuals: $1,099 (reported on 31.9% of returns)
This zip code:
$1,099
Virginia:
$1,688
(% of AGI for various income ranges: 2.7% for AGIs below $10k, 1.1% for AGIs $10k-25k, 0.3% for AGIs $25k-50k, 0.6% for AGIs $50k-75k, 0.3% for AGIs $75k-100k, 3.1% for AGIs over 100k)
Taxable dividends: $1,700 (reported on 15.3% of returns)
Here:
$1,700
State:
$4,028
(% of AGI for various income ranges: 2.5% for AGIs below $10k, 0.7% for AGIs $10k-25k, 0.3% for AGIs $25k-50k, 0.3% for AGIs $50k-75k, 0.2% for AGIs $75k-100k, 2.3% for AGIs over 100k)
Net capital gain/loss: +$5,286 (reported on 10.0% of returns)
Here:
+$5,286
State:
+$14,375
(% of AGI for various income ranges: -1.5% for AGIs below $10k, -0.0% for AGIs $10k-25k, 0.1% for AGIs $25k-50k, 0.2% for AGIs $50k-75k, 1.4% for AGIs $75k-100k, 8.1% for AGIs over 100k)
Profit/loss from business: +$7,322 (reported on 11.6% of returns)
Here:
+$7,322
State:
+$13,342
(% of AGI for various income ranges: 6.8% for AGIs below $10k, 4.1% for AGIs $10k-25k, 3.3% for AGIs $25k-50k, 0.3% for AGIs $50k-75k, 4.6% for AGIs $75k-100k)
IRA payment deduction: $2,304 (reported on 2.2% of returns)
24174:
$2,304
Virginia:
$2,943
Total itemized deductions: $13,721 (21% of AGI, reported on 24.0% of returns)
Here:
$13,721
State:
$21,492
Here:
21.1% of AGI
State:
21.0% of AGI
(% of AGI for various income ranges: 4.4% for AGIs $10k-25k, 9.2% for AGIs $25k-50k, 11.2% for AGIs $50k-75k, 10.9% for AGIs $75k-100k, 11.3% for AGIs over 100k)
Charity contributions deductions: $2,635 (4% of AGI, reported on 18.8% of returns)
Here:
$2,635
State:
$3,794
Here:
3.7% of AGI
State:
3.5% of AGI
(% of AGI for various income ranges: 0.3% for AGIs $10k-25k, 0.9% for AGIs $25k-50k, 1.8% for AGIs $50k-75k, 1.2% for AGIs $75k-100k, 3.1% for AGIs over 100k)
Total tax: $4,130 (reported on 75.0% of returns)
24174:
$4,130
State:
$9,537
(% of AGI for various income ranges: 2.3% for AGIs below $10k, 4.2% for AGIs $10k-25k, 6.6% for AGIs $25k-50k, 8.3% for AGIs $50k-75k, 11.2% for AGIs $75k-100k, 17.3% for AGIs over 100k)
Earned income credit: $1,610 (reported on 19.6% of returns)
Here:
$1,610
State:
$1,734
Percentage of individuals using paid preparers for their 2004 taxes: 58.9%
Here:
59%
State:
52%
(% for various income ranges: 49.7% for AGIs below $10k, 58.4% for AGIs $10k-25k, 59.6% for AGIs $25k-50k, 59.0% for AGIs $50k-75k, 71.1% for AGIs $75k-100k, 87.9% for AGIs over 100k)
Household received Food Stamps/SNAP in the past 12 months: 144 Household did not receive Food Stamps/SNAP in the past 12 months: 961
Women who had a birth in the past 12 months: 22 (22 now married, 0 unmarried) Women who did not have a birth in the past 12 months: 600 (296 now married, 301 unmarried)
Housing units in zip code 24174 with a mortgage: 605 (114 second mortgage, 10 home equity loan, 84 both second mortgage and home equity loan) Median monthly owner costs for units with a mortgage: $1,043 Median monthly owner costs for units without a mortgage: $381
Residents with income below the poverty level in 2022:
This zip code:
18.9%
Whole state:
10.6%
Residents with income below 50% of the poverty level in 2022:
This zip code:
10.4%
Whole state:
5.2%
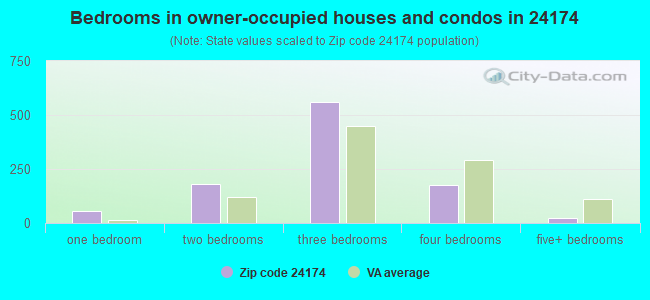
Median number of rooms in houses and condos:
Here:
5.5
State:
7.0
Median number of rooms in apartments:
Here:
4.7
State:
4.3
Notable locations in this zip code not listed on our city pages
Churches in zip code 24174 include: Cool Spring Church (A), Thaxton Church (B), Epworth Church (C), Holiness Church (D), Shady Grove Church (E), Union Methodist Church (F). Display/hide their locations on the map
In group quarters: 10 (-1 institutionalized population)
Size of family households: 347 2-persons, 87 3-persons, 157 4-persons, 100 5-persons, 34 6-persons
Size of nonfamily households: 347 1-person, 22 2-persons
300 married couples with children.
92 single-parent households (87 men, 5 women).
94.0% of residents of 24174 zip code speak English at home.
1.0% of residents speak Spanish at home (84% very well, 16% well).
2.0% of residents speak other Indo-European language at home (100% very well).
2.3% of residents speak Asian or Pacific Island language at home (100% very well).
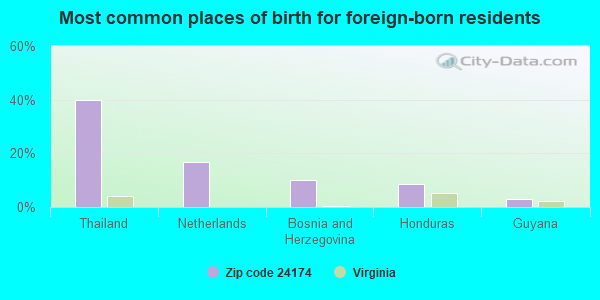
Foreign born population: 134 (5.2%) (75.2% of them are naturalized citizens)
This zip code:
5.2%
Whole state:
12.7%
40%Thailand
17%Netherlands
10%Bosnia and Herzegovina
8%Honduras
3%Guyana
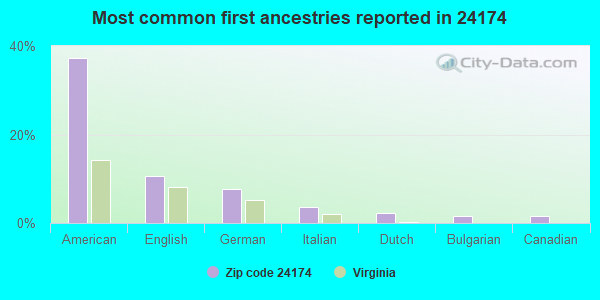
37%American
11%English
8%German
4%Italian
2%Dutch
2%Bulgarian
2%Canadian
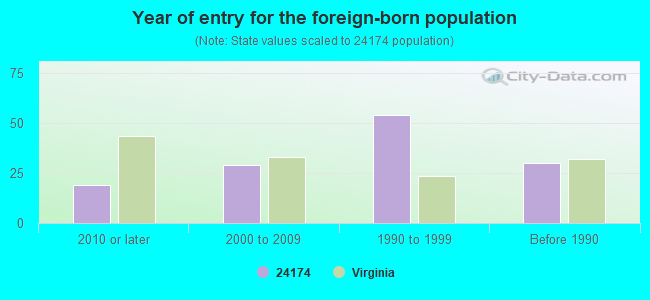
Year of entry for the foreign-born population
192010 or later
292000 to 2009
541990 to 1999
30Before 1990
Public elementary/middle school in in zip code 24174 not listed on the city page:
THAXTON ELEM(Location: 1245 THAXTON SCHOOL RD, Grades: PK-6)
Facilities with environmental interests located in this zip code:
BEDFORD CO - THAXTON ELEMENTARY SCHOOL (RT 681 & 831 in THAXTON, VA)
AIR MINOR (AIRS/AFS) STATE MASTER (Virginia pollutants databases) - CEDS-30744, AIR PROGRAM National Pollutant Discharge Elimination System NON-MAJOR (Tracking pollutant discharge elimination systems) - permit Business SIC and NAICS classification: ELEMENTARY AND SECONDARY SCHOOLS Alternative names: BEDFORD CO.SCHOOL BOARD, BEDFORD COUNTY SCHOOL BOARD THAXTON ELEM, THAXTON ELEM. SCHOOL
Housing units lacking complete plumbing facilities: 4.9% Housing units lacking complete kitchen facilities: 4.6%
66.4%Electricity
13.6%Bottled, tank, or LP gas
9.6%Fuel oil, kerosene, etc.
7.5%Wood
2.5%Utility gas
0.6%No fuel used
Population in 1990: 1,136. Population change in the 1990s: +1,293 (+113.8%).
Place of birth for U.S.-born residents:
This state: 2,069
Northeast: 217
Midwest: 18
South: 119
West: 18
56% of the 24174 zip code residents lived in the same house 5 years ago. Out of people who lived in different houses, 35% lived in this county. Out of people who lived in different counties, 50% lived in Virginia.
93% of the 24174 zip code residents lived in the same house 1 year ago. Out of people who lived in different houses, 9% moved from this county. Out of people who lived in different houses, 90% moved from different county within same state. Out of people who lived in different houses, 8% moved from different state.
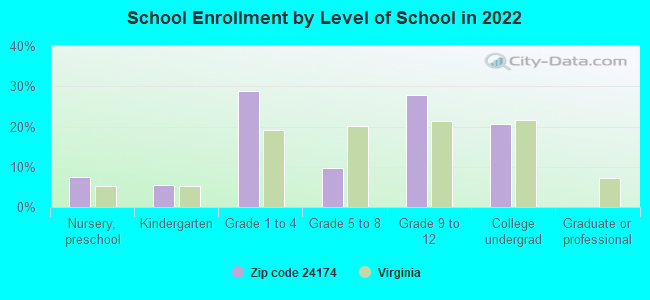
Private vs. public school enrollment:
Students in private schools in grades 1 to 8 (elementary and middle school):
Here:
0.0%
Virginia:
13.2%
Students in private schools in grades 9 to 12 (high school):
Here:
0.0%
Virginia:
10.2%
Students in private undergraduate colleges: 10
Here:
13.1%
Virginia:
18.7%
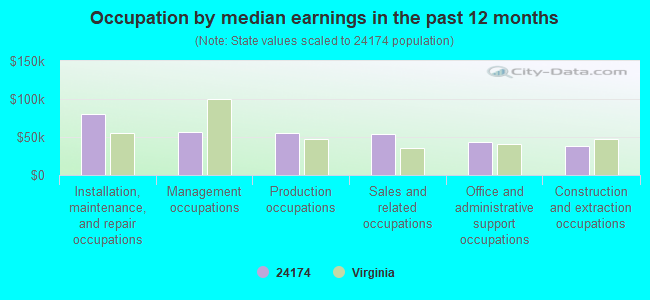
Occupation by median earnings in the past 12 months ($)
80,073Installation, maintenance, and repair occupations
56,162Management occupations
55,056Production occupations
53,976Sales and related occupations
44,076Office and administrative support occupations
37,712Construction and extraction occupations
Companies with federal contracts located in this zip code:
WELDEX SALES CORPORATION (1103 IRVING RD in THAXTON, VA)
$17,365 with Navy for Maintenance, Repair or Alteration of Real Property -- Other Non-Building Facilities. Signed on 2005-09-30. Completion date: 2006-09-30.
Top industries in this zip code by the number of employees in 2005:
Construction: Poured Concrete Foundation and Structure Contractors (10-19 employees: 1 establishment)
Wholesale Trade: Tobacco and Tobacco Product Merchant Wholesalers (10-19: 1)
Wholesale Trade: Electrical Apparatus and Equipment, Wiring Supplies, and Related Equipment Merchant Wholesalers (10-19: 1)
Other Services (except Public Administration): Religious Organizations (5-9: 2)
Wholesale Trade: Recyclable Material Merchant Wholesalers (5-9: 1)
Finance and Insurance: Mortgage and Nonmortgage Loan Brokers (5-9: 1)
Construction: New Single-Family Housing Construction (except Operative Builders) (5-9: 1)
People in group quarters in 2010:
2 people in group homes intended for adults
People in group quarters in 2000:
6 people in homes for the mentally retarded
Fatal accident statistics in 2014:
Fatal accident count: 1
Vehicles involved in fatal accidents: 2
Fatal accidents caused by drunken drivers: 1
Fatalities: 1
Persons involved in fatal accidents: 3
Pedestrians involved in fatal accidents: 0
Fatal accident statistics in 2013:
Fatal accident count: 1
Vehicles involved in fatal accidents: 1
Fatal accidents caused by drunken drivers: 0
Fatalities: 1
Persons involved in fatal accidents: 1
Pedestrians involved in fatal accidents: 1
Home Mortgage Disclosure Act Aggregated Statistics For Year 2009 (Based on 8 partial tracts)
A) FHA, FSA/RHS & VA Home Purchase Loans
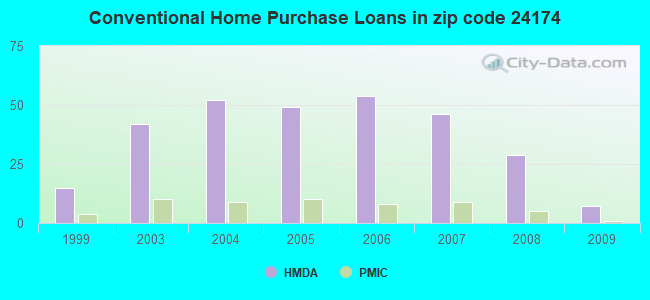
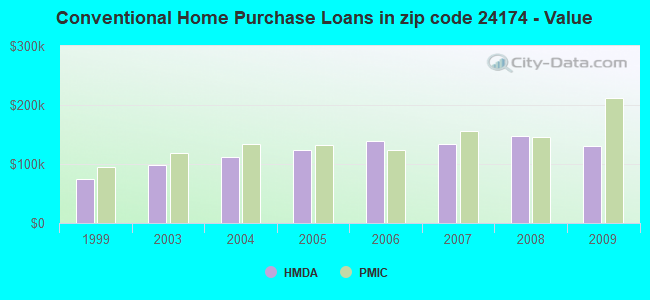
B) Conventional Home Purchase Loans
C) Refinancings
D) Home Improvement Loans
F) Non-occupant Loans on < 5 Family Dwellings (A B C & D)
G) Loans On Manufactured Home Dwelling (A B C & D)
Number
Average Value
Number
Average Value
Number
Average Value
Number
Average Value
Number
Average Value
Number
Average Value
LOANS ORIGINATED
15
$133,093
7
$129,969
88
$157,286
6
$35,848
2
$69,680
10
$100,120
APPLICATIONS APPROVED, NOT ACCEPTED
1
$71,680
2
$84,465
5
$227,826
0
$0
1
$114,430
2
$95,995
APPLICATIONS DENIED
3
$146,830
4
$119,280
38
$158,756
5
$30,712
1
$111,980
7
$95,649
APPLICATIONS WITHDRAWN
2
$127,835
2
$150,510
18
$158,568
0
$0
0
$0
2
$120,275
FILES CLOSED FOR INCOMPLETENESS
2
$166,970
0
$0
5
$137,144
1
$52,610
0
$0
1
$139,580
Aggregated Statistics For Year 2008 (Based on 8 partial tracts)
A) FHA, FSA/RHS & VA Home Purchase Loans
B) Conventional Home Purchase Loans
C) Refinancings
D) Home Improvement Loans
F) Non-occupant Loans on < 5 Family Dwellings (A B C & D)
G) Loans On Manufactured Home Dwelling (A B C & D)
Number
Average Value
Number
Average Value
Number
Average Value
Number
Average Value
Number
Average Value
Number
Average Value
LOANS ORIGINATED
16
$130,951
29
$146,843
78
$137,174
12
$30,657
8
$100,050
20
$86,376
APPLICATIONS APPROVED, NOT ACCEPTED
0
$0
2
$112,900
10
$173,737
1
$38,230
0
$0
1
$74,090
APPLICATIONS DENIED
2
$121,430
3
$139,477
55
$143,661
13
$69,172
1
$34,530
14
$89,762
APPLICATIONS WITHDRAWN
1
$166,120
5
$122,432
21
$160,854
5
$75,418
1
$102,300
4
$112,140
FILES CLOSED FOR INCOMPLETENESS
0
$0
1
$144,740
4
$149,132
1
$38,650
1
$62,560
0
$0
Aggregated Statistics For Year 2007 (Based on 8 partial tracts)
A) FHA, FSA/RHS & VA Home Purchase Loans
B) Conventional Home Purchase Loans
C) Refinancings
D) Home Improvement Loans
F) Non-occupant Loans on < 5 Family Dwellings (A B C & D)
G) Loans On Manufactured Home Dwelling (A B C & D)
Number
Average Value
Number
Average Value
Number
Average Value
Number
Average Value
Number
Average Value
Number
Average Value
LOANS ORIGINATED
12
$128,039
46
$134,609
87
$130,963
20
$66,320
5
$156,262
25
$87,300
APPLICATIONS APPROVED, NOT ACCEPTED
0
$0
5
$147,524
18
$118,800
2
$19,910
2
$121,830
3
$73,583
APPLICATIONS DENIED
2
$148,495
8
$120,645
69
$129,893
16
$48,739
4
$111,500
16
$70,784
APPLICATIONS WITHDRAWN
1
$174,100
5
$155,764
43
$133,437
7
$62,601
2
$116,450
8
$84,024
FILES CLOSED FOR INCOMPLETENESS
0
$0
2
$113,480
11
$162,976
0
$0
0
$0
0
$0
Aggregated Statistics For Year 2006 (Based on 8 partial tracts)
A) FHA, FSA/RHS & VA Home Purchase Loans
B) Conventional Home Purchase Loans
C) Refinancings
D) Home Improvement Loans
F) Non-occupant Loans on < 5 Family Dwellings (A B C & D)
G) Loans On Manufactured Home Dwelling (A B C & D)
Number
Average Value
Number
Average Value
Number
Average Value
Number
Average Value
Number
Average Value
Number
Average Value
LOANS ORIGINATED
11
$112,410
54
$139,650
94
$127,128
13
$42,755
7
$168,093
23
$84,060
APPLICATIONS APPROVED, NOT ACCEPTED
0
$0
8
$83,810
19
$114,514
3
$68,553
2
$47,155
6
$62,872
APPLICATIONS DENIED
2
$134,140
14
$99,997
74
$115,467
21
$33,271
2
$100,510
25
$76,745
APPLICATIONS WITHDRAWN
2
$120,390
7
$92,333
44
$130,221
3
$47,773
2
$88,635
5
$74,112
FILES CLOSED FOR INCOMPLETENESS
0
$0
1
$168,830
9
$128,872
1
$20,710
1
$56,660
0
$0
Aggregated Statistics For Year 2005 (Based on 8 partial tracts)
A) FHA, FSA/RHS & VA Home Purchase Loans
B) Conventional Home Purchase Loans
C) Refinancings
D) Home Improvement Loans
F) Non-occupant Loans on < 5 Family Dwellings (A B C & D)
G) Loans On Manufactured Home Dwelling (A B C & D)
Number
Average Value
Number
Average Value
Number
Average Value
Number
Average Value
Number
Average Value
Number
Average Value
LOANS ORIGINATED
10
$105,387
49
$123,437
86
$109,004
14
$67,597
9
$99,490
25
$75,325
APPLICATIONS APPROVED, NOT ACCEPTED
1
$117,490
10
$65,835
22
$81,885
3
$30,207
2
$47,025
11
$56,021
APPLICATIONS DENIED
2
$114,080
16
$90,568
76
$103,512
14
$34,462
2
$186,145
29
$80,473
APPLICATIONS WITHDRAWN
0
$0
3
$119,810
47
$107,264
3
$61,100
1
$128,150
12
$83,806
FILES CLOSED FOR INCOMPLETENESS
1
$43,430
1
$154,630
6
$118,390
1
$31,650
0
$0
1
$57,690
Aggregated Statistics For Year 2004 (Based on 8 partial tracts)
A) FHA, FSA/RHS & VA Home Purchase Loans
B) Conventional Home Purchase Loans
C) Refinancings
D) Home Improvement Loans
F) Non-occupant Loans on < 5 Family Dwellings (A B C & D)
G) Loans On Manufactured Home Dwelling (A B C & D)
Number
Average Value
Number
Average Value
Number
Average Value
Number
Average Value
Number
Average Value
Number
Average Value
LOANS ORIGINATED
14
$91,080
52
$112,373
91
$96,254
18
$37,795
7
$108,339
26
$71,417
APPLICATIONS APPROVED, NOT ACCEPTED
1
$70,670
8
$80,831
24
$91,467
2
$26,420
2
$91,085
8
$68,964
APPLICATIONS DENIED
2
$59,235
18
$82,575
80
$98,798
15
$23,140
3
$73,563
28
$68,779
APPLICATIONS WITHDRAWN
0
$0
5
$142,258
48
$104,951
5
$32,672
1
$100,980
8
$82,434
FILES CLOSED FOR INCOMPLETENESS
0
$0
1
$213,850
6
$109,373
1
$64,390
0
$0
0
$0
Aggregated Statistics For Year 2003 (Based on 8 partial tracts)
A) FHA, FSA/RHS & VA Home Purchase Loans
B) Conventional Home Purchase Loans
C) Refinancings
D) Home Improvement Loans
F) Non-occupant Loans on < 5 Family Dwellings (A B C & D)
Number
Average Value
Number
Average Value
Number
Average Value
Number
Average Value
Number
Average Value
LOANS ORIGINATED
14
$103,854
42
$98,979
153
$100,410
26
$81,506
8
$89,268
APPLICATIONS APPROVED, NOT ACCEPTED
0
$0
6
$61,370
23
$83,284
1
$4,890
1
$64,130
APPLICATIONS DENIED
1
$52,650
24
$66,210
67
$94,268
8
$26,564
2
$119,265
APPLICATIONS WITHDRAWN
3
$104,043
3
$162,000
40
$100,298
2
$98,660
0
$0
FILES CLOSED FOR INCOMPLETENESS
0
$0
1
$94,910
6
$119,548
0
$0
0
$0
Aggregated Statistics For Year 1999 (Based on 1 partial tract)
A) FHA, FSA/RHS & VA Home Purchase Loans
B) Conventional Home Purchase Loans
C) Refinancings
D) Home Improvement Loans
F) Non-occupant Loans on < 5 Family Dwellings (A B C & D)
2002 - 2018 National Fire Incident Reporting System (NFIRS) incidents
According to the data from the years 2002 - 2018 the average number of fire incidents per year is 16. The highest number of reported fires - 31 took place in 2006, and the least - 5 in 2011. The data has a growing trend.
When looking into fire subcategories, the most reports belonged to: Structure Fires (46.6%), and Outside Fires (37.1%).
Fire incident types reported to NFIRS in Zip Code 24174


 Nearest zip codes: 24122, 24064, 24095, 24179, 24523, 24121.


 (Location: 1245 THAXTON SCHOOL RD, Grades: PK-6)


 According to the data from the years 2002 - 2018 the average number of fire incidents per year is 16. The highest number of reported fires - 31 took place in 2006, and the least - 5 in 2011. The data has a growing trend.
 When looking into fire subcategories, the most reports belonged to: Structure Fires (46.6%), and Outside Fires (37.1%).