Estimated zip code population in 2022: 7,935 Zip code population in 2010: 8,818 Zip code population in 2000: 8,371
Houses and condos: 3,511 Renter-occupied apartments: 328
% of renters here:
11%
State:
33%
March 2022 cost of living index in zip code 24175: 84.9 (less than average, U.S. average is 100)
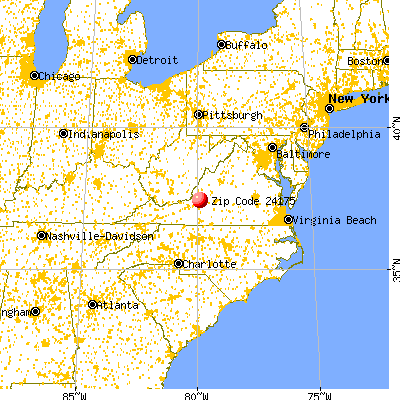
Land area: 72.0 sq. mi. Water area: 0.2 sq. mi.
Population density: 110 people per square mile
(very low).
OSM Map
General Map
Google Map
MSN Map
OSM Map
General Map
Google Map
MSN Map
OSM Map
General Map
Google Map
MSN Map
OSM Map
General Map
Google Map
MSN Map
Please wait while loading the map...
Real estate property taxes paid for housing units in 2022:
This zip code:
0.6% ($1,802)
Virginia:
0.7% ($2,617)
Median real estate property taxes paid for housing units with mortgages in 2022: $1,810 (0.6%) Median real estate property taxes paid for housing units with no mortgage in 2022: $1,840 (0.7%)
Business Search- 14 Million verified businesses
Males: 3,824
(48.2%)
Females: 4,110
(51.8%)
For population 25 years and over in 24175:
High school or higher: 95.2%
Bachelor's degree or higher: 29.9%
Graduate or professional degree: 12.4%
Unemployed: 0.8%
Mean travel time to work (commute): 23.4 minutes
For population 15 years and over in 24175:
Never married: 24.9%
Now married: 60.2%
Separated: 1.7%
Widowed: 3.6%
Divorced: 9.5%
Zip code 24175 compared to state average:
Unemployed percentage significantly below state average.
Black race population percentage significantly below state average.
Hispanic race population percentage significantly below state average.
Median age significantly above state average.
Foreign-born population percentage significantly below state average.
Renting percentage significantly below state average.
Length of stay since moving in significantly above state average.
Estimated median house/condo value in 2022: $287,028
24175:
$287,028
Virginia:
$365,700
According to our research of Virginia and other state lists, there were 16 registered sex offenders living in 24175 zip code as of May 28, 2024. The ratio of all residents to sex offenders in zip code 24175 is 507 to 1. The ratio of registered sex offenders to all residents in this zip code is lower than the state average.
Median resident age:
This zip code:
49.7 years
Virginia median age:
39.0 years
Average household size:
This zip code:
2.6 people
Virginia:
2.5 people
Averages for the 2020 tax year for zip code 24175, filed in 2021:
Average Adjusted Gross Income (AGI) in 2020: $73,423 (Individual Income Tax Returns)
Here:
$73,423
State:
$86,446
Salary/wage: $63,693 (reported on 79.5% of returns)
Here:
$63,693
State:
$71,185
(% of AGI for various income ranges: 1084.3% for AGIs below $25k, 3373.7% for AGIs $25k-50k, 5891.4% for AGIs $50k-75k, 9190.0% for AGIs $75k-100k, 16911.1% for AGIs $100k-200k, 57488.3% for AGIs over 200k)
Taxable interest for individuals: $1,521 (reported on 36.2% of returns)
This zip code:
$1,521
Virginia:
$1,805
(% of AGI for various income ranges: 26.5% for AGIs below $25k, 24.0% for AGIs $25k-50k, 75.2% for AGIs $50k-75k, 71.0% for AGIs $75k-100k, 177.7% for AGIs $100k-200k, 693.3% for AGIs over 200k)
Ordinary dividends: $5,323 (reported on 25.6% of returns)
Here:
$5,323
State:
$8,327
(% of AGI for various income ranges: 41.8% for AGIs below $25k, 74.1% for AGIs $25k-50k, 123.2% for AGIs $50k-75k, 190.0% for AGIs $75k-100k, 432.6% for AGIs $100k-200k, 2318.3% for AGIs over 200k)
Net capital gain/loss in AGI: +$10,709 (reported on 21.0% of returns)
Here:
+$10,709
State:
+$24,644
(% of AGI for various income ranges: 17.9% for AGIs below $25k, 77.5% for AGIs $25k-50k, 65.7% for AGIs $50k-75k, 207.7% for AGIs $75k-100k, 711.1% for AGIs $100k-200k, 6481.7% for AGIs over 200k)
Profit/loss from business: +$11,432 (reported on 14.6% of returns)
Here:
+$11,432
State:
+$12,836
(% of AGI for various income ranges: 121.9% for AGIs below $25k, 118.3% for AGIs $25k-50k, 169.1% for AGIs $50k-75k, 167.4% for AGIs $75k-100k, 337.4% for AGIs $100k-200k, 3406.7% for AGIs over 200k)
Taxable individual retirement arrangement distribution: $19,165 (reported on 13.1% of returns)
24175:
$19,165
Virginia:
$21,535
(% of AGI for various income ranges: 99.6% for AGIs below $25k, 138.7% for AGIs $25k-50k, 229.5% for AGIs $50k-75k, 509.0% for AGIs $75k-100k, 909.8% for AGIs $100k-200k, 2198.3% for AGIs over 200k)
Total itemized deductions: $30,576 (reported on 9.5% of returns)
Here:
$30,576
State:
$33,287
(% of AGI for various income ranges: 209.2% for AGIs $25k-50k, 310.7% for AGIs $50k-75k, 407.4% for AGIs $75k-100k, 887.9% for AGIs $100k-200k, 5320.0% for AGIs over 200k)
Charity contributions: $11,997 (reported on 7.9% of returns)
Here:
$11,997
State:
$10,381
(% of AGI for various income ranges: 33.2% for AGIs $25k-50k, 84.1% for AGIs $50k-75k, 121.0% for AGIs $75k-100k, 273.6% for AGIs $100k-200k, 2465.0% for AGIs over 200k)
Taxes paid: $7,392 (reported on 9.5% of returns)
24175:
$7,392
State:
$8,284
(% of AGI for various income ranges: 24.9% for AGIs $25k-50k, 55.7% for AGIs $50k-75k, 98.7% for AGIs $75k-100k, 263.2% for AGIs $100k-200k, 1316.7% for AGIs over 200k)
Earned income credit: $2,014 (reported on 9.2% of returns)
Here:
$2,014
State:
$2,214
(% of AGI for various income ranges: 54.0% for AGIs below $25k, 53.3% for AGIs $25k-50k)
Percentage of individuals using paid preparers for their 2020 taxes: 94.4%
Here:
94%
State:
92%
(% for various income ranges: 92.4% for AGIs below $25k, 95.1% for AGIs $25k-50k, 94.9% for AGIs $50k-75k, 95.7% for AGIs $75k-100k, 95.0% for AGIs $100k-200k, 94.4% for AGIs over 200k)
Averages for the 2012 tax year for zip code 24175, filed in 2013:
Average Adjusted Gross Income (AGI) in 2012: $61,024 (Individual Income Tax Returns)
Here:
$61,024
State:
$71,192
Salary/wage: $52,410 (reported on 83.7% of returns)
Here:
$52,410
State:
$59,229
(% of AGI for various income ranges: 71.7% for AGIs below $25k, 75.2% for AGIs $25k-50k, 72.4% for AGIs $50k-75k, 77.2% for AGIs $75k-100k, 74.6% for AGIs $100k-200k, 56.9% for AGIs over 200k)
Taxable interest for individuals: $1,017 (reported on 41.4% of returns)
This zip code:
$1,017
Virginia:
$1,600
(% of AGI for various income ranges: 1.7% for AGIs below $25k, 0.9% for AGIs $25k-50k, 0.7% for AGIs $50k-75k, 0.5% for AGIs $75k-100k, 0.5% for AGIs $100k-200k, 0.6% for AGIs over 200k)
Ordinary dividends: $3,668 (reported on 25.7% of returns)
Here:
$3,668
State:
$6,959
(% of AGI for various income ranges: 2.3% for AGIs below $25k, 1.0% for AGIs $25k-50k, 1.2% for AGIs $50k-75k, 1.2% for AGIs $75k-100k, 2.0% for AGIs $100k-200k, 1.7% for AGIs over 200k)
Net capital gain/loss in AGI: +$8,277 (reported on 17.4% of returns)
Here:
+$8,277
State:
+$16,672
(% of AGI for various income ranges: 0.3% for AGIs $25k-50k, 0.4% for AGIs $50k-75k, 0.8% for AGIs $75k-100k, 1.6% for AGIs $100k-200k, 10.3% for AGIs over 200k)
Profit/loss from business: +$8,291 (reported on 14.7% of returns)
Here:
+$8,291
State:
+$14,116
(% of AGI for various income ranges: 6.7% for AGIs below $25k, 2.3% for AGIs $25k-50k, 2.1% for AGIs $50k-75k, 1.4% for AGIs $75k-100k, 2.3% for AGIs $100k-200k)
Taxable individual retirement arrangement distribution: $13,951 (reported on 14.2% of returns)
24175:
$13,951
Virginia:
$16,667
(% of AGI for various income ranges: 4.9% for AGIs below $25k, 3.3% for AGIs $25k-50k, 3.4% for AGIs $50k-75k, 3.6% for AGIs $75k-100k, 4.3% for AGIs $100k-200k)
Total itemized deductions: $21,594 (21% of AGI, reported on 39.6% of returns)
Here:
$21,594
State:
$26,596
Here:
21.4% of AGI
State:
20.1% of AGI
(% of AGI for various income ranges: 9.5% for AGIs below $25k, 11.0% for AGIs $25k-50k, 14.3% for AGIs $50k-75k, 16.6% for AGIs $75k-100k, 14.5% for AGIs $100k-200k, 14.0% for AGIs over 200k)
Charity contributions: $4,798 (reported on 32.6% of returns)
Here:
$4,798
State:
$4,443
(% of AGI for various income ranges: 1.2% for AGIs below $25k, 1.5% for AGIs $25k-50k, 2.1% for AGIs $50k-75k, 2.8% for AGIs $75k-100k, 2.9% for AGIs $100k-200k, 3.8% for AGIs over 200k)
Taxes paid: $6,811 (reported on 39.6% of returns)
24175:
$6,811
State:
$9,951
(% of AGI for various income ranges: 1.4% for AGIs below $25k, 2.4% for AGIs $25k-50k, 3.4% for AGIs $50k-75k, 4.6% for AGIs $75k-100k, 5.6% for AGIs $100k-200k, 5.9% for AGIs over 200k)
Earned income credit: $1,973 (reported on 11.8% of returns)
Here:
$1,973
State:
$2,211
(% of AGI for various income ranges: 4.2% for AGIs below $25k, 0.9% for AGIs $25k-50k)
Percentage of individuals using paid preparers for their 2012 taxes: 50.3%
Here:
50%
State:
46%
(% for various income ranges: 44.5% for AGIs below $25k, 50.6% for AGIs $25k-50k, 55.2% for AGIs $50k-75k, 53.1% for AGIs $75k-100k, 51.9% for AGIs $100k-200k, 63.6% for AGIs over 200k)
Averages for the 2004 tax year for zip code 24175, filed in 2005:
Average Adjusted Gross Income (AGI) in 2004: $52,527 (Individual Income Tax Returns)
Here:
$52,527
State:
$56,704
Salary/wage: $46,343 (reported on 86.3% of returns)
Here:
$46,343
State:
$48,441
(% of AGI for various income ranges: 87.3% for AGIs below $10k, 71.9% for AGIs $10k-25k, 79.7% for AGIs $25k-50k, 80.0% for AGIs $50k-75k, 81.6% for AGIs $75k-100k, 69.4% for AGIs over 100k)
Taxable interest for individuals: $1,510 (reported on 53.7% of returns)
This zip code:
$1,510
Virginia:
$1,688
(% of AGI for various income ranges: 5.2% for AGIs below $10k, 2.6% for AGIs $10k-25k, 1.5% for AGIs $25k-50k, 0.9% for AGIs $50k-75k, 0.9% for AGIs $75k-100k, 2.0% for AGIs over 100k)
Taxable dividends: $2,672 (reported on 30.8% of returns)
Here:
$2,672
State:
$4,028
(% of AGI for various income ranges: 5.4% for AGIs below $10k, 1.6% for AGIs $10k-25k, 1.0% for AGIs $25k-50k, 1.2% for AGIs $50k-75k, 1.9% for AGIs $75k-100k, 1.7% for AGIs over 100k)
Net capital gain/loss: +$6,999 (reported on 22.5% of returns)
Here:
+$6,999
State:
+$14,375
(% of AGI for various income ranges: -2.8% for AGIs below $10k, 0.9% for AGIs $10k-25k, 0.7% for AGIs $25k-50k, 1.0% for AGIs $50k-75k, 1.3% for AGIs $75k-100k, 6.8% for AGIs over 100k)
Profit/loss from business: +$10,734 (reported on 14.6% of returns)
Here:
+$10,734
State:
+$13,342
(% of AGI for various income ranges: 6.5% for AGIs below $10k, 6.2% for AGIs $10k-25k, 3.6% for AGIs $25k-50k, 2.7% for AGIs $50k-75k, 2.2% for AGIs $75k-100k, 2.5% for AGIs over 100k)
IRA payment deduction: $2,924 (reported on 3.3% of returns)
24175:
$2,924
Virginia:
$2,943
(% of AGI for various income ranges: 0.5% for AGIs $25k-50k, 0.2% for AGIs $50k-75k, 0.1% for AGIs $75k-100k, 0.1% for AGIs over 100k)
Self-employed pension: $11,308 (reported on 0.7% of returns)
Here:
$11,308
Virginia:
$17,430
Total itemized deductions: $17,666 (21% of AGI, reported on 41.8% of returns)
Here:
$17,666
State:
$21,492
Here:
20.7% of AGI
State:
21.0% of AGI
(% of AGI for various income ranges: 9.1% for AGIs below $10k, 9.2% for AGIs $10k-25k, 13.5% for AGIs $25k-50k, 15.8% for AGIs $50k-75k, 15.9% for AGIs $75k-100k, 13.3% for AGIs over 100k)
Charity contributions deductions: $3,503 (4% of AGI, reported on 36.5% of returns)
Here:
$3,503
State:
$3,794
Here:
3.9% of AGI
State:
3.5% of AGI
(% of AGI for various income ranges: 1.0% for AGIs below $10k, 1.1% for AGIs $10k-25k, 1.9% for AGIs $25k-50k, 2.4% for AGIs $50k-75k, 2.8% for AGIs $75k-100k, 2.8% for AGIs over 100k)
Total tax: $7,384 (reported on 81.1% of returns)
24175:
$7,384
State:
$9,537
(% of AGI for various income ranges: 3.3% for AGIs below $10k, 4.6% for AGIs $10k-25k, 6.6% for AGIs $25k-50k, 8.3% for AGIs $50k-75k, 9.9% for AGIs $75k-100k, 18.1% for AGIs over 100k)
Earned income credit: $1,574 (reported on 9.2% of returns)
Here:
$1,574
State:
$1,734
Percentage of individuals using paid preparers for their 2004 taxes: 54.0%
Here:
54%
State:
52%
(% for various income ranges: 43.7% for AGIs below $10k, 50.8% for AGIs $10k-25k, 57.2% for AGIs $25k-50k, 58.0% for AGIs $50k-75k, 56.3% for AGIs $75k-100k, 59.7% for AGIs over 100k)
Household received Food Stamps/SNAP in the past 12 months: 38 Household did not receive Food Stamps/SNAP in the past 12 months: 2,941
Women who had a birth in the past 12 months: 35 (36 now married, 0 unmarried) Women who did not have a birth in the past 12 months: 1,363 (676 now married, 683 unmarried)
Housing units in zip code 24175 with a mortgage: 1,402 (142 second mortgage, 129 both second mortgage and home equity loan) Houses without a mortgage: 92
Median monthly owner costs for units with a mortgage: $1,535 Median monthly owner costs for units without a mortgage: $429
Residents with income below the poverty level in 2022:
This zip code:
6.0%
Whole state:
10.6%
Residents with income below 50% of the poverty level in 2022:
This zip code:
3.4%
Whole state:
5.2%
Median number of rooms in houses and condos:
Here:
6.9
State:
7.0
Median number of rooms in apartments:
Here:
4.5
State:
4.3
Notable locations in this zip code not listed on our city pages
Notable locations in zip code 24175: Fullhart Knob Shelter (A), Lambuts Meadow Appalachian Trail Shelter (B), Henry Fire Department (C), Cave Spring Rescue (D). Display/hide their locations on the map
Churches in zip code 24175 include: Catawba Valley Church (A), Coling Bible Chapel (B), Gravel Hill Church (C), Daleville Church of the Brethren (D), Laymantown Community Church (E), New Hope Church (F), Pleasant Hill Church (G), Victory Mission Church (H), Woodland Union Church (I). Display/hide their locations on the map
Cemeteries: Pleasant Chapel Cemetery (1), Riley Cemetery (2), Saint Clair Cemetery (3), Boyer Cemetery (4), Churchill Cemetery (5), Greenfield Cemetery (6), Laymantown Cemetery (7). Display/hide their locations on the map
Streams, rivers, and creeks: Stony Battle Creek (A), Sawmill Branch (B), Rulman Branch (C), Little Catawba Creek (D), Lees Creek (E), Buchanan Branch (F), Lemons Run (G), Brushy Run (H), Haymaker Branch (I). Display/hide their locations on the map
In group quarters: 14 (-1 institutionalized population)
Size of family households: 1,213 2-persons, 559 3-persons, 322 4-persons, 138 5-persons, 5 6-persons, 5 7-or-more-persons
Size of nonfamily households: 699 1-person, 64 2-persons, 1 3-persons
1,169 married couples with children.
123 single-parent households (104 men, 19 women).
98.1% of residents of 24175 zip code speak English at home.
1.6% of residents speak Spanish at home (100% very well).
0.2% of residents speak other Indo-European language at home (100% very well).
0.2% of residents speak Asian or Pacific Island language at home (100% very well).
Foreign born population: 280 (3.5%) (97.6% of them are naturalized citizens)
This zip code:
3.5%
Whole state:
12.7%
26%France
13%Guyana
7%Sweden
7%United Kingdom, excluding England and Scotland
6%Honduras
2%Bhutan
1%Malaysia
24%English
22%American
15%German
7%Irish
3%Italian
3%European
2%Ukrainian
Year of entry for the foreign-born population
252010 or later
792000 to 2009
31990 to 1999
188Before 1990
Facilities with environmental interests located in this zip code:
BOTETOURT COR UNIT #25 (STATE DR. in TROUTVILLE, VA)
(National Center for Education Statistics) - STATE ID-9000037 Organizations: DEPARTMENT OF CORRECTIONAL EDUCATION (SCHOOL DISTRICT)
ADAMS HTC & AC (4023 DAWNRIDGE LANE in TROUTVILLE, VA)
AIR MINOR (AIRS/AFS) Business SIC classification: REFRIGERATION AND AIR-CONDITIONING SERVICE AND REPAIR SHOPS
BOTELURT LUBE (2624 LEE HWY in TROUTVILLE, VA)
AIR MINOR (AIRS/AFS) Business SIC classification: AUTOMOTIVE REPAIR SHOPS
CARTER MACHINERY CO INC (2091 LEE HWY S in TROUTVILLE, VA)
Conditionally Exempt Small Quantity Generators, less than 100 kg/month of hazardous waste (Resource Conservation and Recovery Act (tracking hazardous waste)) - notification Organizations: OPERNAME (CONTACT/OPERATOR)
BOTETOURT CORRECTIONAL UNIT (201 STATE DRIVE in TROUTVILLE, VA)
ENFORCEMENT/COMPLIANCE ACTIVITY (Integrated Compliance Information System)
Housing units lacking complete plumbing facilities: 3.2% Housing units lacking complete kitchen facilities: 4.7%
77.3%Electricity
8.0%Utility gas
6.7%Fuel oil, kerosene, etc.
4.5%Bottled, tank, or LP gas
3.4%Wood
Population in 1990: 9,211.
Place of birth for U.S.-born residents:
This state: 5,247
Northeast: 719
Midwest: 548
South: 994
West: 72
59% of the 24175 zip code residents lived in the same house 5 years ago. Out of people who lived in different houses, 34% lived in this county. Out of people who lived in different counties, 50% lived in Virginia.
94% of the 24175 zip code residents lived in the same house 1 year ago. Out of people who lived in different houses, 19% moved from this county. Out of people who lived in different houses, 69% moved from different county within same state. Out of people who lived in different houses, 19% moved from different state.
Private vs. public school enrollment:
Students in private schools in grades 1 to 8 (elementary and middle school): 46
Here:
7.2%
Virginia:
13.2%
Students in private schools in grades 9 to 12 (high school): 6
Here:
1.8%
Virginia:
10.2%
Students in private undergraduate colleges: 31
Here:
13.0%
Virginia:
18.7%
Occupation by median earnings in the past 12 months ($)
83,122Architecture and engineering occupations
73,361Healthcare support occupations
64,104Management occupations
64,016Health diagnosing and treating practitioners and other technical occupations
52,317Community and social service occupations
50,932Computer and mathematical occupations
Top industries in this zip code by the number of employees in 2005:
2002 - 2018 National Fire Incident Reporting System (NFIRS) incidents
According to the data from the years 2002 - 2018 the average number of fire incidents per year is 48. The highest number of reported fires - 73 took place in 2005, and the least - 24 in 2003. The data has a dropping trend.
When looking into fire subcategories, the most reports belonged to: Structure Fires (41.7%), and Outside Fires (25.9%).
Fire incident types reported to NFIRS in Zip Code 24175


 Nearest zip codes: 24083, 24020, 24077, 24019, 24090, 24012.


 According to the data from the years 2002 - 2018 the average number of fire incidents per year is 48. The highest number of reported fires - 73 took place in 2005, and the least - 24 in 2003. The data has a dropping trend.
 When looking into fire subcategories, the most reports belonged to: Structure Fires (41.7%), and Outside Fires (25.9%).