Estimated zip code population in 2022: 1,142 Zip code population in 2010: 1,360 Zip code population in 2000: 1,024
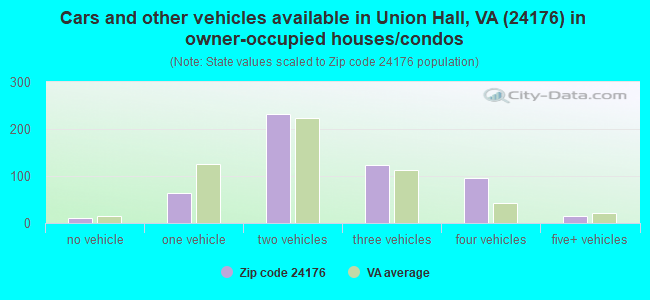
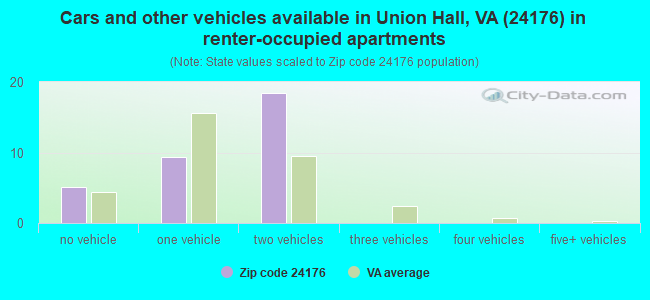
Houses and condos: 1,127 Renter-occupied apartments: 33
% of renters here:
6%
State:
33%
March 2022 cost of living index in zip code 24176: 85.7 (less than average, U.S. average is 100)
Land area: 22.0 sq. mi. Water area: 3.5 sq. mi.
Population density: 52 people per square mile
(very low).
OSM Map
General Map
Google Map
MSN Map
OSM Map
General Map
Google Map
MSN Map
OSM Map
General Map
Google Map
MSN Map
OSM Map
General Map
Google Map
MSN Map
Please wait while loading the map...
Real estate property taxes paid for housing units in 2022:
This zip code:
0.4% ($2,806)
Virginia:
0.7% ($2,617)
Median real estate property taxes paid for housing units with mortgages in 2022: $2,835 (0.4%) Median real estate property taxes paid for housing units with no mortgage in 2022: $2,820 (0.5%)
Business Search- 14 Million verified businesses
Males: 564
(49.4%)
Females: 578
(50.6%)
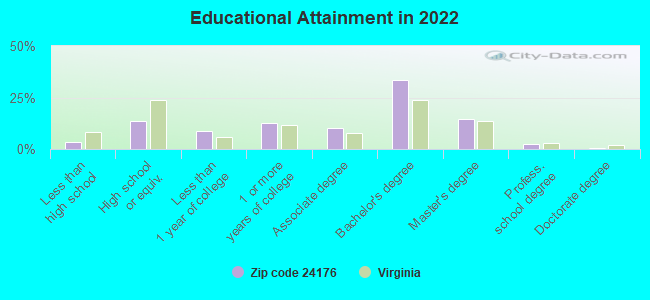
For population 25 years and over in 24176:
High school or higher: 96.4%
Bachelor's degree or higher: 51.2%
Graduate or professional degree: 17.9%
Unemployed: 1.4%
Mean travel time to work (commute): 36.6 minutes
For population 15 years and over in 24176:
Never married: 12.1%
Now married: 67.6%
Separated: 1.4%
Widowed: 9.6%
Divorced: 9.3%
Zip code 24176 compared to state average:
Median house value above state average.
Unemployed percentage below state average.
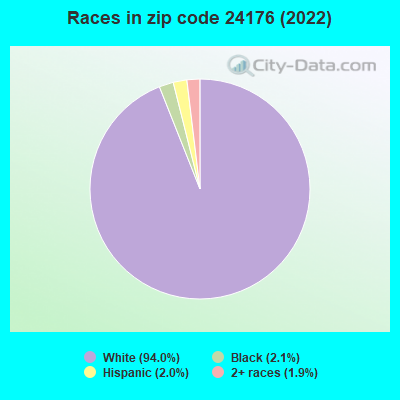
Black race population percentage significantly below state average.
Hispanic race population percentage significantly below state average.
Median age significantly above state average.
Foreign-born population percentage significantly below state average.
Renting percentage significantly below state average.
Length of stay since moving in significantly above state average.
House age below state average.
Number of college students below state average.
Percentage of population with a bachelor's degree or higher above state average.
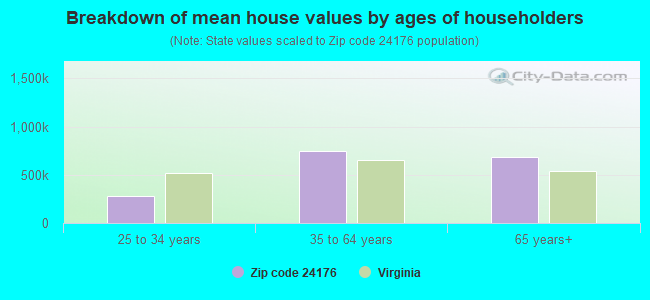
Estimated median house/condo value in 2022: $649,930
24176:
$649,930
Virginia:
$365,700
According to our research of Virginia and other state lists, there was 1 registered sex offender living in 24176 zip code as of June 09, 2024. The ratio of all residents to sex offenders in zip code 24176 is 1,482 to 1. The ratio of registered sex offenders to all residents in this zip code is much lower than the state average.
Median resident age:
This zip code:
60.5 years
Virginia median age:
39.0 years
Average household size:
This zip code:
2.0 people
Virginia:
2.5 people
Averages for the 2020 tax year for zip code 24176, filed in 2021:
Average Adjusted Gross Income (AGI) in 2020: $91,362 (Individual Income Tax Returns)
Here:
$91,362
State:
$86,446
Salary/wage: $65,548 (reported on 65.8% of returns)
Here:
$65,548
State:
$71,185
(% of AGI for various income ranges: 1169.2% for AGIs below $25k, 2620.0% for AGIs $25k-50k, 5060.0% for AGIs $50k-75k, 6060.0% for AGIs $75k-100k, 11358.6% for AGIs $100k-200k, 65220.0% for AGIs over 200k)
Taxable interest for individuals: $3,132 (reported on 52.1% of returns)
This zip code:
$3,132
Virginia:
$1,805
(% of AGI for various income ranges: 23.8% for AGIs below $25k, 95.5% for AGIs $25k-50k, 140.0% for AGIs $50k-75k, 112.0% for AGIs $75k-100k, 307.1% for AGIs $100k-200k, 3495.0% for AGIs over 200k)
Ordinary dividends: $9,300 (reported on 42.5% of returns)
Here:
$9,300
State:
$8,327
(% of AGI for various income ranges: 43.1% for AGIs below $25k, 152.7% for AGIs $25k-50k, 358.3% for AGIs $50k-75k, 464.0% for AGIs $75k-100k, 1375.7% for AGIs $100k-200k, 6245.0% for AGIs over 200k)
Net capital gain/loss in AGI: +$22,427 (reported on 35.6% of returns)
Here:
+$22,427
State:
+$24,644
(% of AGI for various income ranges: 50.0% for AGIs $25k-50k, 328.3% for AGIs $50k-75k, 548.0% for AGIs $75k-100k, 1002.9% for AGIs $100k-200k, 23110.0% for AGIs over 200k)
Profit/loss from business: +$14,270 (reported on 13.7% of returns)
Here:
+$14,270
State:
+$12,836
(% of AGI for various income ranges: 241.5% for AGIs below $25k, 850.0% for AGIs $50k-75k, 861.4% for AGIs $100k-200k)
Taxable individual retirement arrangement distribution: $25,628 (reported on 24.7% of returns)
24176:
$25,628
Virginia:
$21,535
(% of AGI for various income ranges: 453.6% for AGIs $25k-50k, 873.3% for AGIs $50k-75k, 1464.0% for AGIs $75k-100k, 4082.9% for AGIs $100k-200k)
Total itemized deductions: $33,891 (reported on 15.1% of returns)
Here:
$33,891
State:
$33,287
(% of AGI for various income ranges: 1593.3% for AGIs $50k-75k, 1605.7% for AGIs $100k-200k, 8240.0% for AGIs over 200k)
Charity contributions: $10,780 (reported on 13.7% of returns)
Here:
$10,780
State:
$10,381
(% of AGI for various income ranges: 340.0% for AGIs $50k-75k, 368.6% for AGIs $100k-200k, 3080.0% for AGIs over 200k)
Taxes paid: $7,982 (reported on 15.1% of returns)
24176:
$7,982
State:
$8,284
(% of AGI for various income ranges: 353.3% for AGIs $50k-75k, 482.9% for AGIs $100k-200k, 1640.0% for AGIs over 200k)
Earned income credit: $2,857 (reported on 9.6% of returns)
Here:
$2,857
State:
$2,214
(% of AGI for various income ranges: 107.7% for AGIs below $25k, 54.5% for AGIs $25k-50k)
Percentage of individuals using paid preparers for their 2020 taxes: 93.2%
Here:
93%
State:
92%
(% for various income ranges: 90.0% for AGIs below $25k, 92.9% for AGIs $25k-50k, 90.0% for AGIs $50k-75k, 100.0% for AGIs $75k-100k, 92.9% for AGIs $100k-200k, 100.0% for AGIs over 200k)
Averages for the 2012 tax year for zip code 24176, filed in 2013:
Average Adjusted Gross Income (AGI) in 2012: $69,938 (Individual Income Tax Returns)
Here:
$69,938
State:
$71,192
Salary/wage: $47,834 (reported on 73.3% of returns)
Here:
$47,834
State:
$59,229
(% of AGI for various income ranges: 64.0% for AGIs below $25k, 60.2% for AGIs $25k-50k, 52.5% for AGIs $50k-75k, 39.9% for AGIs $75k-100k, 45.4% for AGIs $100k-200k, 52.8% for AGIs over 200k)
Taxable interest for individuals: $1,824 (reported on 55.0% of returns)
This zip code:
$1,824
Virginia:
$1,600
(% of AGI for various income ranges: 1.2% for AGIs below $25k, 3.5% for AGIs $25k-50k, 1.9% for AGIs $50k-75k, 1.3% for AGIs $75k-100k, 1.3% for AGIs $100k-200k, 0.6% for AGIs over 200k)
Ordinary dividends: $6,224 (reported on 41.7% of returns)
Here:
$6,224
State:
$6,959
(% of AGI for various income ranges: 2.1% for AGIs below $25k, 3.6% for AGIs $25k-50k, 3.5% for AGIs $50k-75k, 2.6% for AGIs $75k-100k, 4.3% for AGIs $100k-200k, 3.7% for AGIs over 200k)
Net capital gain/loss in AGI: +$3,500 (reported on 30.0% of returns)
Here:
+$3,500
State:
+$16,672
(% of AGI for various income ranges: 27.0% for AGIs below $25k, 1.8% for AGIs $50k-75k, 0.7% for AGIs $75k-100k, 0.5% for AGIs $100k-200k, 4.0% for AGIs over 200k)
Profit/loss from business: +$5,409 (reported on 18.3% of returns)
Here:
+$5,409
State:
+$14,116
(% of AGI for various income ranges: 2.3% for AGIs below $25k, 6.3% for AGIs $25k-50k, 2.5% for AGIs $50k-75k, 0.8% for AGIs $100k-200k)
Taxable individual retirement arrangement distribution: $22,469 (reported on 26.7% of returns)
24176:
$22,469
Virginia:
$16,667
(% of AGI for various income ranges: 7.7% for AGIs below $25k, 6.9% for AGIs $25k-50k, 6.9% for AGIs $50k-75k, 8.1% for AGIs $75k-100k, 15.8% for AGIs $100k-200k)
Total itemized deductions: $26,333 (23% of AGI, reported on 45.0% of returns)
Here:
$26,333
State:
$26,596
Here:
23.0% of AGI
State:
20.1% of AGI
(% of AGI for various income ranges: 24.4% for AGIs $25k-50k, 16.9% for AGIs $50k-75k, 19.9% for AGIs $75k-100k, 18.9% for AGIs $100k-200k, 13.3% for AGIs over 200k)
Charity contributions: $4,454 (reported on 40.0% of returns)
Here:
$4,454
State:
$4,443
(% of AGI for various income ranges: 3.1% for AGIs $25k-50k, 2.7% for AGIs $50k-75k, 2.9% for AGIs $75k-100k, 3.1% for AGIs $100k-200k, 1.8% for AGIs over 200k)
Taxes paid: $8,693 (reported on 45.0% of returns)
24176:
$8,693
State:
$9,951
(% of AGI for various income ranges: 5.0% for AGIs $25k-50k, 4.4% for AGIs $50k-75k, 5.7% for AGIs $75k-100k, 6.6% for AGIs $100k-200k, 6.2% for AGIs over 200k)
Earned income credit: $2,057 (reported on 11.7% of returns)
Here:
$2,057
State:
$2,211
(% of AGI for various income ranges: 4.5% for AGIs below $25k, 1.0% for AGIs $25k-50k)
Percentage of individuals using paid preparers for their 2012 taxes: 58.3%
Here:
58%
State:
46%
(% for various income ranges: 52.6% for AGIs below $25k, 58.3% for AGIs $25k-50k, 60.0% for AGIs $50k-75k, 60.0% for AGIs $75k-100k, 63.6% for AGIs $100k-200k, 66.7% for AGIs over 200k)
Averages for the 2004 tax year for zip code 24176, filed in 2005:
Average Adjusted Gross Income (AGI) in 2004: $62,274 (Individual Income Tax Returns)
Here:
$62,274
State:
$56,704
Salary/wage: $42,087 (reported on 71.9% of returns)
Here:
$42,087
State:
$48,441
(% of AGI for various income ranges: 72.5% for AGIs below $10k, 67.3% for AGIs $10k-25k, 72.8% for AGIs $25k-50k, 49.8% for AGIs $50k-75k, 43.6% for AGIs $75k-100k, 41.5% for AGIs over 100k)
Taxable interest for individuals: $2,717 (reported on 62.3% of returns)
This zip code:
$2,717
Virginia:
$1,688
(% of AGI for various income ranges: 11.2% for AGIs below $10k, 5.4% for AGIs $10k-25k, 2.2% for AGIs $25k-50k, 2.0% for AGIs $50k-75k, 1.6% for AGIs $75k-100k, 2.8% for AGIs over 100k)
Taxable dividends: $5,730 (reported on 44.8% of returns)
Here:
$5,730
State:
$4,028
(% of AGI for various income ranges: 3.5% for AGIs below $10k, 5.3% for AGIs $10k-25k, 1.8% for AGIs $25k-50k, 4.2% for AGIs $50k-75k, 3.6% for AGIs $75k-100k, 4.6% for AGIs over 100k)
Net capital gain/loss: +$8,463 (reported on 38.1% of returns)
Here:
+$8,463
State:
+$14,375
(% of AGI for various income ranges: -1.1% for AGIs below $10k, 1.9% for AGIs $10k-25k, 3.1% for AGIs $25k-50k, 0.5% for AGIs $50k-75k, 0.9% for AGIs $75k-100k, 8.3% for AGIs over 100k)
Profit/loss from business: +$8,333 (reported on 17.6% of returns)
Here:
+$8,333
State:
+$13,342
(% of AGI for various income ranges: -1.6% for AGIs below $10k, -1.7% for AGIs $10k-25k, 1.9% for AGIs $25k-50k, 5.7% for AGIs $50k-75k, 6.7% for AGIs $75k-100k, 1.2% for AGIs over 100k)
IRA payment deduction: $3,870 (reported on 4.1% of returns)
24176:
$3,870
Virginia:
$2,943
Total itemized deductions: $25,390 (24% of AGI, reported on 42.0% of returns)
Here:
$25,390
State:
$21,492
Here:
23.5% of AGI
State:
21.0% of AGI
(% of AGI for various income ranges: 15.0% for AGIs $10k-25k, 12.0% for AGIs $25k-50k, 20.7% for AGIs $50k-75k, 18.3% for AGIs $75k-100k, 17.8% for AGIs over 100k)
Charity contributions deductions: $4,404 (4% of AGI, reported on 37.0% of returns)
Here:
$4,404
State:
$3,794
Here:
3.9% of AGI
State:
3.5% of AGI
(% of AGI for various income ranges: 0.8% for AGIs $10k-25k, 1.6% for AGIs $25k-50k, 3.0% for AGIs $50k-75k, 2.7% for AGIs $75k-100k, 3.0% for AGIs over 100k)
Total tax: $10,566 (reported on 79.2% of returns)
24176:
$10,566
State:
$9,537
(% of AGI for various income ranges: 3.0% for AGIs below $10k, 3.7% for AGIs $10k-25k, 6.8% for AGIs $25k-50k, 9.0% for AGIs $50k-75k, 11.2% for AGIs $75k-100k, 17.8% for AGIs over 100k)
Earned income credit: $1,679 (reported on 9.4% of returns)
Here:
$1,679
State:
$1,734
Percentage of individuals using paid preparers for their 2004 taxes: 68.9%
Here:
69%
State:
52%
(% for various income ranges: 64.5% for AGIs below $10k, 63.2% for AGIs $10k-25k, 70.9% for AGIs $25k-50k, 61.5% for AGIs $50k-75k, 82.8% for AGIs $75k-100k, 75.0% for AGIs over 100k)
Churches in zip code 24176 include: Ephesus Church (A), Union Hall Church (B), New Design Church (C), Old Bethel Church (D). Display/hide their locations on the map
Cemeteries: Wright Cemetery (1), Perdue Cemetery (2), Pelter Cemetery (3), Cundiff Cemetery (4), David Cemetery (5), Dillon Cemetery (6), English Cemetery (7). Display/hide their locations on the map
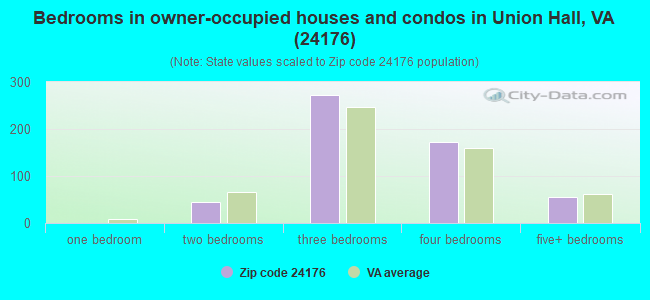
Size of family households: 312 2-persons, 61 3-persons, 31 4-persons, 22 5-persons
Size of nonfamily households: 137 1-person, 8 2-persons
33 married couples with children.
23 single-parent households (23 women).
101.1% of residents of 24176 zip code speak English at home.
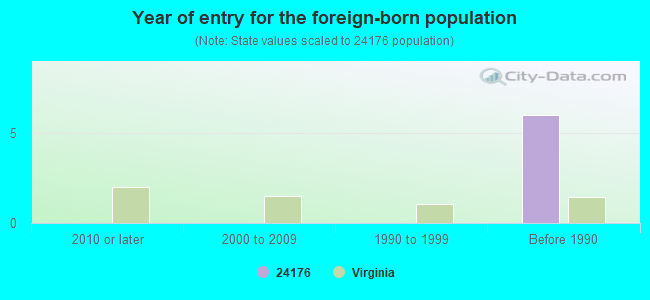
Foreign born population: 0 (0.0%)
:
0.0%
Whole state:
12.7%
26%English
19%German
11%Irish
11%American
8%Scottish
4%Italian
3%Polish
Year of entry for the foreign-born population
02010 or later
02000 to 2009
01990 to 1999
6Before 1990
Housing units lacking complete plumbing facilities: 0.4% Housing units lacking complete kitchen facilities: 0.4%
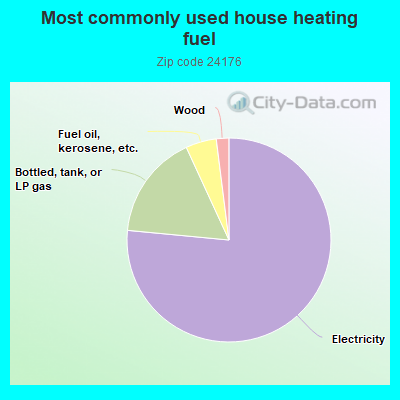
76.9%Electricity
16.7%Bottled, tank, or LP gas
4.9%Fuel oil, kerosene, etc.
2.0%Wood
Population in 1990: 804. Population change in the 1990s: +220 (+27.4%).
Place of birth for U.S.-born residents:
This state: 506
Northeast: 352
Midwest: 87
South: 151
West: 37
70% of the 24176 zip code residents lived in the same house 5 years ago. Out of people who lived in different houses, 25% lived in this county. Out of people who lived in different counties, 50% lived in Virginia.
95% of the 24176 zip code residents lived in the same house 1 year ago. Out of people who lived in different houses, 22% moved from this county. Out of people who lived in different houses, 22% moved from different county within same state. Out of people who lived in different houses, 61% moved from different state.
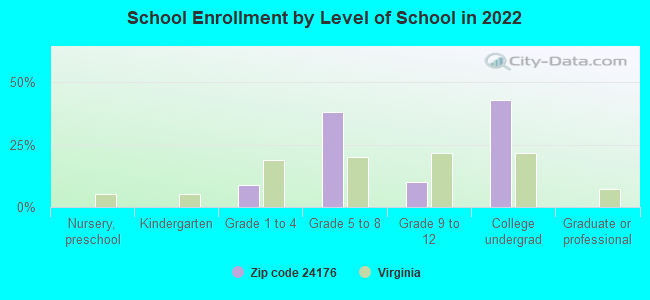
Private vs. public school enrollment:
Students in private schools in grades 1 to 8 (elementary and middle school): 26
Here:
62.8%
Virginia:
13.2%
Students in private schools in grades 9 to 12 (high school): 2
Here:
35.8%
Virginia:
10.2%
Students in private undergraduate colleges: 13
Here:
39.1%
Virginia:
18.7%
Occupation by median earnings in the past 12 months ($)
162,984Management occupations
73,884Business and financial operations occupations
44,125Sales and related occupations
30,482Office and administrative support occupations
6,262Food preparation and serving related occupations
4,802Health diagnosing and treating practitioners and other technical occupations
Companies with federal contracts located in this zip code:
EVIDENT, INC (739 BROOKS MILL RD in UNION HALL, VA; small business) : $77,371 in 5 contractsfrom 2003 to 2006
Contracts for Laboratory Equipment and Supplies, Memorials: Cemeterial and Mortuary Equipment and Supplies, Replenishable Field Medical Sets, Kits, and Outfits, Industrial Investigation Surveys and Technical Support Related to Water Pollution by Army, Navy Signed by year:2000: $0; 2001: $0; 2002: $0; 2003: $57,548; 2004: $0; 2005: $14,855; 2006: $4,968.
Biggest contracts:
$57,548 with Army for Laboratory Equipment and Supplies. Taking place in GA. Signed on 2003-08-21. Completion date: 2003-09-30.
$5,249 with Navy for Memorials: Cemeterial and Mortuary Equipment and Supplies. Signed on 2005-09-27. Completion date: 2005-10-17.
$5,190 with Army for Replenishable Field Medical Sets, Kits, and Outfits. Signed on 2005-09-17. Completion date: 2005-11-01.
$4,968 with Army for Industrial Investigation Surveys and Technical Support Related to Water Pollution. Signed on 2006-01-11. Completion date: 2006-01-09.
ALLEN, JAMES (255 LANDS END CIR in UNION HALL, VA; small business)
$60,000 with Army for Programming Services. Taking place in NY. Signed on 2006-04-12. Completion date: 2006-10-19.
Top industries in this zip code by the number of employees in 2005:
Construction: Other Heavy and Civil Engineering Construction (20-49 employees: 1 establishment)
Wholesale Trade: Other Professional Equipment and Supplies Merchant Wholesalers (10-19: 1)
Construction: New Single-Family Housing Construction (except Operative Builders) (5-9: 1)
Utilities: Fossil Fuel Electric Power Generation (5-9: 1)
Arts, Entertainment, and Recreation: Marinas (1-4: 2)
Fatal accident statistics in 2010:
Fatal accident count: 1
Vehicles involved in fatal accidents: 3
Fatal accidents caused by drunken drivers: 0
Fatalities: 1
Persons involved in fatal accidents: 3
Pedestrians involved in fatal accidents: 0
Home Mortgage Disclosure Act Aggregated Statistics For Year 2009 (Based on 2 partial tracts)
A) FHA, FSA/RHS & VA Home Purchase Loans
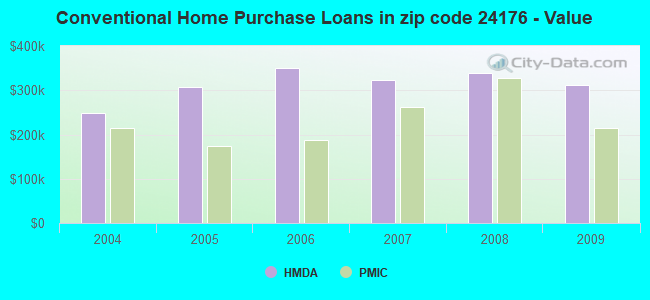
B) Conventional Home Purchase Loans
C) Refinancings
D) Home Improvement Loans
F) Non-occupant Loans on < 5 Family Dwellings (A B C & D)
G) Loans On Manufactured Home Dwelling (A B C & D)
Number
Average Value
Number
Average Value
Number
Average Value
Number
Average Value
Number
Average Value
Number
Average Value
LOANS ORIGINATED
5
$186,928
53
$311,545
227
$273,550
9
$126,360
118
$317,438
7
$73,109
APPLICATIONS APPROVED, NOT ACCEPTED
0
$0
3
$210,040
8
$255,195
1
$235,030
7
$273,359
1
$129,730
APPLICATIONS DENIED
2
$109,510
5
$366,192
38
$262,064
2
$219,235
16
$261,381
3
$115,690
APPLICATIONS WITHDRAWN
1
$238,820
4
$336,750
30
$271,534
0
$0
10
$271,548
0
$0
FILES CLOSED FOR INCOMPLETENESS
0
$0
1
$769,110
8
$306,896
0
$0
3
$489,573
1
$102,350
Aggregated Statistics For Year 2008 (Based on 2 partial tracts)
A) FHA, FSA/RHS & VA Home Purchase Loans
B) Conventional Home Purchase Loans
C) Refinancings
D) Home Improvement Loans
F) Non-occupant Loans on < 5 Family Dwellings (A B C & D)
G) Loans On Manufactured Home Dwelling (A B C & D)
Number
Average Value
Number
Average Value
Number
Average Value
Number
Average Value
Number
Average Value
Number
Average Value
LOANS ORIGINATED
3
$184,203
41
$338,881
87
$290,739
9
$146,250
54
$375,601
8
$93,454
APPLICATIONS APPROVED, NOT ACCEPTED
0
$0
4
$206,810
10
$237,388
1
$75,820
3
$416,567
1
$41,280
APPLICATIONS DENIED
1
$183,640
7
$272,096
40
$252,404
4
$124,042
6
$426,675
8
$105,616
APPLICATIONS WITHDRAWN
0
$0
4
$217,128
20
$205,882
1
$69,500
5
$284,226
0
$0
FILES CLOSED FOR INCOMPLETENESS
1
$107,830
2
$378,870
1
$206,810
1
$236,710
1
$446,050
0
$0
Aggregated Statistics For Year 2007 (Based on 2 partial tracts)
A) FHA, FSA/RHS & VA Home Purchase Loans
B) Conventional Home Purchase Loans
C) Refinancings
D) Home Improvement Loans
F) Non-occupant Loans on < 5 Family Dwellings (A B C & D)
G) Loans On Manufactured Home Dwelling (A B C & D)
Number
Average Value
Number
Average Value
Number
Average Value
Number
Average Value
Number
Average Value
Number
Average Value
LOANS ORIGINATED
2
$163,005
80
$323,718
92
$303,992
13
$150,045
69
$378,738
10
$87,020
APPLICATIONS APPROVED, NOT ACCEPTED
1
$76,240
7
$364,940
16
$297,525
2
$90,345
7
$415,303
1
$53,910
APPLICATIONS DENIED
1
$112,040
12
$349,456
44
$264,016
5
$235,704
12
$421,938
5
$127,792
APPLICATIONS WITHDRAWN
0
$0
5
$354,398
21
$206,368
2
$58,970
5
$353,386
0
$0
FILES CLOSED FOR INCOMPLETENESS
0
$0
3
$350,440
5
$214,306
2
$747,630
4
$521,130
0
$0
Aggregated Statistics For Year 2006 (Based on 2 partial tracts)
A) FHA, FSA/RHS & VA Home Purchase Loans
B) Conventional Home Purchase Loans
C) Refinancings
D) Home Improvement Loans
F) Non-occupant Loans on < 5 Family Dwellings (A B C & D)
G) Loans On Manufactured Home Dwelling (A B C & D)
Number
Average Value
Number
Average Value
Number
Average Value
Number
Average Value
Number
Average Value
Number
Average Value
LOANS ORIGINATED
4
$161,002
96
$349,684
127
$301,121
19
$89,316
85
$340,181
10
$101,930
APPLICATIONS APPROVED, NOT ACCEPTED
0
$0
13
$220,288
11
$279,103
2
$83,400
8
$339,856
3
$99,683
APPLICATIONS DENIED
0
$0
13
$220,968
46
$198,120
5
$46,668
10
$264,219
7
$89,114
APPLICATIONS WITHDRAWN
0
$0
8
$226,131
32
$236,267
2
$76,870
7
$246,463
1
$264,090
FILES CLOSED FOR INCOMPLETENESS
0
$0
2
$400,560
7
$214,451
0
$0
1
$214,390
1
$88,870
Aggregated Statistics For Year 2005 (Based on 2 partial tracts)
A) FHA, FSA/RHS & VA Home Purchase Loans
B) Conventional Home Purchase Loans
C) Refinancings
D) Home Improvement Loans
F) Non-occupant Loans on < 5 Family Dwellings (A B C & D)
G) Loans On Manufactured Home Dwelling (A B C & D)
Number
Average Value
Number
Average Value
Number
Average Value
Number
Average Value
Number
Average Value
Number
Average Value
LOANS ORIGINATED
4
$140,998
139
$307,646
110
$272,735
10
$115,156
117
$313,211
7
$71,423
APPLICATIONS APPROVED, NOT ACCEPTED
0
$0
10
$304,233
16
$216,444
1
$19,380
9
$252,533
1
$99,400
APPLICATIONS DENIED
0
$0
17
$270,212
45
$182,632
9
$53,446
9
$278,741
5
$72,278
APPLICATIONS WITHDRAWN
0
$0
12
$270,797
25
$223,708
3
$86,487
9
$296,899
3
$89,577
FILES CLOSED FOR INCOMPLETENESS
0
$0
7
$258,617
3
$167,637
1
$40,010
4
$331,485
0
$0
Aggregated Statistics For Year 2004 (Based on 2 partial tracts)
A) FHA, FSA/RHS & VA Home Purchase Loans
B) Conventional Home Purchase Loans
C) Refinancings
D) Home Improvement Loans
F) Non-occupant Loans on < 5 Family Dwellings (A B C & D)
G) Loans On Manufactured Home Dwelling (A B C & D)
Detailed PMIC statistics for the following Tracts:0201.00
2003 - 2018 National Fire Incident Reporting System (NFIRS) incidents
According to the data from the years 2003 - 2018 the average number of fire incidents per year is 6. The highest number of fire incidents - 22 took place in 2015, and the least - 0 in 2017. The data has a rising trend.
When looking into fire subcategories, the most reports belonged to: Outside Fires (50.0%), and Structure Fires (27.0%).
Fire incident types reported to NFIRS in Zip Code 24176

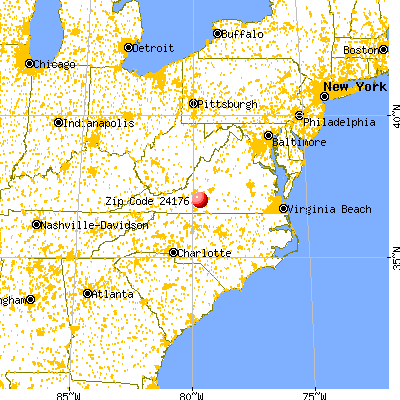


 Nearest zip codes: 24092, 24137, 24184, 24161, 24121, 24151.
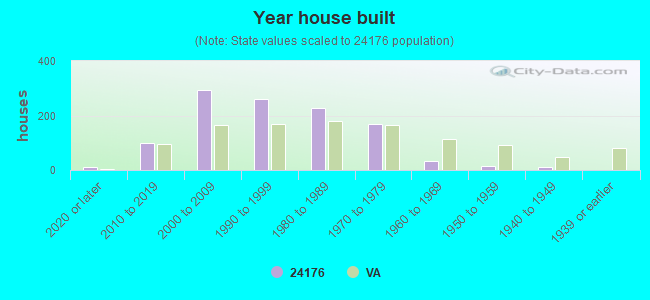


 : $77,371 in 5 contracts from 2003 to 2006


 According to the data from the years 2003 - 2018 the average number of fire incidents per year is 6. The highest number of fire incidents - 22 took place in 2015, and the least - 0 in 2017. The data has a rising trend.
 When looking into fire subcategories, the most reports belonged to: Outside Fires (50.0%), and Structure Fires (27.0%).