Estimated zip code population in 2022: 2,585 Zip code population in 2010: 2,596 Zip code population in 2000: 2,601
Houses and condos: 1,424 Renter-occupied apartments: 168
% of renters here:
15%
State:
33%
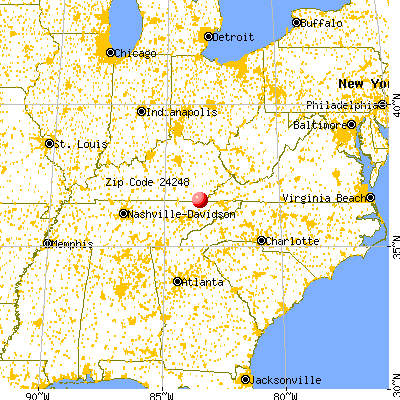
March 2022 cost of living index in zip code 24248: 82.1 (low, U.S. average is 100)
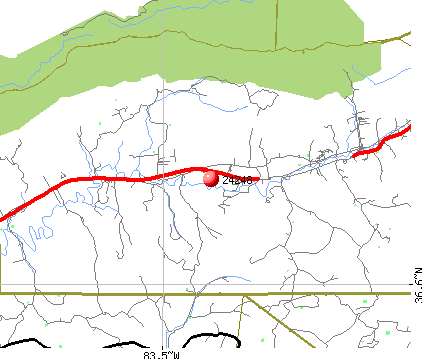
Land area: 52.4 sq. mi. Water area: 0.1 sq. mi.
Population density: 49 people per square mile
(very low).
OSM Map
General Map
Google Map
MSN Map
OSM Map
General Map
Google Map
MSN Map
OSM Map
General Map
Google Map
MSN Map
OSM Map
General Map
Google Map
MSN Map
Please wait while loading the map...
Real estate property taxes paid for housing units in 2022:
This zip code:
0.7% ($645)
Virginia:
0.7% ($2,617)
Median real estate property taxes paid for housing units with mortgages in 2022: $766 (0.6%) Median real estate property taxes paid for housing units with no mortgage in 2022: $443 (0.5%)
Business Search- 14 Million verified businesses
Males: 1,420
(54.9%)
Females: 1,165
(45.1%)
For population 25 years and over in 24248:
High school or higher: 80.5%
Bachelor's degree or higher: 11.5%
Graduate or professional degree: 2.2%
Unemployed: 3.1%
Mean travel time to work (commute): 19.5 minutes
For population 15 years and over in 24248:
Never married: 20.5%
Now married: 65.5%
Separated: 2.7%
Widowed: 1.6%
Divorced: 9.7%
Zip code 24248 compared to state average:
Median house value significantly below state average.
Black race population percentage significantly below state average.
Hispanic race population percentage significantly below state average.
Median age significantly above state average.
Foreign-born population percentage significantly below state average.
Renting percentage below state average.
Length of stay since moving in significantly above state average.
Percentage of population with a bachelor's degree or higher significantly below state average.
Estimated median house/condo value in 2022: $96,537
24248:
$96,537
Virginia:
$365,700
According to our research of Virginia and other state lists, there were 5 registered sex offenders living in 24248 zip code as of May 28, 2024. The ratio of all residents to sex offenders in zip code 24248 is 521 to 1. The ratio of registered sex offenders to all residents in this zip code is lower than the state average.
Median resident age:
This zip code:
48.2 years
Virginia median age:
39.0 years
Average household size:
This zip code:
2.3 people
Virginia:
2.5 people
Averages for the 2020 tax year for zip code 24248, filed in 2021:
Average Adjusted Gross Income (AGI) in 2020: $42,712 (Individual Income Tax Returns)
Here:
$42,712
State:
$86,446
Salary/wage: $39,256 (reported on 75.3% of returns)
Here:
$39,256
State:
$71,185
(% of AGI for various income ranges: 1178.8% for AGIs below $25k, 3484.7% for AGIs $25k-50k, 6504.4% for AGIs $50k-75k, 10700.0% for AGIs $75k-100k, 15297.5% for AGIs $100k-200k)
Taxable interest for individuals: $1,343 (reported on 27.1% of returns)
This zip code:
$1,343
Virginia:
$1,805
(% of AGI for various income ranges: 13.6% for AGIs below $25k, 35.9% for AGIs $25k-50k, 51.1% for AGIs $50k-75k, 287.5% for AGIs $75k-100k, 132.5% for AGIs $100k-200k)
Ordinary dividends: $2,071 (reported on 8.2% of returns)
Here:
$2,071
State:
$8,327
(% of AGI for various income ranges: 40.6% for AGIs $25k-50k, 190.0% for AGIs $75k-100k)
Net capital gain/loss in AGI: +$2,386 (reported on 8.2% of returns)
Here:
+$2,386
State:
+$24,644
(% of AGI for various income ranges: 41.8% for AGIs $25k-50k, 240.0% for AGIs $75k-100k)
Profit/loss from business: +$10,847 (reported on 17.6% of returns)
Here:
+$10,847
State:
+$12,836
(% of AGI for various income ranges: 202.0% for AGIs below $25k, 134.1% for AGIs $25k-50k, 307.8% for AGIs $50k-75k, 1542.5% for AGIs $75k-100k)
Taxable individual retirement arrangement distribution: $10,500 (reported on 5.9% of returns)
24248:
$10,500
Virginia:
$21,535
(% of AGI for various income ranges: 101.6% for AGIs below $25k, 301.1% for AGIs $50k-75k)
Earned income credit: $2,695 (reported on 24.7% of returns)
Here:
$2,695
State:
$2,214
(% of AGI for various income ranges: 170.0% for AGIs below $25k, 82.9% for AGIs $25k-50k)
Percentage of individuals using paid preparers for their 2020 taxes: 94.1%
Here:
94%
State:
92%
(% for various income ranges: 97.1% for AGIs below $25k, 95.7% for AGIs $25k-50k, 92.3% for AGIs $50k-75k, 87.5% for AGIs $75k-100k, 83.3% for AGIs $100k-200k)
Averages for the 2012 tax year for zip code 24248, filed in 2013:
Average Adjusted Gross Income (AGI) in 2012: $35,820 (Individual Income Tax Returns)
Here:
$35,820
State:
$71,192
Salary/wage: $31,964 (reported on 83.1% of returns)
Here:
$31,964
State:
$59,229
(% of AGI for various income ranges: 73.4% for AGIs below $25k, 77.1% for AGIs $25k-50k, 77.2% for AGIs $50k-75k, 70.8% for AGIs $75k-100k, 68.7% for AGIs $100k-200k)
Taxable interest for individuals: $896 (reported on 30.3% of returns)
This zip code:
$896
Virginia:
$1,600
(% of AGI for various income ranges: 0.5% for AGIs below $25k, 0.8% for AGIs $25k-50k, 1.2% for AGIs $50k-75k, 0.8% for AGIs $75k-100k, 0.3% for AGIs $100k-200k)
Ordinary dividends: $2,400 (reported on 7.9% of returns)
Here:
$2,400
State:
$6,959
Net capital gain/loss in AGI: +$1,356 (reported on 10.1% of returns)
Here:
+$1,356
State:
+$16,672
(% of AGI for various income ranges: 0.1% for AGIs below $25k, 0.7% for AGIs $25k-50k, 0.7% for AGIs $50k-75k)
Profit/loss from business: +$7,479 (reported on 15.7% of returns)
Here:
+$7,479
State:
+$14,116
(% of AGI for various income ranges: 7.8% for AGIs below $25k, 3.3% for AGIs $25k-50k, 4.1% for AGIs $50k-75k)
Taxable individual retirement arrangement distribution: $8,275 (reported on 9.0% of returns)
24248:
$8,275
Virginia:
$16,667
(% of AGI for various income ranges: 3.5% for AGIs below $25k, 3.6% for AGIs $25k-50k, 3.6% for AGIs $75k-100k)
Total itemized deductions: $17,133 (23% of AGI, reported on 13.5% of returns)
Here:
$17,133
State:
$26,596
Here:
22.9% of AGI
State:
20.1% of AGI
(% of AGI for various income ranges: 5.5% for AGIs $25k-50k, 6.8% for AGIs $50k-75k, 9.5% for AGIs $75k-100k, 11.8% for AGIs $100k-200k)
Charity contributions: $4,500 (reported on 9.0% of returns)
Here:
$4,500
State:
$4,443
(% of AGI for various income ranges: 1.1% for AGIs below $25k, 1.6% for AGIs $50k-75k, 3.1% for AGIs $100k-200k)
Taxes paid: $5,075 (reported on 13.5% of returns)
24248:
$5,075
State:
$9,951
(% of AGI for various income ranges: 1.2% for AGIs $25k-50k, 1.7% for AGIs $50k-75k, 2.6% for AGIs $75k-100k, 4.9% for AGIs $100k-200k)
Earned income credit: $2,272 (reported on 28.1% of returns)
Here:
$2,272
State:
$2,211
(% of AGI for various income ranges: 7.7% for AGIs below $25k, 1.6% for AGIs $25k-50k)
Percentage of individuals using paid preparers for their 2012 taxes: 71.9%
Here:
72%
State:
46%
(% for various income ranges: 69.8% for AGIs below $25k, 70.8% for AGIs $25k-50k, 76.9% for AGIs $50k-75k, 80.0% for AGIs $75k-100k, 75.0% for AGIs $100k-200k)
Averages for the 2004 tax year for zip code 24248, filed in 2005:
Average Adjusted Gross Income (AGI) in 2004: $29,710 (Individual Income Tax Returns)
Here:
$29,710
State:
$56,704
Salary/wage: $27,851 (reported on 84.8% of returns)
Here:
$27,851
State:
$48,441
(% of AGI for various income ranges: 84.9% for AGIs below $10k, 79.6% for AGIs $10k-25k, 88.1% for AGIs $25k-50k, 84.3% for AGIs $50k-75k, 77.2% for AGIs $75k-100k, 49.9% for AGIs over 100k)
Taxable interest for individuals: $1,419 (reported on 36.0% of returns)
This zip code:
$1,419
Virginia:
$1,688
(% of AGI for various income ranges: 6.0% for AGIs below $10k, 1.6% for AGIs $10k-25k, 1.5% for AGIs $25k-50k, 0.7% for AGIs $50k-75k, 1.7% for AGIs $75k-100k, 3.2% for AGIs over 100k)
Taxable dividends: $1,586 (reported on 9.5% of returns)
Here:
$1,586
State:
$4,028
(% of AGI for various income ranges: 1.8% for AGIs below $10k, 0.5% for AGIs $10k-25k, 0.2% for AGIs $25k-50k, 0.2% for AGIs $50k-75k, 2.3% for AGIs $75k-100k)
Net capital gain/loss: +$1,961 (reported on 8.3% of returns)
Here:
+$1,961
State:
+$14,375
(% of AGI for various income ranges: -0.5% for AGIs below $10k, 0.6% for AGIs $10k-25k, 0.1% for AGIs $25k-50k, 0.5% for AGIs $50k-75k, 2.9% for AGIs $75k-100k)
Profit/loss from business: +$5,280 (reported on 15.7% of returns)
Here:
+$5,280
State:
+$13,342
(% of AGI for various income ranges: 10.2% for AGIs below $10k, 5.7% for AGIs $10k-25k, 1.9% for AGIs $25k-50k, 2.5% for AGIs $50k-75k, 1.7% for AGIs $75k-100k)
IRA payment deduction: $3,600 (reported on 1.1% of returns)
24248:
$3,600
Virginia:
$2,943
Total itemized deductions: $15,040 (22% of AGI, reported on 13.6% of returns)
Here:
$15,040
State:
$21,492
Here:
21.9% of AGI
State:
21.0% of AGI
(% of AGI for various income ranges: 3.2% for AGIs $10k-25k, 6.0% for AGIs $25k-50k, 8.9% for AGIs $50k-75k, 10.5% for AGIs $75k-100k, 9.8% for AGIs over 100k)
Charity contributions deductions: $3,747 (5% of AGI, reported on 10.0% of returns)
Here:
$3,747
State:
$3,794
Here:
5.2% of AGI
State:
3.5% of AGI
(% of AGI for various income ranges: 0.7% for AGIs $10k-25k, 0.9% for AGIs $25k-50k, 1.2% for AGIs $50k-75k, 2.8% for AGIs $75k-100k, 2.0% for AGIs over 100k)
Total tax: $3,519 (reported on 69.0% of returns)
24248:
$3,519
State:
$9,537
(% of AGI for various income ranges: 3.8% for AGIs below $10k, 3.5% for AGIs $10k-25k, 5.8% for AGIs $25k-50k, 8.5% for AGIs $50k-75k, 11.2% for AGIs $75k-100k, 19.4% for AGIs over 100k)
Earned income credit: $1,785 (reported on 25.0% of returns)
Here:
$1,785
State:
$1,734
Percentage of individuals using paid preparers for their 2004 taxes: 80.7%
Here:
81%
State:
52%
(% for various income ranges: 85.2% for AGIs below $10k, 81.2% for AGIs $10k-25k, 76.9% for AGIs $25k-50k, 77.5% for AGIs $50k-75k, 79.4% for AGIs $75k-100k, 89.5% for AGIs over 100k)
Household received Food Stamps/SNAP in the past 12 months: 114 Household did not receive Food Stamps/SNAP in the past 12 months: 1,019
Women who had a birth in the past 12 months: 24 (24 now married, 0 unmarried) Women who did not have a birth in the past 12 months: 526 (314 now married, 208 unmarried)
Housing units in zip code 24248 with a mortgage: 428 (18 second mortgage, 18 both second mortgage and home equity loan) Houses without a mortgage: 22
Median monthly owner costs for units with a mortgage: $930 Median monthly owner costs for units without a mortgage: $274
Residents with income below the poverty level in 2022:
This zip code:
15.7%
Whole state:
10.6%
Residents with income below 50% of the poverty level in 2022:
This zip code:
5.3%
Whole state:
5.2%
Median number of rooms in houses and condos:
Here:
6.3
State:
7.0
Median number of rooms in apartments:
Here:
3.2
State:
4.3
Notable locations in this zip code not listed on our city pages
Churches in zip code 24248 include: Chattels Station Church (A), Smith Chapel (B), Ewing Church (C), Walnut Hill Church (D), Marble Hill Church (E), Mount Carmel Church (F), Mountain View Church (G). Display/hide their locations on the map
Cemeteries: Stanley Cemetery (1), Brittain Cemetery (2), Brooks Cemetery (3), Wares Cemetery (4), Chadwell Cemetery (5), Chances Cemetery (6), Colson Cemetery (7). Display/hide their locations on the map
Size of family households: 568 2-persons, 79 3-persons, 125 4-persons, 49 5-persons
Size of nonfamily households: 286 1-person, 10 2-persons, 9 3-persons
185 married couples with children.
40 single-parent households (40 women).
98.5% of residents of 24248 zip code speak English at home.
0.3% of residents speak Spanish at home (100% well).
0.3% of residents speak other Indo-European language at home (100% very well).
Foreign born population: 8 (0.3%) (0.0% of them are naturalized citizens)
:
0.3%
Whole state:
12.7%
167%Netherlands
42%English
18%American
5%Irish
3%European
3%Scotch-Irish
2%German
2%Dutch
Year of entry for the foreign-born population
102010 or later
02000 to 2009
01990 to 1999
49Before 1990
Facilities with environmental interests located in this zip code:
ELYDALE ELEM. (HIGHWAY 58 in EWING, VA)
(National Center for Education Statistics) - STATE ID-0520820 (National Center for Education Statistics) - STATE ID-0520760 Organizations: LEE COUNTY PUBLIC SCHOOLS (SCHOOL DISTRICT)
E GREER & SONS INCORPORATED/EWING PLANT (HWY 58 in EWING, VA)
AIR SYNTHETIC MINOR (AIRS/AFS) STATE MASTER (Virginia pollutants databases) - CEDS-10274, AIR PROGRAM Business SIC classification: ASPHALT PAVING MIXTURES AND BLOCKS Business NAICS classification: ASPHALT PAVING MIXTURE AND BLOCK MANUFACTURING.
Housing units lacking complete plumbing facilities: 8.0% Housing units lacking complete kitchen facilities: 6.2%
86.8%Electricity
5.2%Wood
4.8%Bottled, tank, or LP gas
2.5%No fuel used
1.0%Fuel oil, kerosene, etc.
Population in 1990: 2,599. Population change in the 1990s: +2 (+0.1%).
Place of birth for U.S.-born residents:
This state: 487
Northeast: 17
Midwest: 163
South: 1,706
West: 157
61% of the 24248 zip code residents lived in the same house 5 years ago. Out of people who lived in different houses, 60% lived in this county. Out of people who lived in different counties, 50% lived in Virginia.
98% of the 24248 zip code residents lived in the same house 1 year ago. Out of people who lived in different houses, 147% moved from different state.
Private vs. public school enrollment:
Students in private schools in grades 1 to 8 (elementary and middle school):
Here:
0.0%
Virginia:
13.2%
Students in private schools in grades 9 to 12 (high school):
Here:
0.0%
Virginia:
10.2%
Students in private undergraduate colleges: 135
Here:
92.0%
Virginia:
18.7%
Occupation by median earnings in the past 12 months ($)
97,389Transportation occupations
70,629Production occupations
43,084Management occupations
38,313Education, training, and library occupations
38,042Office and administrative support occupations
32,385Sales and related occupations
Top industries in this zip code by the number of employees in 2005:
Health Care and Social Assistance: Home Health Care Services (10-19: 1)
Administrative and Support and Waste Management and Remediation Services: Solid Waste Collection (5-9: 1)
Other Services (except Public Administration): General Automotive Repair (5-9: 1)
Fatal accident statistics in 2011:
Fatal accident count: 1
Vehicles involved in fatal accidents: 1
Fatal accidents caused by drunken drivers: 0
Fatalities: 2
Persons involved in fatal accidents: 3
Pedestrians involved in fatal accidents: 0
Fatal accident statistics in 2010:
Fatal accident count: 1
Vehicles involved in fatal accidents: 1
Fatal accidents caused by drunken drivers: 1
Fatalities: 1
Persons involved in fatal accidents: 1
Pedestrians involved in fatal accidents: 0
2002 - 2018 National Fire Incident Reporting System (NFIRS) incidents
Based on the data from the years 2002 - 2018 the average number of fire incidents per year is 17. The highest number of fire incidents - 27 took place in 2006, and the least - 8 in 2010. The data has a rising trend.
When looking into fire subcategories, the most reports belonged to: Structure Fires (47.9%), and Outside Fires (29.3%).
Fire incident types reported to NFIRS in Zip Code 24248


 Nearest zip codes: 37752, 40856, 40813, 40863, 37879, 40845.


 Based on the data from the years 2002 - 2018 the average number of fire incidents per year is 17. The highest number of fire incidents - 27 took place in 2006, and the least - 8 in 2010. The data has a rising trend.
 When looking into fire subcategories, the most reports belonged to: Structure Fires (47.9%), and Outside Fires (29.3%).