Estimated zip code population in 2022: 9,815 Zip code population in 2010: 10,791 Zip code population in 2000: 10,430
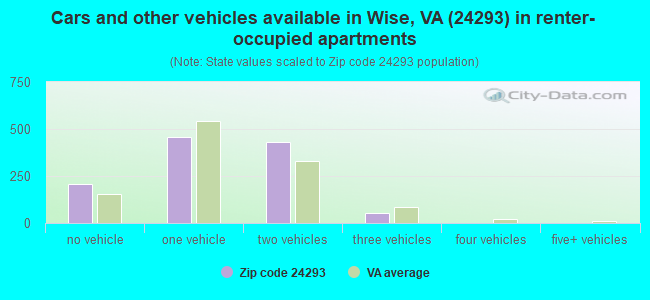
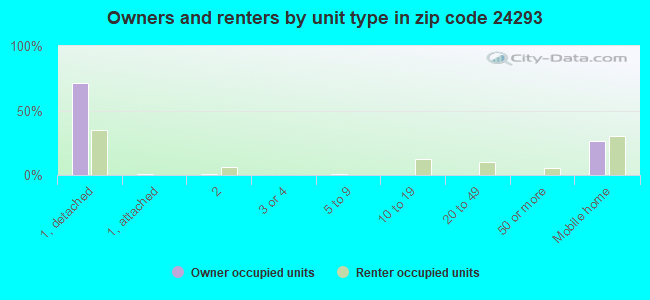
Houses and condos: 4,715 Renter-occupied apartments: 1,151
% of renters here:
28%
State:
33%
March 2022 cost of living index in zip code 24293: 76.1 (low, U.S. average is 100)
Land area: 58.5 sq. mi. Water area: 0.3 sq. mi.
Population density: 168 people per square mile
(very low).
OSM Map
General Map
Google Map
MSN Map
OSM Map
General Map
Google Map
MSN Map
OSM Map
General Map
Google Map
MSN Map
OSM Map
General Map
Google Map
MSN Map
Please wait while loading the map...
Real estate property taxes paid for housing units in 2022:
This zip code:
0.5% ($617)
Virginia:
0.7% ($2,617)
Median real estate property taxes paid for housing units with mortgages in 2022: $928 (0.7%) Median real estate property taxes paid for housing units with no mortgage in 2022: $519 (0.5%)
Business Search- 14 Million verified businesses
Males: 4,642
(47.3%)
Females: 5,172
(52.7%)
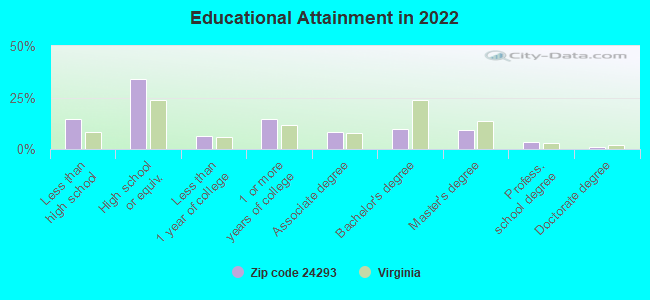
For population 25 years and over in 24293:
High school or higher: 83.9%
Bachelor's degree or higher: 22.6%
Graduate or professional degree: 12.9%
Unemployed: 4.8%
Mean travel time to work (commute): 18.8 minutes
For population 15 years and over in 24293:
Never married: 29.3%
Now married: 51.1%
Separated: 2.3%
Widowed: 6.3%
Divorced: 11.0%
Zip code 24293 compared to state average:
Median household income below state average.
Median house value significantly below state average.
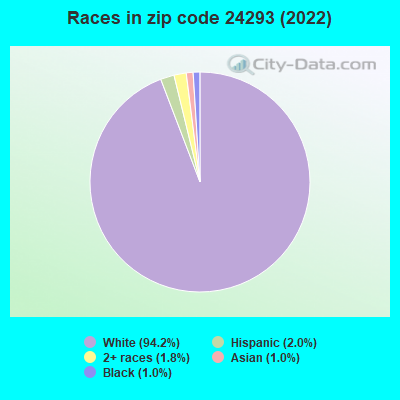
Black race population percentage significantly below state average.
Hispanic race population percentage significantly below state average.
Foreign-born population percentage significantly below state average.
Length of stay since moving in significantly above state average.
Percentage of population with a bachelor's degree or higher below state average.
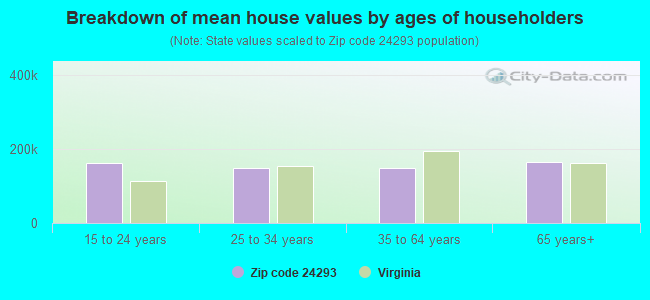
Estimated median house/condo value in 2022: $123,335
24293:
$123,335
Virginia:
$365,700
According to our research of Virginia and other state lists, there were 20 registered sex offenders living in 24293 zip code as of May 28, 2024. The ratio of all residents to sex offenders in zip code 24293 is 505 to 1. The ratio of registered sex offenders to all residents in this zip code is lower than the state average.
Median resident age:
This zip code:
40.8 years
Virginia median age:
39.0 years
Average household size:
This zip code:
2.2 people
Virginia:
2.5 people
Averages for the 2020 tax year for zip code 24293, filed in 2021:
Average Adjusted Gross Income (AGI) in 2020: $52,246 (Individual Income Tax Returns)
Here:
$52,246
State:
$86,446
Salary/wage: $45,258 (reported on 84.4% of returns)
Here:
$45,258
State:
$71,185
(% of AGI for various income ranges: 1117.5% for AGIs below $25k, 3433.9% for AGIs $25k-50k, 6107.1% for AGIs $50k-75k, 8850.0% for AGIs $75k-100k, 14981.4% for AGIs $100k-200k, 36440.0% for AGIs over 200k)
Taxable interest for individuals: $1,455 (reported on 28.6% of returns)
This zip code:
$1,455
Virginia:
$1,805
(% of AGI for various income ranges: 12.7% for AGIs below $25k, 13.5% for AGIs $25k-50k, 43.9% for AGIs $50k-75k, 42.3% for AGIs $75k-100k, 172.4% for AGIs $100k-200k, 1390.0% for AGIs over 200k)
Ordinary dividends: $5,041 (reported on 10.1% of returns)
Here:
$5,041
State:
$8,327
(% of AGI for various income ranges: 9.0% for AGIs below $25k, 15.7% for AGIs $25k-50k, 42.9% for AGIs $50k-75k, 97.3% for AGIs $75k-100k, 234.5% for AGIs $100k-200k, 1565.0% for AGIs over 200k)
Net capital gain/loss in AGI: +$7,600 (reported on 8.8% of returns)
Here:
+$7,600
State:
+$24,644
(% of AGI for various income ranges: 11.2% for AGIs below $25k, 2.3% for AGIs $25k-50k, 29.8% for AGIs $50k-75k, 120.4% for AGIs $75k-100k, 228.3% for AGIs $100k-200k, 3355.0% for AGIs over 200k)
Profit/loss from business: +$11,173 (reported on 11.4% of returns)
Here:
+$11,173
State:
+$12,836
(% of AGI for various income ranges: 62.8% for AGIs below $25k, 91.8% for AGIs $25k-50k, 59.5% for AGIs $50k-75k, 176.2% for AGIs $75k-100k, 477.2% for AGIs $100k-200k, 3412.5% for AGIs over 200k)
Taxable individual retirement arrangement distribution: $15,955 (reported on 7.5% of returns)
24293:
$15,955
Virginia:
$21,535
(% of AGI for various income ranges: 46.0% for AGIs below $25k, 61.6% for AGIs $25k-50k, 265.9% for AGIs $50k-75k, 179.2% for AGIs $75k-100k, 705.2% for AGIs $100k-200k)
Total itemized deductions: $30,278 (reported on 2.3% of returns)
Here:
$30,278
State:
$33,287
(% of AGI for various income ranges: 171.5% for AGIs $50k-75k, 392.4% for AGIs $100k-200k, 2210.0% for AGIs over 200k)
Charity contributions: $15,950 (reported on 2.1% of returns)
Here:
$15,950
State:
$10,381
(% of AGI for various income ranges: 42.7% for AGIs $50k-75k, 379.7% for AGIs $100k-200k)
Taxes paid: $6,978 (reported on 2.3% of returns)
24293:
$6,978
State:
$8,284
(% of AGI for various income ranges: 37.3% for AGIs $50k-75k, 94.8% for AGIs $100k-200k, 500.0% for AGIs over 200k)
Earned income credit: $2,259 (reported on 19.7% of returns)
Here:
$2,259
State:
$2,214
(% of AGI for various income ranges: 96.2% for AGIs below $25k, 77.1% for AGIs $25k-50k)
Percentage of individuals using paid preparers for their 2020 taxes: 83.6%
Here:
84%
State:
92%
(% for various income ranges: 81.2% for AGIs below $25k, 82.8% for AGIs $25k-50k, 85.5% for AGIs $50k-75k, 85.3% for AGIs $75k-100k, 88.9% for AGIs $100k-200k, 87.5% for AGIs over 200k)
Averages for the 2012 tax year for zip code 24293, filed in 2013:
Average Adjusted Gross Income (AGI) in 2012: $50,482 (Individual Income Tax Returns)
Here:
$50,482
State:
$71,192
Salary/wage: $44,105 (reported on 88.3% of returns)
Here:
$44,105
State:
$59,229
(% of AGI for various income ranges: 79.5% for AGIs below $25k, 82.3% for AGIs $25k-50k, 82.4% for AGIs $50k-75k, 83.0% for AGIs $75k-100k, 76.7% for AGIs $100k-200k, 57.3% for AGIs over 200k)
Taxable interest for individuals: $1,312 (reported on 28.8% of returns)
This zip code:
$1,312
Virginia:
$1,600
(% of AGI for various income ranges: 0.8% for AGIs below $25k, 0.6% for AGIs $25k-50k, 0.4% for AGIs $50k-75k, 0.4% for AGIs $75k-100k, 0.9% for AGIs $100k-200k, 1.5% for AGIs over 200k)
Ordinary dividends: $4,161 (reported on 11.4% of returns)
Here:
$4,161
State:
$6,959
(% of AGI for various income ranges: 0.6% for AGIs below $25k, 0.5% for AGIs $25k-50k, 0.2% for AGIs $50k-75k, 0.3% for AGIs $75k-100k, 1.1% for AGIs $100k-200k, 3.1% for AGIs over 200k)
Net capital gain/loss in AGI: +$7,084 (reported on 7.9% of returns)
Here:
+$7,084
State:
+$16,672
(% of AGI for various income ranges: 0.5% for AGIs $25k-50k, 0.2% for AGIs $50k-75k, 0.5% for AGIs $75k-100k, 0.2% for AGIs $100k-200k, 5.8% for AGIs over 200k)
Profit/loss from business: +$12,811 (reported on 11.4% of returns)
Here:
+$12,811
State:
+$14,116
(% of AGI for various income ranges: 5.1% for AGIs below $25k, 2.1% for AGIs $25k-50k, 1.4% for AGIs $50k-75k, 1.7% for AGIs $75k-100k, 2.0% for AGIs $100k-200k, 7.0% for AGIs over 200k)
Taxable individual retirement arrangement distribution: $13,763 (reported on 6.7% of returns)
24293:
$13,763
Virginia:
$16,667
(% of AGI for various income ranges: 2.0% for AGIs below $25k, 1.3% for AGIs $25k-50k, 1.2% for AGIs $50k-75k, 2.2% for AGIs $75k-100k, 3.6% for AGIs $100k-200k)
Total itemized deductions: $20,230 (18% of AGI, reported on 19.1% of returns)
Here:
$20,230
State:
$26,596
Here:
17.8% of AGI
State:
20.1% of AGI
(% of AGI for various income ranges: 4.3% for AGIs below $25k, 3.8% for AGIs $25k-50k, 5.5% for AGIs $50k-75k, 7.4% for AGIs $75k-100k, 10.8% for AGIs $100k-200k, 12.4% for AGIs over 200k)
Charity contributions: $5,458 (reported on 14.1% of returns)
Here:
$5,458
State:
$4,443
(% of AGI for various income ranges: 0.5% for AGIs below $25k, 0.5% for AGIs $25k-50k, 1.0% for AGIs $50k-75k, 1.5% for AGIs $75k-100k, 2.5% for AGIs $100k-200k, 2.5% for AGIs over 200k)
Taxes paid: $7,450 (reported on 18.9% of returns)
24293:
$7,450
State:
$9,951
(% of AGI for various income ranges: 0.5% for AGIs below $25k, 0.7% for AGIs $25k-50k, 1.3% for AGIs $50k-75k, 2.6% for AGIs $75k-100k, 4.2% for AGIs $100k-200k, 6.6% for AGIs over 200k)
Earned income credit: $2,153 (reported on 21.3% of returns)
Here:
$2,153
State:
$2,211
(% of AGI for various income ranges: 6.9% for AGIs below $25k, 1.4% for AGIs $25k-50k)
Percentage of individuals using paid preparers for their 2012 taxes: 46.2%
Here:
46%
State:
46%
(% for various income ranges: 38.4% for AGIs below $25k, 42.2% for AGIs $25k-50k, 45.5% for AGIs $50k-75k, 61.5% for AGIs $75k-100k, 66.7% for AGIs $100k-200k, 87.5% for AGIs over 200k)
Averages for the 2004 tax year for zip code 24293, filed in 2005:
Average Adjusted Gross Income (AGI) in 2004: $40,456 (Individual Income Tax Returns)
Here:
$40,456
State:
$56,704
Salary/wage: $35,742 (reported on 88.9% of returns)
Here:
$35,742
State:
$48,441
(% of AGI for various income ranges: 108.9% for AGIs below $10k, 82.0% for AGIs $10k-25k, 88.3% for AGIs $25k-50k, 88.3% for AGIs $50k-75k, 88.2% for AGIs $75k-100k, 54.4% for AGIs over 100k)
Taxable interest for individuals: $2,134 (reported on 32.8% of returns)
This zip code:
$2,134
Virginia:
$1,688
(% of AGI for various income ranges: 2.9% for AGIs below $10k, 2.7% for AGIs $10k-25k, 0.9% for AGIs $25k-50k, 1.1% for AGIs $50k-75k, 0.6% for AGIs $75k-100k, 3.0% for AGIs over 100k)
Taxable dividends: $3,429 (reported on 12.2% of returns)
Here:
$3,429
State:
$4,028
(% of AGI for various income ranges: 1.4% for AGIs below $10k, 0.7% for AGIs $10k-25k, 0.3% for AGIs $25k-50k, 0.4% for AGIs $50k-75k, 0.6% for AGIs $75k-100k, 2.4% for AGIs over 100k)
Net capital gain/loss: +$14,589 (reported on 9.3% of returns)
Here:
+$14,589
State:
+$14,375
(% of AGI for various income ranges: 0.0% for AGIs below $10k, 0.4% for AGIs $10k-25k, 0.6% for AGIs $25k-50k, 0.6% for AGIs $50k-75k, 0.7% for AGIs $75k-100k, 10.4% for AGIs over 100k)
Profit/loss from business: +$7,554 (reported on 11.2% of returns)
Here:
+$7,554
State:
+$13,342
(% of AGI for various income ranges: 3.5% for AGIs below $10k, 4.6% for AGIs $10k-25k, 2.4% for AGIs $25k-50k, 0.2% for AGIs $50k-75k, 0.6% for AGIs $75k-100k, 3.1% for AGIs over 100k)
IRA payment deduction: $3,367 (reported on 2.0% of returns)
24293:
$3,367
Virginia:
$2,943
(% of AGI for various income ranges: 0.2% for AGIs $10k-25k, 0.2% for AGIs $25k-50k, 0.1% for AGIs $50k-75k, 0.2% for AGIs $75k-100k, 0.2% for AGIs over 100k)
Total itemized deductions: $17,137 (17% of AGI, reported on 16.5% of returns)
Here:
$17,137
State:
$21,492
Here:
16.8% of AGI
State:
21.0% of AGI
(% of AGI for various income ranges: 2.4% for AGIs below $10k, 3.7% for AGIs $10k-25k, 5.1% for AGIs $25k-50k, 5.8% for AGIs $50k-75k, 10.3% for AGIs $75k-100k, 9.6% for AGIs over 100k)
Charity contributions deductions: $5,163 (5% of AGI, reported on 13.9% of returns)
Here:
$5,163
State:
$3,794
Here:
4.7% of AGI
State:
3.5% of AGI
(% of AGI for various income ranges: 1.0% for AGIs $10k-25k, 0.6% for AGIs $25k-50k, 1.2% for AGIs $50k-75k, 2.5% for AGIs $75k-100k, 3.2% for AGIs over 100k)
Total tax: $7,095 (reported on 72.0% of returns)
24293:
$7,095
State:
$9,537
(% of AGI for various income ranges: 2.4% for AGIs below $10k, 3.8% for AGIs $10k-25k, 6.4% for AGIs $25k-50k, 8.6% for AGIs $50k-75k, 11.1% for AGIs $75k-100k, 25.7% for AGIs over 100k)
Earned income credit: $1,607 (reported on 19.8% of returns)
Here:
$1,607
State:
$1,734
Percentage of individuals using paid preparers for their 2004 taxes: 51.3%
Here:
51%
State:
52%
(% for various income ranges: 42.7% for AGIs below $10k, 51.8% for AGIs $10k-25k, 51.4% for AGIs $25k-50k, 53.3% for AGIs $50k-75k, 57.8% for AGIs $75k-100k, 71.5% for AGIs over 100k)
Likely homosexual households (counted as self-reported same-sex unmarried-partner households)
Lesbian couples: 0.2% of all households
Gay men: 0.7% of all households
Household received Food Stamps/SNAP in the past 12 months: 822 Household did not receive Food Stamps/SNAP in the past 12 months: 3,382
Women who had a birth in the past 12 months: 124 (79 now married, 43 unmarried) Women who did not have a birth in the past 12 months: 2,345 (949 now married, 1,398 unmarried)
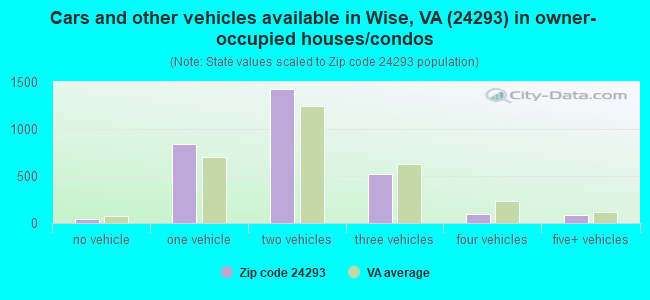
Housing units in zip code 24293 with a mortgage: 1,121 (24 second mortgage, 18 both second mortgage and home equity loan) Houses without a mortgage: 13
Median monthly owner costs for units with a mortgage: $1,103 Median monthly owner costs for units without a mortgage: $362
Residents with income below the poverty level in 2022:
This zip code:
23.0%
Whole state:
10.6%
Residents with income below 50% of the poverty level in 2022:
This zip code:
12.9%
Whole state:
5.2%
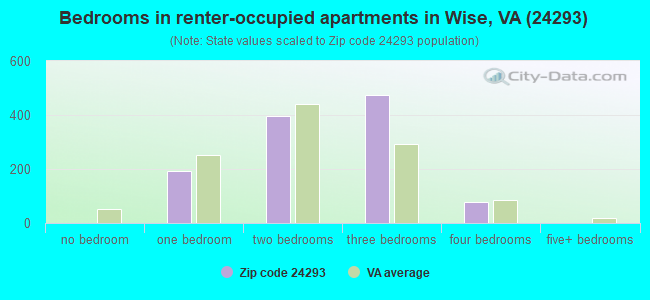
Median number of rooms in houses and condos:
Here:
6.2
State:
7.0
Median number of rooms in apartments:
Here:
4.6
State:
4.3
Notable locations in this zip code not listed on our city pages
Notable locations in zip code 24293: Rock Switch (A), Duncan Gap (B), Camp Bethel (C), Honaker Volunteer Fire Department (D), Clinch Ranger District Office (E). Display/hide their locations on the map
Churches in zip code 24293 include: Addison Chapel (A), Beckner Chapel (B), Berry Chapel (C), Calvary Chapel (D), Glamorgan Chapel (E), Hurricane Church (F), Mount Olive Church (G), Mountain View Church (H), Nash Chapel (I). Display/hide their locations on the map
Cemeteries: Page Cemetery (1), Parsons Cemetery (2), Perry Cemetery (3), Powers Cemetery (4), Reed Cemetery (5), Robinson Cemetery (6), Round Top Cemetery (7). Display/hide their locations on the map
Streams, rivers, and creeks: Turkey Branch (A), Trace Fork (B), Steve Horn Branch (C), Steer Branch (D), Steel Fork (E), Yellow Creek (F), Potcamp Branch (G), Rock Creek (H), Roberts Branch (I). Display/hide their locations on the map
In group quarters: 581 (-1 institutionalized population)
Size of family households: 1,276 2-persons, 883 3-persons, 476 4-persons, 90 5-persons, 29 6-persons, 20 7-or-more-persons
Size of nonfamily households: 1,111 1-person, 212 2-persons, 30 3-persons
909 married couples with children.
607 single-parent households (142 men, 465 women).
97.5% of residents of 24293 zip code speak English at home.
1.4% of residents speak Spanish at home (100% very well).
0.6% of residents speak other Indo-European language at home (89% very well, 11% well).
0.2% of residents speak Asian or Pacific Island language at home (21% very well, 79% well).
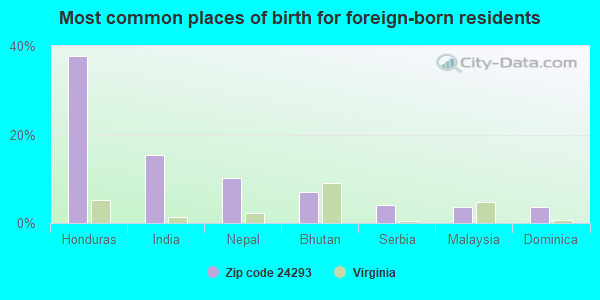
Foreign born population: 243 (2.5%) (45.9% of them are naturalized citizens)
This zip code:
2.5%
Whole state:
12.7%
38%Honduras
15%India
10%Nepal
7%Bhutan
4%Serbia
4%Malaysia
4%Dominica
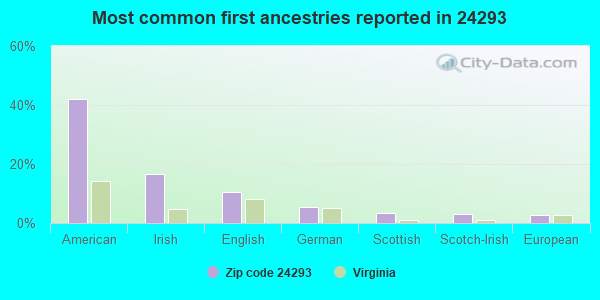
42%American
17%Irish
10%English
5%German
3%Scottish
3%Scotch-Irish
3%European
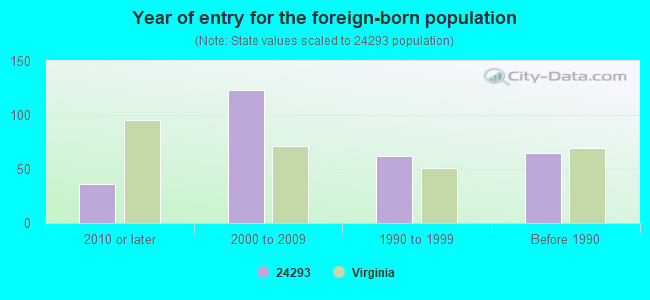
Year of entry for the foreign-born population
362010 or later
1232000 to 2009
621990 to 1999
65Before 1990
Facilities with environmental interests located in this zip code:
APPALACHIAN REGIONAL HOSPITAL (147 HOSPITAL DRBUS RT 23-.5 MI E OF US 23 in WISE, VA)
AIR MINOR (AIRS/AFS) STATE MASTER (Virginia pollutants databases) - CEDS-10363, AIR PROGRAM Conditionally Exempt Small Quantity Generators, less than 100 kg/month of hazardous waste (Resource Conservation and Recovery Act (tracking hazardous waste)) - notification Business SIC and NAICS classification: GENERAL MEDICAL AND SURGICAL HOSPITALS Organizations: APPALACHIAN REGIONAL HEALTHCARE (CONTACT/OWNER)
Alternative names: WISE APPALACHIAN REGIONAL HOSP
APPALACHIAN RESOURCES INCORPORATED (RTE 23 & 624 in WISE, VA)
AIR SYNTHETIC MINOR (AIRS/AFS) STATE MASTER (Virginia pollutants databases) - CEDS-10790, AIR PROGRAM Business SIC and NAICS classification: BITUMINOUS COAL AND LIGNITE SURFACE MINING Alternative names: GLAMORGAN/WISE DOCK # 2
BELL ATLANTIC (VIRGINIA AVE & MAIN ST in WISE, VA)
Conditionally Exempt Small Quantity Generators, less than 100 kg/month of hazardous waste (Resource Conservation and Recovery Act (tracking hazardous waste)) - notification Organizations: C&P TELEPHONE CO THE (CONTACT/OWNER)
Alternative names: C&P TELEPHONE CO OF CA THE
COASTAL MARKT INC #812 (BOX 431 CORNER PARK AVE/COBURN in WISE, VA)
Conditionally Exempt Small Quantity Generators, less than 100 kg/month of hazardous waste (Resource Conservation and Recovery Act (tracking hazardous waste)) Organizations: OPERNAME (CONTACT/OPERATOR)
Housing units lacking complete plumbing facilities: 4.0% Housing units lacking complete kitchen facilities: 4.8%
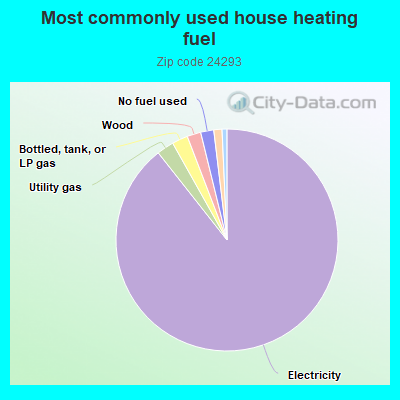
89.2%Electricity
2.5%Utility gas
2.3%Bottled, tank, or LP gas
2.0%Wood
1.9%No fuel used
1.2%Fuel oil, kerosene, etc.
0.7%Coal or coke
Population in 1990: 8,957. Population change in the 1990s: +1,473 (+16.4%).
Place of birth for U.S.-born residents:
This state: 6,884
Northeast: 215
Midwest: 395
South: 1,798
West: 169
61% of the 24293 zip code residents lived in the same house 5 years ago. Out of people who lived in different houses, 55% lived in this county. Out of people who lived in different counties, 50% lived in Virginia.
89% of the 24293 zip code residents lived in the same house 1 year ago. Out of people who lived in different houses, 55% moved from this county. Out of people who lived in different houses, 20% moved from different county within same state. Out of people who lived in different houses, 18% moved from different state. Out of people who lived in different houses, 4% moved from abroad.
Private vs. public school enrollment:
Students in private schools in grades 1 to 8 (elementary and middle school): 56
Here:
8.0%
Virginia:
13.2%
Students in private schools in grades 9 to 12 (high school): 55
Here:
18.1%
Virginia:
10.2%
Students in private undergraduate colleges: 88
Here:
10.1%
Virginia:
18.7%
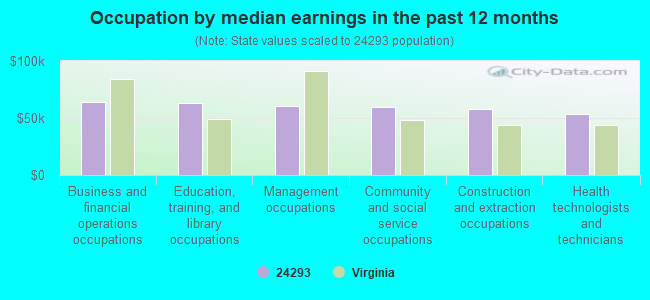
Occupation by median earnings in the past 12 months ($)
64,003Business and financial operations occupations
63,313Education, training, and library occupations
60,785Management occupations
59,879Community and social service occupations
58,204Construction and extraction occupations
53,098Health technologists and technicians
Companies with federal contracts located in this zip code:
Y & Y SERVICES, INC (5717 ROCK BAR ROAD in WISE, VA; small business) : $29,574 in 15 contractsfrom 2001 to 2004
Contracts for Trash/Garbage Collection Services - Including Portable Sanitation Services, Waste Treatment and Storage, Construction of Structures and Facilities -- Sewage and Waste Facilities, Sewage Treatment Equipment by Army, U.S. Army Corps of Engineers - civil program financing only Signed by year:2000: $0; 2001: $3,770; 2002: $6,440; 2003: $960; 2004: $18,404; 2005: $0; 2006: $0.
Biggest contracts:
$5,296 with Army for Trash/Garbage Collection Services - Including Portable Sanitation Services. Taking place in WV. Signed on 2004-10-12. Completion date: 2004-10-01.
$5,296 with U.S. Army Corps of Engineers - civil program financing only for Trash/Garbage Collection Services - Including Portable Sanitation Services. Taking place in WV. Signed on 2004-10-12. Completion date: 2004-10-01.
$3,940 with U.S. Army Corps of Engineers - civil program financing only for Waste Treatment and Storage. Taking place in WV. Signed on 2002-11-08. Completion date: 2003-09-30.
$3,770 with U.S. Army Corps of Engineers - civil program financing only for Construction of Structures and Facilities -- Sewage and Waste Facilities. Signed on 2001-11-14. Completion date: 2001-08-28.
ROBIN V FANNON (610 BLANTON AVE in WISE, VA; small business) : $28,990 in 3 contractsfrom 2002 to 2003
$17,550 with Forest Service for Laundry and DryCleaning Services. Signed on 2003-07-15. Completion date: 2004-06-15.
$12,594, same as above.Signed on 2002-10-15. Completion date: 2003-06-15.
-$1,154, same as above.Signed on 2002-10-15. Completion date: 2003-06-15.
SPORTSWISE, INC (130 MAIN ST in WISE, VA; small business)
$12,959 with Bureau of Prisoners/Federal Prison System for Outerwear, Men's. Signed on 2006-09-26. Completion date: 2006-09-30.
Top industries in this zip code by the number of employees in 2005:
Management of Companies and Enterprises: Corporate, Subsidiary, and Regional Managing Offices (20-49: 3, 5-9: 1)
People in group quarters in 2010:
669 people in college/university student housing
78 people in nursing facilities/skilled-nursing facilities
People in group quarters in 2000:
409 people in college dormitories (includes college quarters off campus)
172 people in local jails and other confinement facilities (including police lockups)
89 people in nursing homes
39 people in homes or halfway houses for drug/alcohol abuse
Fatal accident statistics in 2014:
Fatal accident count: 2
Vehicles involved in fatal accidents: 3
Fatal accidents caused by drunken drivers: 1
Fatalities: 2
Persons involved in fatal accidents: 4
Pedestrians involved in fatal accidents: 0
Fatal accident statistics in 2013:
Fatal accident count: 1
Vehicles involved in fatal accidents: 1
Fatal accidents caused by drunken drivers: 0
Fatalities: 1
Persons involved in fatal accidents: 1
Pedestrians involved in fatal accidents: 0
2002 - 2016 National Fire Incident Reporting System (NFIRS) incidents
Based on the data from the years 2002 - 2016 the average number of fires per year is 14. The highest number of fire incidents - 47 took place in 2007, and the least - 0 in 2003. The data has a constant trend.
When looking into fire subcategories, the most reports belonged to: Structure Fires (41.3%), and Outside Fires (36.4%).
Fire incident types reported to NFIRS in Zip Code 24293


 Nearest zip codes: 24279, 24230, 24273, 24245, 24269, 24228.


 Based on the data from the years 2002 - 2016 the average number of fires per year is 14. The highest number of fire incidents - 47 took place in 2007, and the least - 0 in 2003. The data has a constant trend.
 When looking into fire subcategories, the most reports belonged to: Structure Fires (41.3%), and Outside Fires (36.4%).