Estimated zip code population in 2022: 2,082 Zip code population in 2010: 2,271 Zip code population in 2000: 2,236
Houses and condos: 993 Renter-occupied apartments: 95
% of renters here:
11%
State:
33%
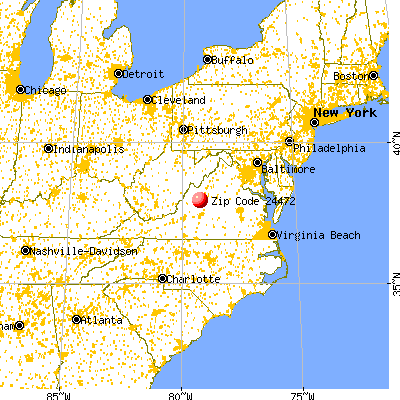
March 2022 cost of living index in zip code 24472: 86.5 (less than average, U.S. average is 100)
Land area: 64.0 sq. mi. Water area: 0.1 sq. mi.
Population density: 33 people per square mile
(very low).
OSM Map
General Map
Google Map
MSN Map
OSM Map
General Map
Google Map
MSN Map
OSM Map
General Map
Google Map
MSN Map
OSM Map
General Map
Google Map
MSN Map
Please wait while loading the map...
Real estate property taxes paid for housing units in 2022:
This zip code:
0.5% ($1,474)
Virginia:
0.7% ($2,617)
Median real estate property taxes paid for housing units with mortgages in 2022: $1,704 (0.5%) Median real estate property taxes paid for housing units with no mortgage in 2022: $1,327 (0.6%)
Business Search- 14 Million verified businesses
Males: 1,020
(49.0%)
Females: 1,061
(51.0%)
For population 25 years and over in 24472:
High school or higher: 91.0%
Bachelor's degree or higher: 26.3%
Graduate or professional degree: 10.8%
Unemployed: 9.5%
Mean travel time to work (commute): 30.0 minutes
For population 15 years and over in 24472:
Never married: 23.9%
Now married: 59.2%
Separated: 3.8%
Widowed: 8.0%
Divorced: 5.0%
Zip code 24472 compared to state average:
Median household income below state average.
Unemployed percentage above state average.
Black race population percentage significantly below state average.
Hispanic race population percentage significantly below state average.
Median age significantly above state average.
Foreign-born population percentage significantly below state average.
Renting percentage significantly below state average.
Length of stay since moving in significantly above state average.
Averages for the 2020 tax year for zip code 24472, filed in 2021:
Average Adjusted Gross Income (AGI) in 2020: $58,873 (Individual Income Tax Returns)
Here:
$58,873
State:
$86,446
Salary/wage: $43,155 (reported on 80.9% of returns)
Here:
$43,155
State:
$71,185
(% of AGI for various income ranges: 1296.1% for AGIs below $25k, 3458.3% for AGIs $25k-50k, 5889.2% for AGIs $50k-75k, 7167.8% for AGIs $75k-100k, 14785.6% for AGIs $100k-200k)
Taxable interest for individuals: $1,709 (reported on 31.8% of returns)
This zip code:
$1,709
Virginia:
$1,805
(% of AGI for various income ranges: 11.1% for AGIs below $25k, 22.6% for AGIs $25k-50k, 52.5% for AGIs $50k-75k, 27.8% for AGIs $75k-100k, 251.1% for AGIs $100k-200k)
Ordinary dividends: $8,210 (reported on 18.2% of returns)
Here:
$8,210
State:
$8,327
(% of AGI for various income ranges: 13.2% for AGIs below $25k, 48.7% for AGIs $25k-50k, 141.7% for AGIs $50k-75k, 257.8% for AGIs $75k-100k, 1212.2% for AGIs $100k-200k)
Net capital gain/loss in AGI: +$25,463 (reported on 17.3% of returns)
Here:
+$25,463
State:
+$24,644
(% of AGI for various income ranges: 1.1% for AGIs below $25k, 28.7% for AGIs $25k-50k, 129.2% for AGIs $50k-75k, 85.6% for AGIs $75k-100k, 5041.1% for AGIs $100k-200k)
Profit/loss from business: +$9,653 (reported on 13.6% of returns)
Here:
+$9,653
State:
+$12,836
(% of AGI for various income ranges: 130.7% for AGIs below $25k, 111.3% for AGIs $25k-50k, 438.3% for AGIs $50k-75k, 333.3% for AGIs $100k-200k)
Taxable individual retirement arrangement distribution: $20,014 (reported on 12.7% of returns)
24472:
$20,014
Virginia:
$21,535
(% of AGI for various income ranges: 53.6% for AGIs below $25k, 109.6% for AGIs $25k-50k, 235.0% for AGIs $50k-75k, 583.3% for AGIs $75k-100k, 1770.0% for AGIs $100k-200k)
Total itemized deductions: $32,400 (reported on 7.3% of returns)
Here:
$32,400
State:
$33,287
(% of AGI for various income ranges: 789.2% for AGIs $50k-75k, 1827.8% for AGIs $100k-200k)
Charity contributions: $15,200 (reported on 5.5% of returns)
Here:
$15,200
State:
$10,381
(% of AGI for various income ranges: 146.7% for AGIs $50k-75k, 817.8% for AGIs $100k-200k)
Taxes paid: $6,762 (reported on 7.3% of returns)
24472:
$6,762
State:
$8,284
(% of AGI for various income ranges: 176.7% for AGIs $50k-75k, 365.6% for AGIs $100k-200k)
Earned income credit: $2,322 (reported on 16.4% of returns)
Here:
$2,322
State:
$2,214
(% of AGI for various income ranges: 87.1% for AGIs below $25k, 75.7% for AGIs $25k-50k)
Percentage of individuals using paid preparers for their 2020 taxes: 93.6%
Here:
94%
State:
92%
(% for various income ranges: 92.1% for AGIs below $25k, 96.4% for AGIs $25k-50k, 93.8% for AGIs $50k-75k, 90.9% for AGIs $75k-100k, 93.3% for AGIs $100k-200k, 100.0% for AGIs over 200k)
Averages for the 2012 tax year for zip code 24472, filed in 2013:
Average Adjusted Gross Income (AGI) in 2012: $47,641 (Individual Income Tax Returns)
Here:
$47,641
State:
$71,192
Salary/wage: $38,338 (reported on 81.2% of returns)
Here:
$38,338
State:
$59,229
(% of AGI for various income ranges: 73.6% for AGIs below $25k, 79.1% for AGIs $25k-50k, 68.3% for AGIs $50k-75k, 67.0% for AGIs $75k-100k, 51.6% for AGIs $100k-200k)
Taxable interest for individuals: $1,522 (reported on 41.7% of returns)
This zip code:
$1,522
Virginia:
$1,600
(% of AGI for various income ranges: 1.6% for AGIs below $25k, 0.9% for AGIs $25k-50k, 0.9% for AGIs $50k-75k, 0.7% for AGIs $75k-100k, 2.1% for AGIs $100k-200k)
Ordinary dividends: $8,244 (reported on 18.8% of returns)
Here:
$8,244
State:
$6,959
(% of AGI for various income ranges: 2.1% for AGIs below $25k, 0.9% for AGIs $25k-50k, 2.8% for AGIs $50k-75k, 2.0% for AGIs $75k-100k, 6.0% for AGIs $100k-200k)
Net capital gain/loss in AGI: +$3,029 (reported on 14.6% of returns)
Here:
+$3,029
State:
+$16,672
(% of AGI for various income ranges: 0.7% for AGIs $50k-75k, 0.3% for AGIs $75k-100k, 2.6% for AGIs $100k-200k)
Profit/loss from business: +$6,153 (reported on 15.6% of returns)
Here:
+$6,153
State:
+$14,116
(% of AGI for various income ranges: 6.3% for AGIs below $25k, 1.8% for AGIs $25k-50k, 4.5% for AGIs $50k-75k, 1.3% for AGIs $75k-100k)
Taxable individual retirement arrangement distribution: $10,869 (reported on 13.5% of returns)
24472:
$10,869
Virginia:
$16,667
(% of AGI for various income ranges: 2.9% for AGIs below $25k, 3.0% for AGIs $25k-50k, 4.9% for AGIs $50k-75k, 7.0% for AGIs $75k-100k)
Total itemized deductions: $21,523 (24% of AGI, reported on 27.1% of returns)
Here:
$21,523
State:
$26,596
Here:
23.6% of AGI
State:
20.1% of AGI
(% of AGI for various income ranges: 7.2% for AGIs below $25k, 10.0% for AGIs $25k-50k, 10.8% for AGIs $50k-75k, 15.1% for AGIs $75k-100k, 14.3% for AGIs $100k-200k)
Charity contributions: $6,024 (reported on 21.9% of returns)
Here:
$6,024
State:
$4,443
(% of AGI for various income ranges: 1.7% for AGIs $25k-50k, 1.5% for AGIs $50k-75k, 3.7% for AGIs $75k-100k, 4.4% for AGIs $100k-200k)
Taxes paid: $6,377 (reported on 27.1% of returns)
24472:
$6,377
State:
$9,951
(% of AGI for various income ranges: 1.0% for AGIs below $25k, 2.3% for AGIs $25k-50k, 3.1% for AGIs $50k-75k, 3.9% for AGIs $75k-100k, 5.4% for AGIs $100k-200k)
Earned income credit: $2,300 (reported on 17.7% of returns)
Here:
$2,300
State:
$2,211
(% of AGI for various income ranges: 6.1% for AGIs below $25k, 1.0% for AGIs $25k-50k)
Percentage of individuals using paid preparers for their 2012 taxes: 51.0%
Here:
51%
State:
46%
(% for various income ranges: 42.1% for AGIs below $25k, 51.9% for AGIs $25k-50k, 58.3% for AGIs $50k-75k, 60.0% for AGIs $75k-100k, 66.7% for AGIs $100k-200k)
Averages for the 2004 tax year for zip code 24472, filed in 2005:
Average Adjusted Gross Income (AGI) in 2004: $39,685 (Individual Income Tax Returns)
Here:
$39,685
State:
$56,704
Salary/wage: $33,539 (reported on 82.3% of returns)
Here:
$33,539
State:
$48,441
(% of AGI for various income ranges: 120.0% for AGIs below $10k, 76.2% for AGIs $10k-25k, 75.7% for AGIs $25k-50k, 76.9% for AGIs $50k-75k, 78.6% for AGIs $75k-100k, 40.8% for AGIs over 100k)
Taxable interest for individuals: $1,504 (reported on 48.4% of returns)
This zip code:
$1,504
Virginia:
$1,688
(% of AGI for various income ranges: 11.1% for AGIs below $10k, 3.6% for AGIs $10k-25k, 1.8% for AGIs $25k-50k, 1.1% for AGIs $50k-75k, 1.5% for AGIs $75k-100k, 1.4% for AGIs over 100k)
Taxable dividends: $6,219 (reported on 22.7% of returns)
Here:
$6,219
State:
$4,028
(% of AGI for various income ranges: 5.6% for AGIs below $10k, 2.5% for AGIs $10k-25k, 1.1% for AGIs $25k-50k, 1.9% for AGIs $50k-75k, 5.5% for AGIs $75k-100k, 6.8% for AGIs over 100k)
Net capital gain/loss: +$12,733 (reported on 16.2% of returns)
Here:
+$12,733
State:
+$14,375
(% of AGI for various income ranges: -0.9% for AGIs below $10k, 1.0% for AGIs $10k-25k, 2.1% for AGIs $25k-50k, 2.2% for AGIs $50k-75k, 1.7% for AGIs $75k-100k, 17.0% for AGIs over 100k)
Profit/loss from business: +$7,713 (reported on 14.7% of returns)
Here:
+$7,713
State:
+$13,342
(% of AGI for various income ranges: -3.6% for AGIs below $10k, 1.6% for AGIs $10k-25k, 5.8% for AGIs $25k-50k, 1.2% for AGIs $50k-75k, 3.3% for AGIs $75k-100k, 2.6% for AGIs over 100k)
IRA payment deduction: $3,188 (reported on 1.7% of returns)
24472:
$3,188
Virginia:
$2,943
Total itemized deductions: $16,875 (23% of AGI, reported on 25.9% of returns)
Here:
$16,875
State:
$21,492
Here:
23.2% of AGI
State:
21.0% of AGI
(% of AGI for various income ranges: 8.7% for AGIs $10k-25k, 8.3% for AGIs $25k-50k, 12.2% for AGIs $50k-75k, 12.0% for AGIs $75k-100k, 13.7% for AGIs over 100k)
Charity contributions deductions: $3,105 (4% of AGI, reported on 21.6% of returns)
Here:
$3,105
State:
$3,794
Here:
4.0% of AGI
State:
3.5% of AGI
(% of AGI for various income ranges: 1.5% for AGIs $10k-25k, 1.3% for AGIs $25k-50k, 1.5% for AGIs $50k-75k, 1.7% for AGIs $75k-100k, 2.5% for AGIs over 100k)
Total tax: $4,876 (reported on 77.6% of returns)
24472:
$4,876
State:
$9,537
(% of AGI for various income ranges: 2.6% for AGIs below $10k, 4.3% for AGIs $10k-25k, 6.9% for AGIs $25k-50k, 8.5% for AGIs $50k-75k, 10.4% for AGIs $75k-100k, 15.9% for AGIs over 100k)
Earned income credit: $1,568 (reported on 15.0% of returns)
Here:
$1,568
State:
$1,734
Percentage of individuals using paid preparers for their 2004 taxes: 57.4%
Here:
57%
State:
52%
(% for various income ranges: 53.5% for AGIs below $10k, 57.5% for AGIs $10k-25k, 54.7% for AGIs $25k-50k, 62.2% for AGIs $50k-75k, 54.7% for AGIs $75k-100k, 72.9% for AGIs over 100k)
Notable locations in zip code 24472: Pkin (A), Bald Mountain Overlook (B), Mulberry Grove (C), Raphine Fire Department (D). Display/hide their locations on the map
Churches in zip code 24472 include: Marlbrook Church (A), Mount Carmel Church (B), Mount Joy Church (C), Saint Pauls Church (D), New Providence Church (E). Display/hide their locations on the map
Streams, rivers, and creeks: Pisgah Branch (A), Bear Branch (B), Goose Creek (C), Sugartree Branch (D), Spy Run (E), Saint Marys River (F), Poor Creek (G), Otts Creek (H), Moores Creek (I). Display/hide their locations on the map
In group quarters: 5 (-1 institutionalized population)
Size of family households: 252 2-persons, 188 3-persons, 126 4-persons, 19 6-persons
Size of nonfamily households: 226 1-person, 33 2-persons
48 married couples with children.
81 single-parent households (81 men).
99.8% of residents of 24472 zip code speak English at home.
0.5% of residents speak other Indo-European language at home (100% very well).
Foreign born population: 11 (0.6%) (100.0% of them are naturalized citizens)
This zip code:
0.6%
Whole state:
12.7%
64%North Macedonia (Macedonia)
26%German
22%American
17%English
10%Scotch-Irish
4%Scottish
4%Irish
2%Eastern European
Year of entry for the foreign-born population
02010 or later
02000 to 2009
01990 to 1999
26Before 1990
Facilities with environmental interests located in this zip code:
COASTAL MART INCORPORATED #866 (2468 RAPHINE ROAD in RAPHINE, VA)
Conditionally Exempt Small Quantity Generators, less than 100 kg/month of hazardous waste (Resource Conservation and Recovery Act (tracking hazardous waste)) - notification Organizations: OPERNAME (CONTACT/OPERATOR)
, L M HUGHEY CO (CONTACT/OWNER)
Housing units lacking complete kitchen facilities: 6.9%
59.8%Electricity
15.7%Bottled, tank, or LP gas
13.7%Wood
7.2%Fuel oil, kerosene, etc.
2.6%Utility gas
1.3%Other fuel
Population in 1990: 2,238.
Place of birth for U.S.-born residents:
This state: 1,235
Northeast: 402
Midwest: 70
South: 301
West: 37
65% of the 24472 zip code residents lived in the same house 5 years ago. Out of people who lived in different houses, 54% lived in this county. Out of people who lived in different counties, 50% lived in Virginia.
90% of the 24472 zip code residents lived in the same house 1 year ago. Out of people who lived in different houses, 18% moved from this county. Out of people who lived in different houses, 42% moved from different county within same state. Out of people who lived in different houses, 44% moved from different state.
Private vs. public school enrollment:
Students in private schools in grades 1 to 8 (elementary and middle school):
Here:
0.0%
Virginia:
13.2%
Students in private schools in grades 9 to 12 (high school): 26
Here:
20.2%
Virginia:
10.2%
Students in private undergraduate colleges: 94
Here:
88.2%
Virginia:
18.7%
Occupation by median earnings in the past 12 months ($)
103,861Health diagnosing and treating practitioners and other technical occupations
32,985Office and administrative support occupations
21,711Management occupations
17,534Food preparation and serving related occupations
Top industries in this zip code by the number of employees in 2005:
Accommodation and Food Services: Limited-Service Restaurants (20-49 employees: 2 establishments)
Health Care and Social Assistance: Homes for the Elderly (20-49: 1)
Accommodation and Food Services: Full-Service Restaurants (20-49: 1)
Accommodation and Food Services: Hotels (except Casino Hotels) and Motels (10-19: 1)
Wholesale Trade: Farm and Garden Machinery and Equipment Merchant Wholesalers (5-9: 1)
People in group quarters in 2010:
23 people in workers' group living quarters and job corps centers
Fatal accident statistics in 2013:
Fatal accident count: 1
Vehicles involved in fatal accidents: 1
Fatal accidents caused by drunken drivers: 1
Fatalities: 1
Persons involved in fatal accidents: 1
Pedestrians involved in fatal accidents: 0
Fatal accident statistics in 2012:
Fatal accident count: 1
Vehicles involved in fatal accidents: 1
Fatal accidents caused by drunken drivers: 0
Fatalities: 1
Persons involved in fatal accidents: 2
Pedestrians involved in fatal accidents: 0
2002 - 2018 National Fire Incident Reporting System (NFIRS) incidents
Based on the data from the years 2002 - 2018 the average number of fires per year is 39. The highest number of reported fires - 70 took place in 2010, and the least - 10 in 2016. The data has an increasing trend.
When looking into fire subcategories, the most incidents belonged to: Structure Fires (41.6%), and Outside Fires (32.0%).
Fire incident types reported to NFIRS in Zip Code 24472


 Nearest zip codes: 24476, 24440, 24415, 24459, 24435, 24483.


 Based on the data from the years 2002 - 2018 the average number of fires per year is 39. The highest number of reported fires - 70 took place in 2010, and the least - 10 in 2016. The data has an increasing trend.
 When looking into fire subcategories, the most incidents belonged to: Structure Fires (41.6%), and Outside Fires (32.0%).