Estimated zip code population in 2022: 6,184 Zip code population in 2010: 6,774 Zip code population in 2000: 6,102
Houses and condos: 3,029 Renter-occupied apartments: 903
% of renters here:
37%
State:
33%
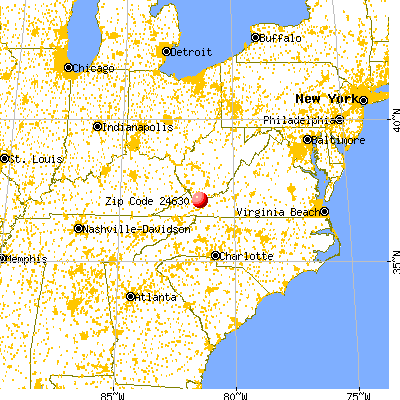
March 2022 cost of living index in zip code 24630: 82.9 (low, U.S. average is 100)
Land area: 65.6 sq. mi. Water area: 0.1 sq. mi.
Population density: 94 people per square mile
(very low).
OSM Map
General Map
Google Map
MSN Map
OSM Map
General Map
Google Map
MSN Map
OSM Map
General Map
Google Map
MSN Map
OSM Map
General Map
Google Map
MSN Map
Please wait while loading the map...
Real estate property taxes paid for housing units in 2022:
This zip code:
0.6% ($730)
Virginia:
0.7% ($2,617)
Median real estate property taxes paid for housing units with mortgages in 2022: $830 (0.7%) Median real estate property taxes paid for housing units with no mortgage in 2022: $608 (0.5%)
Business Search- 14 Million verified businesses
Males: 3,103
(50.2%)
Females: 3,081
(49.8%)
For population 25 years and over in 24630:
High school or higher: 89.5%
Bachelor's degree or higher: 11.1%
Graduate or professional degree: 2.7%
Unemployed: 5.7%
Mean travel time to work (commute): 24.6 minutes
For population 15 years and over in 24630:
Never married: 23.9%
Now married: 52.4%
Separated: 4.4%
Widowed: 5.3%
Divorced: 13.9%
Zip code 24630 compared to state average:
Median household income below state average.
Median house value significantly below state average.
Black race population percentage below state average.
Hispanic race population percentage significantly below state average.
Foreign-born population percentage significantly below state average.
Length of stay since moving in significantly above state average.
Number of college students below state average.
Percentage of population with a bachelor's degree or higher significantly below state average.
Averages for the 2020 tax year for zip code 24630, filed in 2021:
Average Adjusted Gross Income (AGI) in 2020: $46,145 (Individual Income Tax Returns)
Here:
$46,145
State:
$86,446
Salary/wage: $40,760 (reported on 83.1% of returns)
Here:
$40,760
State:
$71,185
(% of AGI for various income ranges: 1131.8% for AGIs below $25k, 3159.1% for AGIs $25k-50k, 6257.1% for AGIs $50k-75k, 9764.0% for AGIs $75k-100k, 14837.9% for AGIs $100k-200k)
Taxable interest for individuals: $1,084 (reported on 22.9% of returns)
This zip code:
$1,084
Virginia:
$1,805
(% of AGI for various income ranges: 14.9% for AGIs below $25k, 19.5% for AGIs $25k-50k, 46.8% for AGIs $50k-75k, 64.0% for AGIs $75k-100k, 115.7% for AGIs $100k-200k)
Ordinary dividends: $2,581 (reported on 8.4% of returns)
Here:
$2,581
State:
$8,327
(% of AGI for various income ranges: 13.8% for AGIs below $25k, 12.6% for AGIs $25k-50k, 41.4% for AGIs $50k-75k, 20.0% for AGIs $75k-100k, 153.6% for AGIs $100k-200k)
Net capital gain/loss in AGI: +$4,278 (reported on 7.2% of returns)
Here:
+$4,278
State:
+$24,644
(% of AGI for various income ranges: 1.2% for AGIs below $25k, 22.6% for AGIs $25k-50k, 67.9% for AGIs $50k-75k, 314.3% for AGIs $100k-200k)
Profit/loss from business: +$7,462 (reported on 10.4% of returns)
Here:
+$7,462
State:
+$12,836
(% of AGI for various income ranges: 71.3% for AGIs below $25k, 95.9% for AGIs $25k-50k, 87.5% for AGIs $50k-75k, 119.3% for AGIs $75k-100k, 288.6% for AGIs $100k-200k)
Taxable individual retirement arrangement distribution: $13,621 (reported on 7.6% of returns)
24630:
$13,621
Virginia:
$21,535
(% of AGI for various income ranges: 35.1% for AGIs below $25k, 96.9% for AGIs $25k-50k, 124.3% for AGIs $50k-75k, 197.3% for AGIs $75k-100k, 791.4% for AGIs $100k-200k)
Total itemized deductions: $31,767 (reported on 1.2% of returns)
Here:
$31,767
State:
$33,287
(% of AGI for various income ranges: 680.7% for AGIs $100k-200k)
Charity contributions: $10,667 (reported on 1.2% of returns)
Here:
$10,667
State:
$10,381
(% of AGI for various income ranges: 228.6% for AGIs $100k-200k)
Taxes paid: $8,600 (reported on 1.2% of returns)
24630:
$8,600
State:
$8,284
(% of AGI for various income ranges: 184.3% for AGIs $100k-200k)
Earned income credit: $2,441 (reported on 21.7% of returns)
Here:
$2,441
State:
$2,214
(% of AGI for various income ranges: 113.7% for AGIs below $25k, 74.3% for AGIs $25k-50k)
Percentage of individuals using paid preparers for their 2020 taxes: 93.2%
Here:
93%
State:
92%
(% for various income ranges: 94.8% for AGIs below $25k, 92.6% for AGIs $25k-50k, 94.6% for AGIs $50k-75k, 90.9% for AGIs $75k-100k, 86.4% for AGIs $100k-200k, 100.0% for AGIs over 200k)
Averages for the 2012 tax year for zip code 24630, filed in 2013:
Average Adjusted Gross Income (AGI) in 2012: $42,488 (Individual Income Tax Returns)
Here:
$42,488
State:
$71,192
Salary/wage: $37,799 (reported on 86.6% of returns)
Here:
$37,799
State:
$59,229
(% of AGI for various income ranges: 78.0% for AGIs below $25k, 81.4% for AGIs $25k-50k, 80.1% for AGIs $50k-75k, 80.6% for AGIs $75k-100k, 80.5% for AGIs $100k-200k, 48.0% for AGIs over 200k)
Taxable interest for individuals: $927 (reported on 24.5% of returns)
This zip code:
$927
Virginia:
$1,600
(% of AGI for various income ranges: 0.9% for AGIs below $25k, 0.5% for AGIs $25k-50k, 0.5% for AGIs $50k-75k, 0.4% for AGIs $75k-100k, 0.5% for AGIs $100k-200k, 0.5% for AGIs over 200k)
Ordinary dividends: $2,338 (reported on 10.8% of returns)
Here:
$2,338
State:
$6,959
(% of AGI for various income ranges: 0.5% for AGIs below $25k, 0.3% for AGIs $25k-50k, 0.5% for AGIs $50k-75k, 0.3% for AGIs $75k-100k, 1.8% for AGIs $100k-200k)
Net capital gain/loss in AGI: +$2,624 (reported on 6.3% of returns)
Here:
+$2,624
State:
+$16,672
(% of AGI for various income ranges: 0.3% for AGIs $50k-75k, 0.3% for AGIs $75k-100k, 1.5% for AGIs $100k-200k)
Profit/loss from business: +$7,447 (reported on 12.6% of returns)
Here:
+$7,447
State:
+$14,116
(% of AGI for various income ranges: 4.1% for AGIs below $25k, 2.7% for AGIs $25k-50k, 1.8% for AGIs $50k-75k, 1.1% for AGIs $75k-100k, 2.9% for AGIs $100k-200k)
Taxable individual retirement arrangement distribution: $12,932 (reported on 8.2% of returns)
24630:
$12,932
Virginia:
$16,667
(% of AGI for various income ranges: 3.2% for AGIs below $25k, 2.2% for AGIs $25k-50k, 2.7% for AGIs $50k-75k, 2.0% for AGIs $75k-100k, 3.9% for AGIs $100k-200k)
Total itemized deductions: $19,203 (19% of AGI, reported on 13.8% of returns)
Here:
$19,203
State:
$26,596
Here:
18.8% of AGI
State:
20.1% of AGI
(% of AGI for various income ranges: 2.9% for AGIs below $25k, 3.9% for AGIs $25k-50k, 5.1% for AGIs $50k-75k, 5.7% for AGIs $75k-100k, 10.3% for AGIs $100k-200k, 11.5% for AGIs over 200k)
Charity contributions: $5,225 (reported on 10.4% of returns)
Here:
$5,225
State:
$4,443
(% of AGI for various income ranges: 0.9% for AGIs $25k-50k, 0.7% for AGIs $50k-75k, 1.5% for AGIs $75k-100k, 2.1% for AGIs $100k-200k, 3.4% for AGIs over 200k)
Taxes paid: $6,346 (reported on 13.8% of returns)
24630:
$6,346
State:
$9,951
(% of AGI for various income ranges: 0.4% for AGIs below $25k, 0.7% for AGIs $25k-50k, 1.1% for AGIs $50k-75k, 1.7% for AGIs $75k-100k, 4.2% for AGIs $100k-200k, 5.7% for AGIs over 200k)
Earned income credit: $2,171 (reported on 25.3% of returns)
Here:
$2,171
State:
$2,211
(% of AGI for various income ranges: 7.5% for AGIs below $25k, 1.1% for AGIs $25k-50k)
Percentage of individuals using paid preparers for their 2012 taxes: 53.9%
Here:
54%
State:
46%
(% for various income ranges: 48.0% for AGIs below $25k, 54.4% for AGIs $25k-50k, 56.8% for AGIs $50k-75k, 68.2% for AGIs $75k-100k, 62.5% for AGIs $100k-200k, 100.0% for AGIs over 200k)
Averages for the 2004 tax year for zip code 24630, filed in 2005:
Average Adjusted Gross Income (AGI) in 2004: $34,101 (Individual Income Tax Returns)
Here:
$34,101
State:
$56,704
Salary/wage: $30,655 (reported on 88.0% of returns)
Here:
$30,655
State:
$48,441
(% of AGI for various income ranges: 90.5% for AGIs below $10k, 80.8% for AGIs $10k-25k, 87.2% for AGIs $25k-50k, 85.4% for AGIs $50k-75k, 79.4% for AGIs $75k-100k, 53.8% for AGIs over 100k)
Taxable interest for individuals: $1,206 (reported on 33.5% of returns)
This zip code:
$1,206
Virginia:
$1,688
(% of AGI for various income ranges: 2.9% for AGIs below $10k, 2.1% for AGIs $10k-25k, 1.2% for AGIs $25k-50k, 0.8% for AGIs $50k-75k, 1.0% for AGIs $75k-100k, 0.6% for AGIs over 100k)
Taxable dividends: $2,272 (reported on 12.7% of returns)
Here:
$2,272
State:
$4,028
(% of AGI for various income ranges: 0.9% for AGIs below $10k, 0.7% for AGIs $10k-25k, 0.5% for AGIs $25k-50k, 0.5% for AGIs $50k-75k, 1.1% for AGIs $75k-100k, 1.8% for AGIs over 100k)
Net capital gain/loss: +$4,354 (reported on 8.8% of returns)
Here:
+$4,354
State:
+$14,375
(% of AGI for various income ranges: 1.1% for AGIs below $10k, 0.7% for AGIs $10k-25k, 0.3% for AGIs $25k-50k, 0.9% for AGIs $50k-75k, 1.8% for AGIs $75k-100k, 2.6% for AGIs over 100k)
Profit/loss from business: +$7,027 (reported on 12.2% of returns)
Here:
+$7,027
State:
+$13,342
(% of AGI for various income ranges: 12.3% for AGIs below $10k, 3.4% for AGIs $10k-25k, 1.4% for AGIs $25k-50k, 1.4% for AGIs $50k-75k, 1.1% for AGIs $75k-100k, 4.5% for AGIs over 100k)
IRA payment deduction: $3,393 (reported on 2.1% of returns)
24630:
$3,393
Virginia:
$2,943
Total itemized deductions: $17,558 (20% of AGI, reported on 12.0% of returns)
Here:
$17,558
State:
$21,492
Here:
19.7% of AGI
State:
21.0% of AGI
(% of AGI for various income ranges: 2.4% for AGIs $10k-25k, 4.2% for AGIs $25k-50k, 5.2% for AGIs $50k-75k, 8.7% for AGIs $75k-100k, 13.0% for AGIs over 100k)
Charity contributions deductions: $4,504 (5% of AGI, reported on 9.0% of returns)
Here:
$4,504
State:
$3,794
Here:
4.7% of AGI
State:
3.5% of AGI
(% of AGI for various income ranges: 0.2% for AGIs $10k-25k, 0.8% for AGIs $25k-50k, 0.7% for AGIs $50k-75k, 1.6% for AGIs $75k-100k, 3.3% for AGIs over 100k)
Total tax: $4,399 (reported on 69.5% of returns)
24630:
$4,399
State:
$9,537
(% of AGI for various income ranges: 2.4% for AGIs below $10k, 3.5% for AGIs $10k-25k, 5.7% for AGIs $25k-50k, 8.6% for AGIs $50k-75k, 11.3% for AGIs $75k-100k, 19.2% for AGIs over 100k)
Earned income credit: $1,730 (reported on 23.9% of returns)
Here:
$1,730
State:
$1,734
Percentage of individuals using paid preparers for their 2004 taxes: 59.5%
Here:
59%
State:
52%
(% for various income ranges: 48.4% for AGIs below $10k, 61.1% for AGIs $10k-25k, 64.2% for AGIs $25k-50k, 60.5% for AGIs $50k-75k, 55.0% for AGIs $75k-100k, 79.7% for AGIs over 100k)
Likely homosexual households (counted as self-reported same-sex unmarried-partner households)
Lesbian couples: 0.3% of all households
Gay men: 0.0% of all households
Household received Food Stamps/SNAP in the past 12 months: 273 Household did not receive Food Stamps/SNAP in the past 12 months: 2,147
Women who had a birth in the past 12 months: 67 (42 now married, 24 unmarried) Women who did not have a birth in the past 12 months: 1,399 (711 now married, 683 unmarried)
Housing units in zip code 24630 with a mortgage: 747 (48 second mortgage, 47 both second mortgage and home equity loan) Houses without a mortgage: 25
Median monthly owner costs for units with a mortgage: $929 Median monthly owner costs for units without a mortgage: $365
Residents with income below the poverty level in 2022:
This zip code:
15.8%
Whole state:
10.6%
Residents with income below 50% of the poverty level in 2022:
This zip code:
9.4%
Whole state:
5.2%
Median number of rooms in houses and condos:
Here:
6.2
State:
7.0
Median number of rooms in apartments:
Here:
5.2
State:
4.3
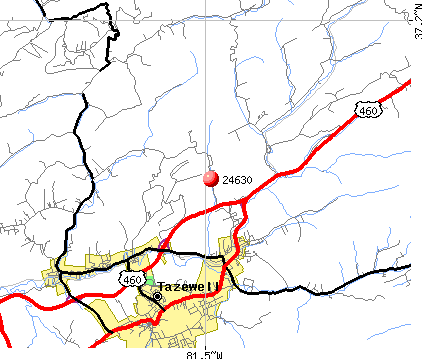
Notable locations in this zip code not listed on our city pages
Churches in zip code 24630 include: Brown Church (A), Mount Zion Church (B), Springville Church (C), Willows Chapel (D), Blacks Presbyterian Church (E), Dailey Chapel (F), Sheffys Chapel (G), Linkous Chapel (H), Litz Chapel (I). Display/hide their locations on the map
Cemeteries: Peery Cemetery (1), Sanders Cemetery (2), Sinkford Cemetery (3), Sluss Cemetery (4), Stevens Cemetery (5), Thompson Cemetery (6), Wagner Cemetery (7). Display/hide their locations on the map
Streams, rivers, and creeks: Whitley Branch (A), Mundy Branch (B), Johnson Branch (C), Teels Branch (D), South Fork Clinch River (E), Oneida Branch (F), North Fork Clinch River (G), Mudley Branch (H), Cavitts Creek (I). Display/hide their locations on the map
In group quarters: 2 (-1 institutionalized population)
Size of family households: 1,080 2-persons, 286 3-persons, 169 4-persons, 211 5-persons, 29 6-persons
Size of nonfamily households: 542 1-person, 91 2-persons
480 married couples with children.
312 single-parent households (2 men, 310 women).
99.2% of residents of 24630 zip code speak English at home.
0.2% of residents speak Spanish at home (100% very well).
0.1% of residents speak other Indo-European language at home (100% well).
Foreign born population: 65 (1.1%) (100.0% of them are naturalized citizens)
This zip code:
1.1%
Whole state:
12.7%
90%Malaysia
6%Sweden
6%United Kingdom, excluding England and Scotland
24%American
17%Irish
13%English
3%German
3%Italian
1%Scotch-Irish
1%Hungarian
Year of entry for the foreign-born population
102010 or later
552000 to 2009
141990 to 1999
37Before 1990
Facilities with environmental interests located in this zip code:
BLUE GRASS OIL BULK PLANT (RT. 16 in NORTH TAZEWELL, VA)
AIR MINOR (AIRS/AFS) STATE MASTER (Virginia pollutants databases) - CEDS-10321, AIR PROGRAM Business SIC and NAICS classification: PETROLEUM BULK STATIONS AND TERMINALS
ANGLES HOLLOW WATERWORKS (RT NUMBER 2 BOX 277 in NORTH TAZEWELL, VA)
(Integrated Compliance Information System) - ICIS-03-1989-1593, FORMAL ENFORCEMENT ACTION
BISHOP WATER TREATMENT PLANT (PO BOX 190 in NORTH TAZEWELL, VA)
National Pollutant Discharge Elimination System NON-MAJOR (Tracking pollutant discharge elimination systems) - permit Business SIC classification: WATER SUPPLY Alternative names: BISHOP WATER TREAMTNET PLANT, BISHOP WTP
Housing units lacking complete plumbing facilities: 12.4% Housing units lacking complete kitchen facilities: 5.3%
80.1%Electricity
11.0%Bottled, tank, or LP gas
3.7%Wood
3.2%No fuel used
1.9%Fuel oil, kerosene, etc.
Population in 1990: 6,771.
Place of birth for U.S.-born residents:
This state: 3,081
Northeast: 303
Midwest: 207
South: 2,368
West: 84
67% of the 24630 zip code residents lived in the same house 5 years ago. Out of people who lived in different houses, 66% lived in this county. Out of people who lived in different counties, 50% lived in Virginia.
90% of the 24630 zip code residents lived in the same house 1 year ago. Out of people who lived in different houses, 73% moved from this county. Out of people who lived in different houses, 18% moved from different county within same state. Out of people who lived in different houses, 3% moved from different state.
Private vs. public school enrollment:
Students in private schools in grades 1 to 8 (elementary and middle school): 1
Here:
0.2%
Virginia:
13.2%
Students in private schools in grades 9 to 12 (high school): 40
Here:
18.7%
Virginia:
10.2%
Students in private undergraduate colleges: 25
Here:
23.4%
Virginia:
18.7%
Occupation by median earnings in the past 12 months ($)
155,204Health diagnosing and treating practitioners and other technical occupations
132,730Law enforcement workers including supervisors
93,900Production occupations
60,646Education, training, and library occupations
58,295Transportation occupations
55,735Management occupations
Top industries in this zip code by the number of employees in 2005:
Health Care and Social Assistance: Other Individual and Family Services (100-249 employees: 1 establishment)
Accommodation and Food Services: Limited-Service Restaurants (50-99: 1, 10-19: 2)
Construction: Site Preparation Contractors (20-49: 1, 10-19: 2, 1-4: 1)
Other Services (except Public Administration): Commercial and Industrial Machinery and Equipment (except Automotive and Electronic) Repair and Maintenance (10-19: 2, 1-4: 3)
People in group quarters in 2010:
2 people in residential treatment centers for juveniles (non-correctional)
Fatal accident statistics in 2014:
Fatal accident count: 1
Vehicles involved in fatal accidents: 1
Fatal accidents caused by drunken drivers: 0
Fatalities: 1
Persons involved in fatal accidents: 1
Pedestrians involved in fatal accidents: 0
Fatal accident statistics in 2013:
Fatal accident count: 2
Vehicles involved in fatal accidents: 3
Fatal accidents caused by drunken drivers: 1
Fatalities: 2
Persons involved in fatal accidents: 8
Pedestrians involved in fatal accidents: 0
2002 - 2017 National Fire Incident Reporting System (NFIRS) incidents
Based on the data from the years 2002 - 2017 the average number of fire incidents per year is 13. The highest number of fires - 27 took place in 2007, and the least - 3 in 2017. The data has a dropping trend.
When looking into fire subcategories, the most incidents belonged to: Structure Fires (60.4%), and Outside Fires (21.7%).
Fire incident types reported to NFIRS in Zip Code 24630


 Nearest zip codes: 24604, 24651, 24605, 24848, 24606, 24866.


 Based on the data from the years 2002 - 2017 the average number of fire incidents per year is 13. The highest number of fires - 27 took place in 2007, and the least - 3 in 2017. The data has a dropping trend.
 When looking into fire subcategories, the most incidents belonged to: Structure Fires (60.4%), and Outside Fires (21.7%).