Estimated zip code population in 2022: 3,640 Zip code population in 2010: 3,410 Zip code population in 2000: 2,657
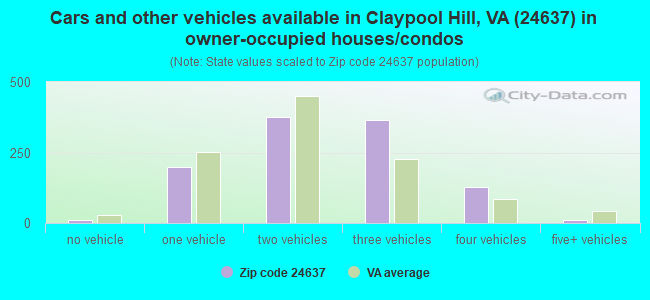
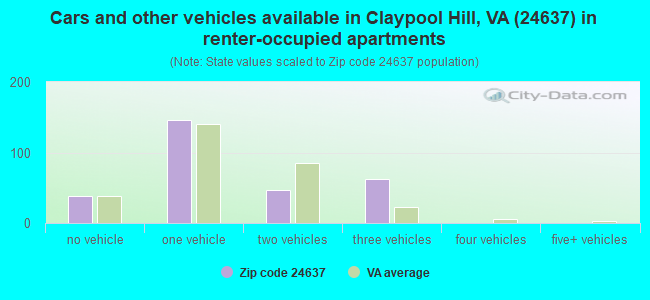
Houses and condos: 1,439 Renter-occupied apartments: 295
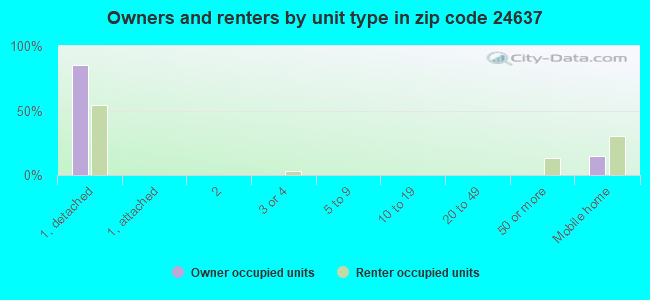
% of renters here:
21%
State:
33%
March 2022 cost of living index in zip code 24637: 82.4 (low, U.S. average is 100)
Land area: 28.5 sq. mi. Water area: 0.2 sq. mi.
Population density: 128 people per square mile
(very low).
OSM Map
General Map
Google Map
MSN Map
OSM Map
General Map
Google Map
MSN Map
OSM Map
General Map
Google Map
MSN Map
OSM Map
General Map
Google Map
MSN Map
Please wait while loading the map...
Real estate property taxes paid for housing units in 2022:
This zip code:
0.5% ($750)
Virginia:
0.7% ($2,617)
Median real estate property taxes paid for housing units with mortgages in 2022: $930 (0.6%) Median real estate property taxes paid for housing units with no mortgage in 2022: $740 (0.6%)
Business Search- 14 Million verified businesses
Males: 1,987
(54.6%)
Females: 1,653
(45.4%)
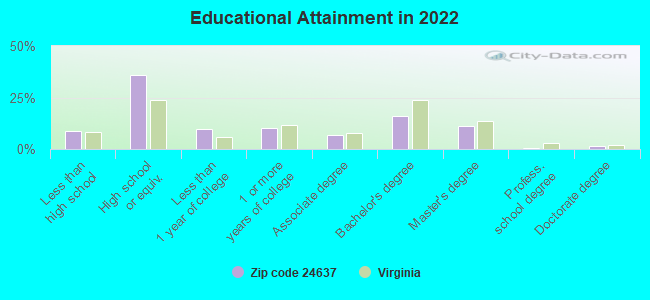
For population 25 years and over in 24637:
High school or higher: 90.7%
Bachelor's degree or higher: 28.9%
Graduate or professional degree: 13.0%
Unemployed: 4.3%
Mean travel time to work (commute): 24.3 minutes
For population 15 years and over in 24637:
Never married: 29.7%
Now married: 50.8%
Separated: 2.7%
Widowed: 5.3%
Divorced: 11.6%
Zip code 24637 compared to state average:
Median household income below state average.
Median house value significantly below state average.
Black race population percentage significantly below state average.
Hispanic race population percentage significantly below state average.
Median age above state average.
Foreign-born population percentage significantly below state average.
Renting percentage below state average.
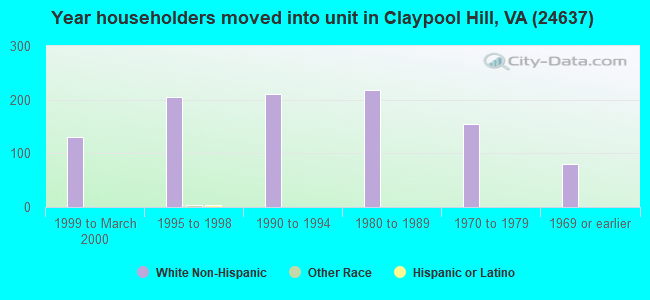
Length of stay since moving in significantly above state average.
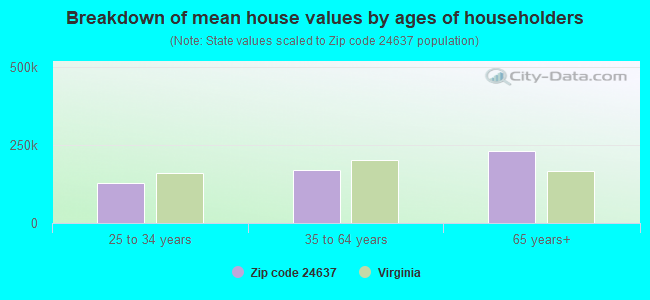
Estimated median house/condo value in 2022: $148,196
24637:
$148,196
Virginia:
$365,700
According to our research of Virginia and other state lists, there were 10 registered sex offenders living in 24637 zip code as of May 28, 2024. The ratio of all residents to sex offenders in zip code 24637 is 408 to 1. The ratio of registered sex offenders to all residents in this zip code is near the state average.
Median resident age:
This zip code:
44.9 years
Virginia median age:
39.0 years
Average household size:
This zip code:
2.6 people
Virginia:
2.5 people
Averages for the 2020 tax year for zip code 24637, filed in 2021:
Average Adjusted Gross Income (AGI) in 2020: $57,228 (Individual Income Tax Returns)
Here:
$57,228
State:
$86,446
Salary/wage: $50,006 (reported on 83.2% of returns)
Here:
$50,006
State:
$71,185
(% of AGI for various income ranges: 1167.5% for AGIs below $25k, 3479.3% for AGIs $25k-50k, 5997.8% for AGIs $50k-75k, 9042.5% for AGIs $75k-100k, 13417.7% for AGIs $100k-200k)
Taxable interest for individuals: $988 (reported on 28.7% of returns)
This zip code:
$988
Virginia:
$1,805
(% of AGI for various income ranges: 10.3% for AGIs below $25k, 9.3% for AGIs $25k-50k, 58.9% for AGIs $50k-75k, 63.3% for AGIs $75k-100k, 98.5% for AGIs $100k-200k)
Ordinary dividends: $2,853 (reported on 10.5% of returns)
Here:
$2,853
State:
$8,327
(% of AGI for various income ranges: 8.9% for AGIs below $25k, 9.3% for AGIs $25k-50k, 27.2% for AGIs $50k-75k, 104.2% for AGIs $75k-100k, 151.5% for AGIs $100k-200k)
Net capital gain/loss in AGI: +$9,514 (reported on 9.8% of returns)
Here:
+$9,514
State:
+$24,644
(% of AGI for various income ranges: 14.7% for AGIs below $25k, 86.1% for AGIs $50k-75k, 129.2% for AGIs $75k-100k, 745.4% for AGIs $100k-200k)
Profit/loss from business: +$6,105 (reported on 13.3% of returns)
Here:
+$6,105
State:
+$12,836
(% of AGI for various income ranges: 123.9% for AGIs below $25k, 69.3% for AGIs $25k-50k, 148.3% for AGIs $50k-75k, 176.7% for AGIs $75k-100k, 36.9% for AGIs $100k-200k)
Taxable individual retirement arrangement distribution: $15,415 (reported on 9.1% of returns)
24637:
$15,415
Virginia:
$21,535
(% of AGI for various income ranges: 115.3% for AGIs below $25k, 247.8% for AGIs $50k-75k, 426.7% for AGIs $75k-100k, 485.4% for AGIs $100k-200k)
Total itemized deductions: $31,775 (reported on 2.8% of returns)
Here:
$31,775
State:
$33,287
(% of AGI for various income ranges: 977.7% for AGIs $100k-200k)
Charity contributions: $14,000 (reported on 2.1% of returns)
Here:
$14,000
State:
$10,381
(% of AGI for various income ranges: 323.1% for AGIs $100k-200k)
Taxes paid: $7,375 (reported on 2.8% of returns)
24637:
$7,375
State:
$8,284
(% of AGI for various income ranges: 226.9% for AGIs $100k-200k)
Earned income credit: $2,156 (reported on 17.5% of returns)
Here:
$2,156
State:
$2,214
(% of AGI for various income ranges: 93.3% for AGIs below $25k, 75.2% for AGIs $25k-50k)
Percentage of individuals using paid preparers for their 2020 taxes: 94.4%
Here:
94%
State:
92%
(% for various income ranges: 93.9% for AGIs below $25k, 97.0% for AGIs $25k-50k, 95.7% for AGIs $50k-75k, 94.4% for AGIs $75k-100k, 88.2% for AGIs $100k-200k, 100.0% for AGIs over 200k)
Averages for the 2012 tax year for zip code 24637, filed in 2013:
Average Adjusted Gross Income (AGI) in 2012: $55,993 (Individual Income Tax Returns)
Here:
$55,993
State:
$71,192
Salary/wage: $49,372 (reported on 89.8% of returns)
Here:
$49,372
State:
$59,229
(% of AGI for various income ranges: 73.8% for AGIs below $25k, 82.4% for AGIs $25k-50k, 84.9% for AGIs $50k-75k, 85.6% for AGIs $75k-100k, 84.5% for AGIs $100k-200k, 53.3% for AGIs over 200k)
Taxable interest for individuals: $1,310 (reported on 32.7% of returns)
This zip code:
$1,310
Virginia:
$1,600
(% of AGI for various income ranges: 0.8% for AGIs below $25k, 0.8% for AGIs $25k-50k, 0.6% for AGIs $50k-75k, 0.6% for AGIs $75k-100k, 0.4% for AGIs $100k-200k, 1.7% for AGIs over 200k)
Ordinary dividends: $5,119 (reported on 10.9% of returns)
Here:
$5,119
State:
$6,959
(% of AGI for various income ranges: 0.2% for AGIs below $25k, 0.3% for AGIs $25k-50k, 0.5% for AGIs $50k-75k, 3.4% for AGIs $100k-200k)
Net capital gain/loss in AGI: +$11,475 (reported on 8.2% of returns)
Here:
+$11,475
State:
+$16,672
(% of AGI for various income ranges: 0.5% for AGIs $25k-50k, 0.9% for AGIs $50k-75k, 0.6% for AGIs $100k-200k, 8.7% for AGIs over 200k)
Profit/loss from business: +$4,952 (reported on 14.3% of returns)
Here:
+$4,952
State:
+$14,116
(% of AGI for various income ranges: 6.9% for AGIs below $25k, 1.7% for AGIs $25k-50k, 0.8% for AGIs $50k-75k, 0.4% for AGIs $75k-100k, 1.1% for AGIs $100k-200k)
Taxable individual retirement arrangement distribution: $12,664 (reported on 7.5% of returns)
24637:
$12,664
Virginia:
$16,667
(% of AGI for various income ranges: 2.6% for AGIs below $25k, 2.5% for AGIs $25k-50k, 3.6% for AGIs $50k-75k, 1.6% for AGIs $100k-200k)
Total itemized deductions: $20,626 (17% of AGI, reported on 21.1% of returns)
Here:
$20,626
State:
$26,596
Here:
17.4% of AGI
State:
20.1% of AGI
(% of AGI for various income ranges: 6.4% for AGIs $25k-50k, 6.5% for AGIs $50k-75k, 7.7% for AGIs $75k-100k, 10.5% for AGIs $100k-200k, 10.2% for AGIs over 200k)
Charity contributions: $5,064 (reported on 15.0% of returns)
Here:
$5,064
State:
$4,443
(% of AGI for various income ranges: 1.1% for AGIs $25k-50k, 1.3% for AGIs $50k-75k, 1.3% for AGIs $75k-100k, 1.7% for AGIs $100k-200k, 1.8% for AGIs over 200k)
Taxes paid: $7,381 (reported on 21.1% of returns)
24637:
$7,381
State:
$9,951
(% of AGI for various income ranges: 1.1% for AGIs $25k-50k, 1.5% for AGIs $50k-75k, 2.2% for AGIs $75k-100k, 4.3% for AGIs $100k-200k, 5.9% for AGIs over 200k)
Earned income credit: $2,260 (reported on 17.0% of returns)
Here:
$2,260
State:
$2,211
(% of AGI for various income ranges: 6.6% for AGIs below $25k, 1.2% for AGIs $25k-50k)
Percentage of individuals using paid preparers for their 2012 taxes: 59.9%
Here:
60%
State:
46%
(% for various income ranges: 52.0% for AGIs below $25k, 58.3% for AGIs $25k-50k, 56.0% for AGIs $50k-75k, 70.6% for AGIs $75k-100k, 75.0% for AGIs $100k-200k, 100.0% for AGIs over 200k)
Averages for the 2004 tax year for zip code 24637, filed in 2005:
Average Adjusted Gross Income (AGI) in 2004: $38,327 (Individual Income Tax Returns)
Here:
$38,327
State:
$56,704
Salary/wage: $36,056 (reported on 87.5% of returns)
Here:
$36,056
State:
$48,441
(% of AGI for various income ranges: 94.8% for AGIs below $10k, 82.2% for AGIs $10k-25k, 89.4% for AGIs $25k-50k, 85.4% for AGIs $50k-75k, 84.9% for AGIs $75k-100k, 67.3% for AGIs over 100k)
Taxable interest for individuals: $998 (reported on 39.3% of returns)
This zip code:
$998
Virginia:
$1,688
(% of AGI for various income ranges: 5.7% for AGIs below $10k, 1.2% for AGIs $10k-25k, 0.7% for AGIs $25k-50k, 0.6% for AGIs $50k-75k, 1.6% for AGIs $75k-100k, 0.9% for AGIs over 100k)
Taxable dividends: $1,886 (reported on 14.2% of returns)
Here:
$1,886
State:
$4,028
(% of AGI for various income ranges: 3.2% for AGIs below $10k, 0.2% for AGIs $10k-25k, 0.1% for AGIs $25k-50k, 0.2% for AGIs $50k-75k, 0.6% for AGIs $75k-100k, 2.0% for AGIs over 100k)
Net capital gain/loss: +$1,636 (reported on 10.8% of returns)
Here:
+$1,636
State:
+$14,375
(% of AGI for various income ranges: -1.3% for AGIs below $10k, 0.3% for AGIs $10k-25k, -0.1% for AGIs $25k-50k, -0.0% for AGIs $50k-75k, 1.0% for AGIs $75k-100k, 1.5% for AGIs over 100k)
Profit/loss from business: +$5,639 (reported on 14.2% of returns)
Here:
+$5,639
State:
+$13,342
(% of AGI for various income ranges: 9.9% for AGIs below $10k, 5.9% for AGIs $10k-25k, 1.2% for AGIs $25k-50k, 4.2% for AGIs $50k-75k, -0.4% for AGIs over 100k)
IRA payment deduction: $3,278 (reported on 2.8% of returns)
24637:
$3,278
Virginia:
$2,943
Total itemized deductions: $15,781 (20% of AGI, reported on 18.0% of returns)
Here:
$15,781
State:
$21,492
Here:
19.7% of AGI
State:
21.0% of AGI
(% of AGI for various income ranges: 5.7% for AGIs $10k-25k, 5.3% for AGIs $25k-50k, 6.4% for AGIs $50k-75k, 10.8% for AGIs $75k-100k, 9.9% for AGIs over 100k)
Charity contributions deductions: $3,791 (4% of AGI, reported on 14.8% of returns)
Here:
$3,791
State:
$3,794
Here:
4.5% of AGI
State:
3.5% of AGI
(% of AGI for various income ranges: 0.4% for AGIs $10k-25k, 0.9% for AGIs $25k-50k, 1.7% for AGIs $50k-75k, 2.0% for AGIs $75k-100k, 2.1% for AGIs over 100k)
Total tax: $4,926 (reported on 74.5% of returns)
24637:
$4,926
State:
$9,537
(% of AGI for various income ranges: 3.4% for AGIs below $10k, 3.9% for AGIs $10k-25k, 6.1% for AGIs $25k-50k, 8.8% for AGIs $50k-75k, 10.3% for AGIs $75k-100k, 17.8% for AGIs over 100k)
Earned income credit: $1,685 (reported on 19.2% of returns)
Here:
$1,685
State:
$1,734
Percentage of individuals using paid preparers for their 2004 taxes: 64.0%
Here:
64%
State:
52%
(% for various income ranges: 56.8% for AGIs below $10k, 59.1% for AGIs $10k-25k, 67.6% for AGIs $25k-50k, 65.9% for AGIs $50k-75k, 76.5% for AGIs $75k-100k, 75.8% for AGIs over 100k)
Household received Food Stamps/SNAP in the past 12 months: 131 Household did not receive Food Stamps/SNAP in the past 12 months: 1,253
Women who had a birth in the past 12 months: 11 (11 now married, 0 unmarried) Women who did not have a birth in the past 12 months: 654 (310 now married, 342 unmarried)
Housing units in zip code 24637 with a mortgage: 323 (18 second mortgage, 8 both second mortgage and home equity loan) Median monthly owner costs for units with a mortgage: $1,055 Median monthly owner costs for units without a mortgage: $402
Residents with income below the poverty level in 2022:
This zip code:
17.6%
Whole state:
10.6%
Residents with income below 50% of the poverty level in 2022:
This zip code:
2.0%
Whole state:
5.2%
Median number of rooms in houses and condos:
Here:
6.2
State:
7.0
Median number of rooms in apartments:
Here:
4.7
State:
4.3
Notable locations in this zip code not listed on our city pages
Size of family households: 499 2-persons, 259 3-persons, 234 4-persons, 19 5-persons
Size of nonfamily households: 315 1-person, 49 2-persons
282 married couples with children.
328 single-parent households (24 men, 304 women).
96.7% of residents of 24637 zip code speak English at home.
0.7% of residents speak other Indo-European language at home (100% well).
2.8% of residents speak Asian or Pacific Island language at home (100% very well).
Foreign born population: 115 (3.2%) (19.3% of them are naturalized citizens)
This zip code:
3.2%
Whole state:
12.7%
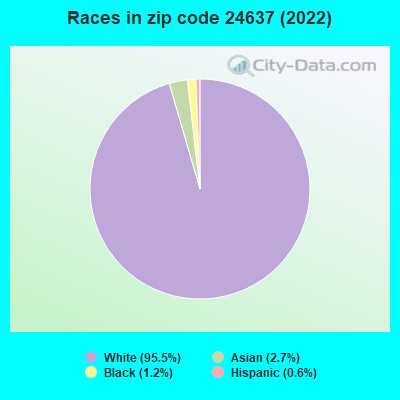
8%Romania
8%Serbia
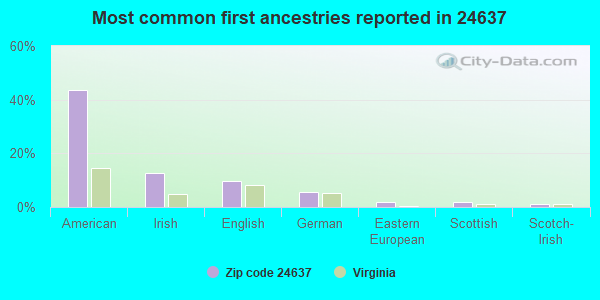
44%American
13%Irish
10%English
6%German
2%Eastern European
2%Scottish
1%Scotch-Irish
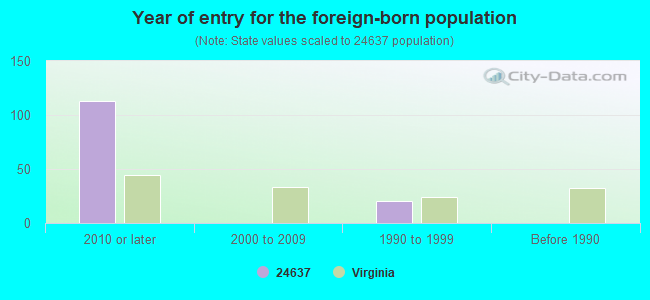
Year of entry for the foreign-born population
1132010 or later
02000 to 2009
201990 to 1999
0Before 1990
Facilities with environmental interests located in this zip code:
AIR MINOR (AIRS/AFS) STATE MASTER (Virginia pollutants databases) - CEDS-10870, AIR PROGRAM Business SIC classification: CEMENT, HYDRAULIC Business NAICS classification: CEMENT MANUFACTURING. Alternative names: BOXLEY CONCRETE PRODUCTS INC, BOXLEY CONCRETE PRODUCTS INC, BOXLEY MATERIALS CO-POUNDING MILL READY
APPALACHIAN MINE SUPPLIES INC (RTE 637 in POUNDING MILL, VA)
Conditionally Exempt Small Quantity Generators, less than 100 kg/month of hazardous waste (Resource Conservation and Recovery Act (tracking hazardous waste)) - notification Organizations: OPERNAME (CONTACT/OPERATOR)
, LUTHER M JOHNSON (CONTACT/OWNER)
Housing units lacking complete kitchen facilities: 0.6%
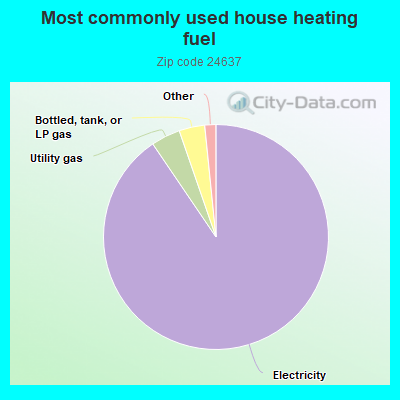
90.6%Electricity
4.2%Utility gas
3.7%Bottled, tank, or LP gas
0.9%No fuel used
0.7%Fuel oil, kerosene, etc.
Population in 1990: 3,942.
Place of birth for U.S.-born residents:
This state: 2,937
Midwest: 50
South: 489
West: 14
69% of the 24637 zip code residents lived in the same house 5 years ago. Out of people who lived in different houses, 66% lived in this county. Out of people who lived in different counties, 50% lived in Virginia.
97% of the 24637 zip code residents lived in the same house 1 year ago. Out of people who lived in different houses, 101% moved from this county.
Private vs. public school enrollment:
Students in private schools in grades 1 to 8 (elementary and middle school): 28
Here:
7.7%
Virginia:
13.2%
Students in private schools in grades 9 to 12 (high school):
Here:
0.0%
Virginia:
10.2%
Students in private undergraduate colleges:
Here:
0.0%
Virginia:
18.7%
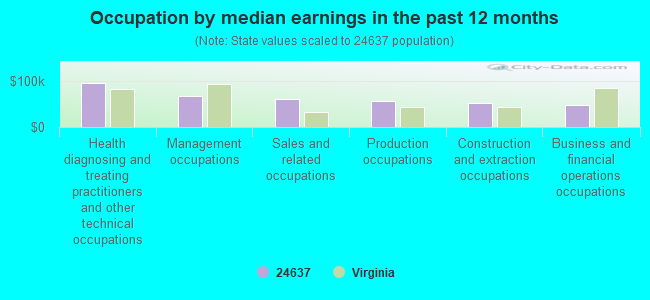
Occupation by median earnings in the past 12 months ($)
95,812Health diagnosing and treating practitioners and other technical occupations
66,645Management occupations
61,674Sales and related occupations
56,657Production occupations
52,701Construction and extraction occupations
47,910Business and financial operations occupations
Top industries in this zip code by the number of employees in 2005:
Wholesale Trade: Metal Service Centers and Other Metal Merchant Wholesalers (50-99 employees: 1 establishment, 20-49 employees: 2 establishments)
Accommodation and Food Services: Limited-Service Restaurants (20-49: 1)
Mining: Crushed and Broken Limestone Mining and Quarrying (20-49: 1)
Wholesale Trade: Petroleum Bulk Stations and Terminals (20-49: 1)
Real Estate and Rental and Leasing: General Rental Centers (20-49: 1)
Accommodation and Food Services: Full-Service Restaurants (20-49: 1)
People in group quarters in 2010:
49 people in group homes intended for adults
Fatal accident statistics in 2013:
Fatal accident count: 1
Vehicles involved in fatal accidents: 1
Fatal accidents caused by drunken drivers: 0
Fatalities: 1
Persons involved in fatal accidents: 1
Pedestrians involved in fatal accidents: 1
Fatal accident statistics in 2011:
Fatal accident count: 1
Vehicles involved in fatal accidents: 1
Fatal accidents caused by drunken drivers: 0
Fatalities: 1
Persons involved in fatal accidents: 1
Pedestrians involved in fatal accidents: 0
2002 - 2017 National Fire Incident Reporting System (NFIRS) incidents
According to the data from the years 2002 - 2017 the average number of fire incidents per year is 9. The highest number of reported fires - 15 took place in 2005, and the least - 3 in 2013. The data has a dropping trend.
When looking into fire subcategories, the most incidents belonged to: Outside Fires (40.7%), and Structure Fires (37.9%).
Fire incident types reported to NFIRS in Zip Code 24637

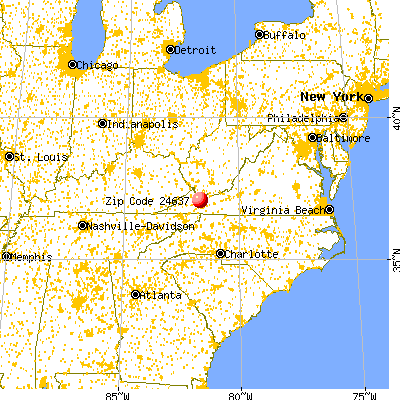


 Nearest zip codes: 24641, 24609, 24316, 24612, 24602, 24601.


 According to the data from the years 2002 - 2017 the average number of fire incidents per year is 9. The highest number of reported fires - 15 took place in 2005, and the least - 3 in 2013. The data has a dropping trend.
 When looking into fire subcategories, the most incidents belonged to: Outside Fires (40.7%), and Structure Fires (37.9%).