Estimated zip code population in 2022: 3,813 Zip code population in 2010: 3,533 Zip code population in 2000: 3,376
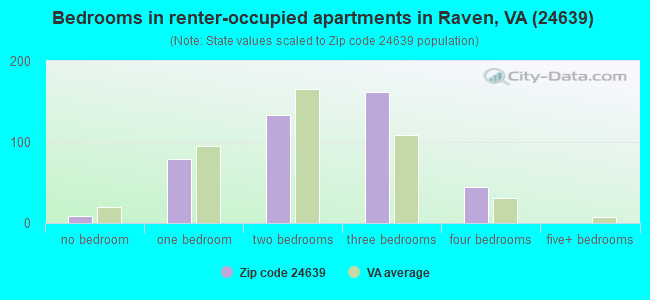
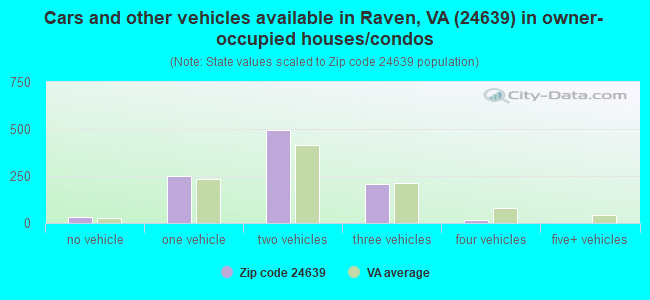
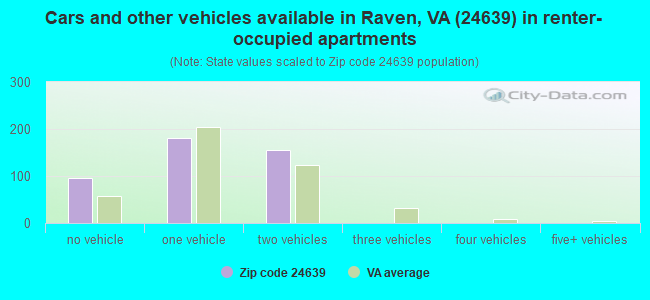
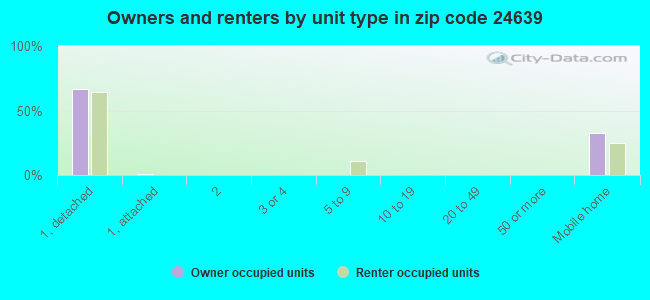
Houses and condos: 1,755 Renter-occupied apartments: 429
% of renters here:
30%
State:
33%
March 2022 cost of living index in zip code 24639: 83.1 (low, U.S. average is 100)
Land area: 42.1 sq. mi. Water area: 0.0 sq. mi.
Population density: 91 people per square mile
(very low).
OSM Map
General Map
Google Map
MSN Map
OSM Map
General Map
Google Map
MSN Map
OSM Map
General Map
Google Map
MSN Map
OSM Map
General Map
Google Map
MSN Map
Please wait while loading the map...
Real estate property taxes paid for housing units in 2022:
This zip code:
0.5% ($519)
Virginia:
0.7% ($2,617)
Median real estate property taxes paid for housing units with mortgages in 2022: $855 (0.4%) Median real estate property taxes paid for housing units with no mortgage in 2022: $468 (0.5%)
Business Search- 14 Million verified businesses
Males: 1,632
(42.8%)
Females: 2,181
(57.2%)
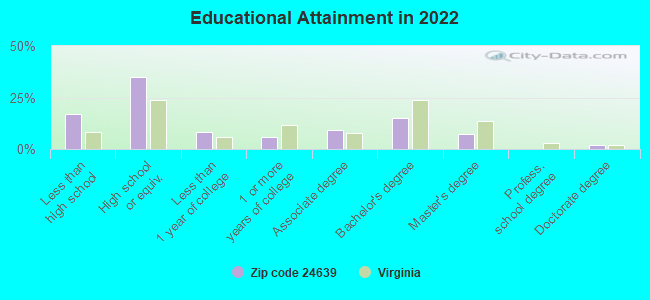
For population 25 years and over in 24639:
High school or higher: 81.4%
Bachelor's degree or higher: 24.1%
Graduate or professional degree: 9.4%
Unemployed: 5.5%
Mean travel time to work (commute): 24.8 minutes
For population 15 years and over in 24639:
Never married: 28.5%
Now married: 44.2%
Separated: 1.4%
Widowed: 14.7%
Divorced: 11.2%
Zip code 24639 compared to state average:
Median household income below state average.
Median house value significantly below state average.
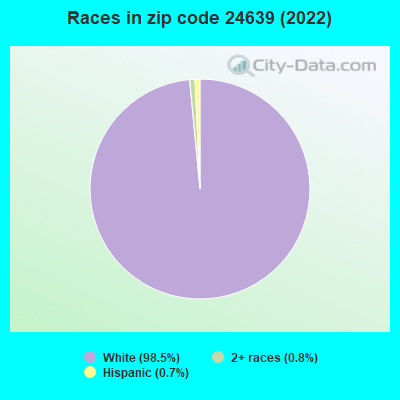
Black race population percentage significantly below state average.
Hispanic race population percentage significantly below state average.
Median age above state average.
Foreign-born population percentage significantly below state average.
Length of stay since moving in significantly above state average.
Percentage of population with a bachelor's degree or higher below state average.
Averages for the 2020 tax year for zip code 24639, filed in 2021:
Average Adjusted Gross Income (AGI) in 2020: $38,214 (Individual Income Tax Returns)
Here:
$38,214
State:
$86,446
Salary/wage: $35,687 (reported on 83.2% of returns)
Here:
$35,687
State:
$71,185
(% of AGI for various income ranges: 993.3% for AGIs below $25k, 3267.7% for AGIs $25k-50k, 6098.2% for AGIs $50k-75k, 8643.3% for AGIs $75k-100k, 14994.0% for AGIs $100k-200k)
Taxable interest for individuals: $442 (reported on 17.8% of returns)
This zip code:
$442
Virginia:
$1,805
(% of AGI for various income ranges: 4.4% for AGIs below $25k, 10.8% for AGIs $25k-50k, 8.2% for AGIs $50k-75k, 36.7% for AGIs $75k-100k, 16.0% for AGIs $100k-200k)
Ordinary dividends: $760 (reported on 4.7% of returns)
Here:
$760
State:
$8,327
(% of AGI for various income ranges: 5.9% for AGIs below $25k, 13.6% for AGIs $50k-75k)
Net capital gain/loss in AGI: +$1,333 (reported on 2.8% of returns)
Here:
+$1,333
State:
+$24,644
(% of AGI for various income ranges: 15.4% for AGIs $25k-50k)
Profit/loss from business: +$6,845 (reported on 10.3% of returns)
Here:
+$6,845
State:
+$12,836
(% of AGI for various income ranges: 94.9% for AGIs below $25k, 78.8% for AGIs $25k-50k, 296.7% for AGIs $75k-100k)
Taxable individual retirement arrangement distribution: $12,100 (reported on 4.7% of returns)
24639:
$12,100
Virginia:
$21,535
(% of AGI for various income ranges: 37.9% for AGIs below $25k, 175.8% for AGIs $25k-50k)
Earned income credit: $2,264 (reported on 26.2% of returns)
Here:
$2,264
State:
$2,214
(% of AGI for various income ranges: 101.0% for AGIs below $25k, 92.3% for AGIs $25k-50k)
Percentage of individuals using paid preparers for their 2020 taxes: 94.4%
Here:
94%
State:
92%
(% for various income ranges: 93.9% for AGIs below $25k, 93.3% for AGIs $25k-50k, 92.9% for AGIs $50k-75k, 100.0% for AGIs $75k-100k, 100.0% for AGIs $100k-200k)
Averages for the 2012 tax year for zip code 24639, filed in 2013:
Average Adjusted Gross Income (AGI) in 2012: $37,161 (Individual Income Tax Returns)
Here:
$37,161
State:
$71,192
Salary/wage: $35,114 (reported on 89.8% of returns)
Here:
$35,114
State:
$59,229
(% of AGI for various income ranges: 80.3% for AGIs below $25k, 83.0% for AGIs $25k-50k, 82.7% for AGIs $50k-75k, 86.6% for AGIs $75k-100k, 93.4% for AGIs $100k-200k)
Taxable interest for individuals: $617 (reported on 21.3% of returns)
This zip code:
$617
Virginia:
$1,600
(% of AGI for various income ranges: 0.7% for AGIs below $25k, 0.5% for AGIs $25k-50k, 0.4% for AGIs $50k-75k, 0.2% for AGIs $75k-100k)
Ordinary dividends: $875 (reported on 7.4% of returns)
Here:
$875
State:
$6,959
Profit/loss from business: +$6,782 (reported on 10.2% of returns)
Here:
+$6,782
State:
+$14,116
(% of AGI for various income ranges: 5.2% for AGIs below $25k, 2.2% for AGIs $25k-50k, 2.1% for AGIs $50k-75k)
Taxable individual retirement arrangement distribution: $11,400 (reported on 5.6% of returns)
24639:
$11,400
Virginia:
$16,667
Total itemized deductions: $17,080 (23% of AGI, reported on 9.3% of returns)
Here:
$17,080
State:
$26,596
Here:
23.1% of AGI
State:
20.1% of AGI
(% of AGI for various income ranges: 4.9% for AGIs $25k-50k, 3.6% for AGIs $50k-75k, 5.2% for AGIs $75k-100k, 7.2% for AGIs $100k-200k)
Charity contributions: $5,429 (reported on 6.5% of returns)
Here:
$5,429
State:
$4,443
Taxes paid: $4,340 (reported on 9.3% of returns)
24639:
$4,340
State:
$9,951
(% of AGI for various income ranges: 0.6% for AGIs $25k-50k, 0.9% for AGIs $50k-75k, 1.4% for AGIs $75k-100k, 2.8% for AGIs $100k-200k)
Earned income credit: $2,239 (reported on 28.7% of returns)
Here:
$2,239
State:
$2,211
(% of AGI for various income ranges: 9.0% for AGIs below $25k, 1.5% for AGIs $25k-50k)
Percentage of individuals using paid preparers for their 2012 taxes: 61.1%
Here:
61%
State:
46%
(% for various income ranges: 57.1% for AGIs below $25k, 62.1% for AGIs $25k-50k, 68.8% for AGIs $50k-75k, 66.7% for AGIs $75k-100k, 60.0% for AGIs $100k-200k)
Averages for the 2004 tax year for zip code 24639, filed in 2005:
Average Adjusted Gross Income (AGI) in 2004: $27,279 (Individual Income Tax Returns)
Here:
$27,279
State:
$56,704
Salary/wage: $26,632 (reported on 88.9% of returns)
Here:
$26,632
State:
$48,441
(% of AGI for various income ranges: 98.5% for AGIs below $10k, 84.0% for AGIs $10k-25k, 87.2% for AGIs $25k-50k, 92.0% for AGIs $50k-75k, 115.7% for AGIs $75k-100k)
Taxable interest for individuals: $1,029 (reported on 27.8% of returns)
This zip code:
$1,029
Virginia:
$1,688
(% of AGI for various income ranges: 3.3% for AGIs below $10k, 1.7% for AGIs $10k-25k, 1.2% for AGIs $25k-50k, 0.6% for AGIs $50k-75k, 0.1% for AGIs $75k-100k)
Taxable dividends: $1,034 (reported on 7.7% of returns)
Here:
$1,034
State:
$4,028
(% of AGI for various income ranges: 0.2% for AGIs below $10k, 0.8% for AGIs $10k-25k, 0.3% for AGIs $25k-50k, 0.1% for AGIs $50k-75k)
Profit/loss from business: +$4,842 (reported on 10.1% of returns)
Here:
+$4,842
State:
+$13,342
(% of AGI for various income ranges: 10.9% for AGIs below $10k, 3.3% for AGIs $10k-25k, 2.4% for AGIs $25k-50k, -0.3% for AGIs $50k-75k)
IRA payment deduction: $2,667 (reported on 1.1% of returns)
24639:
$2,667
Virginia:
$2,943
Total itemized deductions: $13,785 (24% of AGI, reported on 7.0% of returns)
Here:
$13,785
State:
$21,492
Here:
23.6% of AGI
State:
21.0% of AGI
(% of AGI for various income ranges: 1.8% for AGIs $10k-25k, 3.7% for AGIs $25k-50k, 3.4% for AGIs $50k-75k, 10.0% for AGIs $75k-100k)
Charity contributions deductions: $3,517 (6% of AGI, reported on 5.2% of returns)
Here:
$3,517
State:
$3,794
Here:
6.3% of AGI
State:
3.5% of AGI
(% of AGI for various income ranges: 1.9% for AGIs below $10k, 0.4% for AGIs $25k-50k, 0.8% for AGIs $50k-75k, 2.5% for AGIs $75k-100k)
Total tax: $3,063 (reported on 62.2% of returns)
24639:
$3,063
State:
$9,537
(% of AGI for various income ranges: 2.7% for AGIs below $10k, 3.0% for AGIs $10k-25k, 5.7% for AGIs $25k-50k, 8.9% for AGIs $50k-75k, 11.2% for AGIs $75k-100k, 15.9% for AGIs over 100k)
Earned income credit: $1,603 (reported on 30.7% of returns)
Here:
$1,603
State:
$1,734
Percentage of individuals using paid preparers for their 2004 taxes: 64.9%
Here:
65%
State:
52%
(% for various income ranges: 57.4% for AGIs below $10k, 67.4% for AGIs $10k-25k, 66.8% for AGIs $25k-50k, 68.1% for AGIs $50k-75k, 88.9% for AGIs $75k-100k)
Household received Food Stamps/SNAP in the past 12 months: 283 Household did not receive Food Stamps/SNAP in the past 12 months: 1,170
Women who had a birth in the past 12 months: 69 (24 now married, 42 unmarried) Women who did not have a birth in the past 12 months: 933 (318 now married, 618 unmarried)
Housing units in zip code 24639 with a mortgage: 329 (17 second mortgage, 8 both second mortgage and home equity loan) Median monthly owner costs for units with a mortgage: $1,513 Median monthly owner costs for units without a mortgage: $367
Residents with income below the poverty level in 2022:
This zip code:
24.5%
Whole state:
10.6%
Residents with income below 50% of the poverty level in 2022:
This zip code:
11.2%
Whole state:
5.2%
Median number of rooms in houses and condos:
Here:
5.8
State:
7.0
Median number of rooms in apartments:
Here:
4.9
State:
4.3
Notable locations in this zip code not listed on our city pages
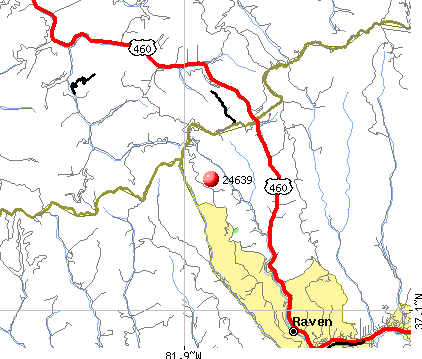
Churches in zip code 24639 include: Antioch Church (A), Road Ridge Church (B), Cole Chapel (C), Macedonia Church (D). Display/hide their locations on the map
Streams, rivers, and creeks: Whetstone Branch (A), Zeke Creek (B), Shacks Branch (C), Sevenmile Branch (D), Ratliff Branch (E), Pistol Branch (F), Mill Creek (G), Mann Branch (H), Jamison Creek (I). Display/hide their locations on the map
In group quarters: 5 (-1 institutionalized population)
Size of family households: 458 2-persons, 276 3-persons, 170 4-persons, 105 5-persons, 16 6-persons, 5 7-or-more-persons
Size of nonfamily households: 315 1-person, 75 2-persons
487 married couples with children.
208 single-parent households (37 men, 171 women).
99.6% of residents of 24639 zip code speak English at home.
0.2% of residents speak Spanish at home (100% well).
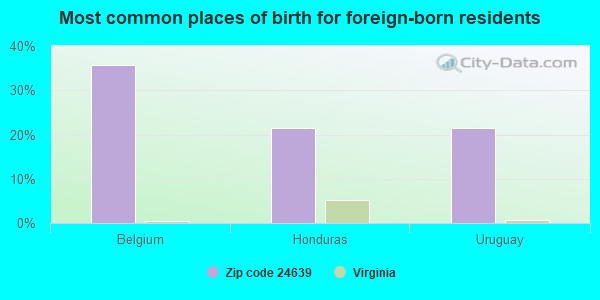
Foreign born population: 14 (0.4%) (80.4% of them are naturalized citizens)
This zip code:
0.4%
Whole state:
12.7%
36%Belgium
21%Honduras
21%Uruguay
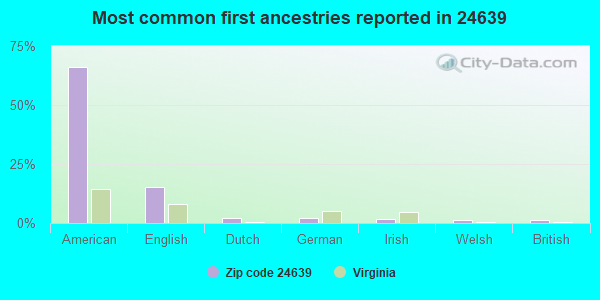
66%American
15%English
2%Dutch
2%German
2%Irish
1%Welsh
1%British
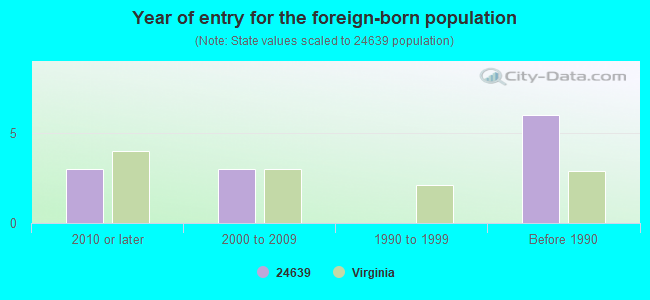
Year of entry for the foreign-born population
32010 or later
32000 to 2009
01990 to 1999
6Before 1990
Facilities with environmental interests located in this zip code:
E DILLON & COMPANY/PLANT 2 (RTE 633 in RAVEN, VA)
AIR SYNTHETIC MINOR (AIRS/AFS) STATE MASTER (Virginia pollutants databases) - CEDS-10903, AIR PROGRAM Business SIC and NAICS classification: CRUSHED AND BROKEN LIMESTONE
Housing units lacking complete plumbing facilities: 7.2% Housing units lacking complete kitchen facilities: 5.4%
83.7%Electricity
5.6%Utility gas
5.2%Bottled, tank, or LP gas
2.9%Wood
2.6%Fuel oil, kerosene, etc.
Population in 1990: 3,441.
Place of birth for U.S.-born residents:
This state: 2,949
Northeast: 40
Midwest: 11
South: 664
West: 111
73% of the 24639 zip code residents lived in the same house 5 years ago. Out of people who lived in different houses, 61% lived in this county. Out of people who lived in different counties, 50% lived in Virginia.
93% of the 24639 zip code residents lived in the same house 1 year ago. Out of people who lived in different houses, 65% moved from this county. Out of people who lived in different houses, 13% moved from different county within same state. Out of people who lived in different houses, 19% moved from different state.
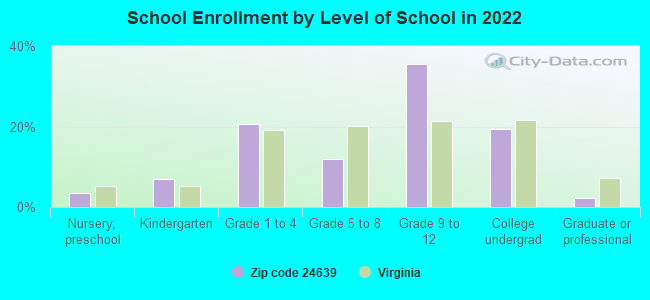
Private vs. public school enrollment:
Students in private schools in grades 1 to 8 (elementary and middle school): 5
Here:
2.3%
Virginia:
13.2%
Students in private schools in grades 9 to 12 (high school):
Here:
0.0%
Virginia:
10.2%
Students in private undergraduate colleges: 24
Here:
16.5%
Virginia:
18.7%
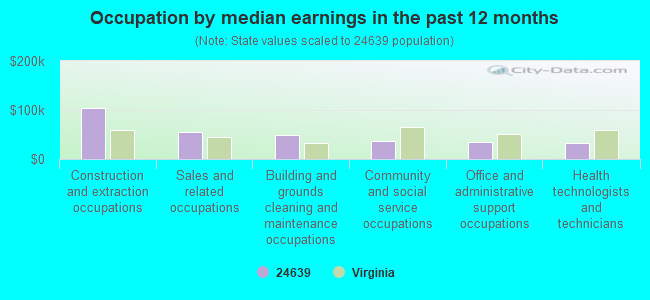
Occupation by median earnings in the past 12 months ($)
104,229Construction and extraction occupations
56,039Sales and related occupations
48,355Building and grounds cleaning and maintenance occupations
37,663Community and social service occupations
34,050Office and administrative support occupations
32,966Health technologists and technicians
Top industries in this zip code by the number of employees in 2005:
Educational Services: Elementary and Secondary Schools (20-49 employees: 1 establishment)
Mining: Support Activities for Coal Mining (20-49: 1)
Management of Companies and Enterprises: Corporate, Subsidiary, and Regional Managing Offices (10-19: 1)
Other Services (except Public Administration): Coin-Operated Laundries and Drycleaners (10-19: 1)
Other Services (except Public Administration): General Automotive Repair (1-4: 2)
People in group quarters in 2010:
6 people in group homes intended for adults
Fatal accident statistics in 2013:
Fatal accident count: 1
Vehicles involved in fatal accidents: 5
Fatal accidents caused by drunken drivers: 0
Fatalities: 1
Persons involved in fatal accidents: 2
Pedestrians involved in fatal accidents: 0
Fatal accident statistics in 2012:
Fatal accident count: 1
Vehicles involved in fatal accidents: 1
Fatal accidents caused by drunken drivers: 0
Fatalities: 1
Persons involved in fatal accidents: 1
Pedestrians involved in fatal accidents: 0
2002 - 2018 National Fire Incident Reporting System (NFIRS) incidents
According to the data from the years 2002 - 2018 the average number of fire incidents per year is 10. The highest number of reported fires - 18 took place in 2016, and the least - 2 in 2005. The data has a growing trend.
When looking into fire subcategories, the most incidents belonged to: Structure Fires (53.7%), and Outside Fires (32.7%).
Fire incident types reported to NFIRS in Zip Code 24639

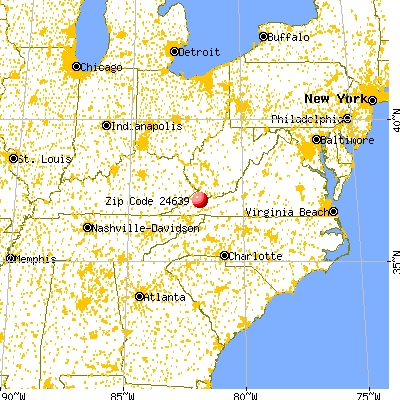


 Nearest zip codes: 24657, 24612, 24649, 24641, 24622, 24634.


 According to the data from the years 2002 - 2018 the average number of fire incidents per year is 10. The highest number of reported fires - 18 took place in 2016, and the least - 2 in 2005. The data has a growing trend.
 When looking into fire subcategories, the most incidents belonged to: Structure Fires (53.7%), and Outside Fires (32.7%).