Estimated median house/condo value in 2022: $39,679
25107:
$39,679
West Virginia:
$155,100
Median resident age:
This zip code:
62.4 years
West Virginia median age:
42.9 years
Average household size:
This zip code:
1.8 people
West Virginia:
2.3 people
Averages for the 2020 tax year for zip code 25107, filed in 2021:
Average Adjusted Gross Income (AGI) in 2020: $39,859 (Individual Income Tax Returns)
Here:
$39,859
State:
$56,292
Salary/wage: $36,750 (reported on 81.8% of returns)
Here:
$36,750
State:
$49,093
(% of AGI for various income ranges: 951.4% for AGIs below $25k, 3152.0% for AGIs $25k-50k, 7200.0% for AGIs $50k-75k, 9776.7% for AGIs $75k-100k)
Taxable interest for individuals: $267 (reported on 13.6% of returns)
This zip code:
$267
West Virginia:
$1,141
(% of AGI for various income ranges: 16.0% for AGIs $25k-50k)
Earned income credit: $2,050 (reported on 18.2% of returns)
Here:
$2,050
State:
$2,258
(% of AGI for various income ranges: 52.9% for AGIs below $25k, 90.0% for AGIs $25k-50k)
Percentage of individuals using paid preparers for their 2020 taxes: 90.9%
Here:
91%
State:
93%
(% for various income ranges: 88.9% for AGIs below $25k, 100.0% for AGIs $25k-50k, 100.0% for AGIs $50k-75k, 75.0% for AGIs $75k-100k)
Averages for the 2012 tax year for zip code 25107, filed in 2013:
Average Adjusted Gross Income (AGI) in 2012: $39,150 (Individual Income Tax Returns)
Here:
$39,150
State:
$48,628
Salary/wage: $36,762 (reported on 87.5% of returns)
Here:
$36,762
State:
$42,328
(% of AGI for various income ranges: 71.1% for AGIs below $25k, 85.2% for AGIs $25k-50k, 88.0% for AGIs $50k-75k, 81.2% for AGIs $75k-100k)
Taxable interest for individuals: $375 (reported on 16.7% of returns)
This zip code:
$375
West Virginia:
$1,211
Earned income credit: $1,920 (reported on 20.8% of returns)
Here:
$1,920
State:
$2,140
(% of AGI for various income ranges: 7.0% for AGIs below $25k)
Percentage of individuals using paid preparers for their 2012 taxes: 37.5%
Here:
38%
State:
49%
(% for various income ranges: 30.0% for AGIs below $25k, 66.7% for AGIs $25k-50k, 50.0% for AGIs $75k-100k)
Averages for the 2004 tax year for zip code 25107, filed in 2005:
Average Adjusted Gross Income (AGI) in 2004: $30,531 (Individual Income Tax Returns)
Here:
$30,531
State:
$37,498
Salary/wage: $30,287 (reported on 88.1% of returns)
Here:
$30,287
State:
$33,645
(% of AGI for various income ranges: 94.8% for AGIs below $10k, 78.1% for AGIs $10k-25k, 88.1% for AGIs $25k-50k, 90.6% for AGIs $50k-75k, 88.8% for AGIs $75k-100k)
Taxable interest for individuals: $620 (reported on 25.6% of returns)
This zip code:
$620
West Virginia:
$1,465
(% of AGI for various income ranges: 1.9% for AGIs below $10k, 1.9% for AGIs $10k-25k, 0.3% for AGIs $25k-50k, 0.0% for AGIs $50k-75k)
Profit/loss from business: +$2,176 (reported on 6.1% of returns)
Here:
+$2,176
State:
+$11,074
Total itemized deductions: $12,240 (19% of AGI, reported on 9.0% of returns)
Here:
$12,240
State:
$16,976
Here:
18.7% of AGI
State:
19.0% of AGI
Charity contributions deductions: $2,722 (5% of AGI, reported on 6.5% of returns)
Here:
$2,722
State:
$3,529
Here:
4.8% of AGI
State:
3.7% of AGI
Total tax: $3,287 (reported on 65.3% of returns)
25107:
$3,287
State:
$5,372
(% of AGI for various income ranges: 0.7% for AGIs below $10k, 2.4% for AGIs $10k-25k, 5.9% for AGIs $25k-50k, 9.2% for AGIs $50k-75k, 11.4% for AGIs $75k-100k)
Earned income credit: $1,688 (reported on 23.1% of returns)
Here:
$1,688
State:
$1,662
Percentage of individuals using paid preparers for their 2004 taxes: 49.1%
Here:
49%
State:
55%
(% for various income ranges: 46.6% for AGIs below $10k, 44.8% for AGIs $10k-25k, 52.0% for AGIs $25k-50k, 51.2% for AGIs $50k-75k, 62.5% for AGIs $75k-100k)
Household received Food Stamps/SNAP in the past 12 months: 23 Household did not receive Food Stamps/SNAP in the past 12 months: 176
Women who did not have a birth in the past 12 months: 59 (34 now married, 24 unmarried)
Housing units in zip code 25107 with a mortgage: 24 (9 second mortgage, 9 both second mortgage and home equity loan) Residents with income below the poverty level in 2022:
This zip code:
8.3%
Whole state:
17.9%
Residents with income below 50% of the poverty level in 2022:
This zip code:
8.3%
Whole state:
9.7%
Median number of rooms in houses and condos:
Here:
5.8
State:
6.5
Notable locations in this zip code not listed on our city pages
Notable locations in zip code 25107: Bee Mountain Lookout Tower (A), Log Town Hollow Picnic Area (B), Davis Creek Camping Area (C), Davis Creek Picnic Area (D). Display/hide their locations on the map
Streams, rivers, and creeks: Spruce Fork (A), Sixmile Branch (B), Rattlesnake Run (C), Portercamp Branch (D), Middlelick Branch (E), Mary Fork (F), Left Fork Lens Creek (G), Fourmile Fork (H), Ferneys Branch (I). Display/hide their locations on the map
Size of family households: 25 2-persons, 44 3-persons, 12 4-persons
Size of nonfamily households: 111 1-person, 8 2-persons
44 married couples with children.
13 single-parent households (13 men).
100.8% of residents of 25107 zip code speak English at home.
Foreign born population: 0 (0.0%)
:
0.0%
Whole state:
1.8%
69%English
Facilities with environmental interests located in this zip code:
EPLINS SERVICE CENTER (RT 94 SOUTH 3MI OUT OF MARMET in HERNSHAW, WV)
(Resource Conservation and Recovery Act (tracking hazardous waste)) Organizations: HOWARD EPLIN (CONTACT/OWNER)
Housing units lacking complete plumbing facilities: 16.7%
72.5%Utility gas
28.3%Electricity
Population in 1990: 745. Population change in the 1990s: +26 (+3.5%).
Place of birth for U.S.-born residents:
This state: 324
Midwest: 35
88% of the 25107 zip code residents lived in the same house 5 years ago. Out of people who lived in different houses, 64% lived in this county. Out of people who lived in different counties, 50% lived in West Virginia.
100% of the 25107 zip code residents lived in the same house 1 year ago.
Private vs. public school enrollment:
Students in private schools in grades 1 to 8 (elementary and middle school):
Here:
0.0%
West Virginia:
12.2%
Top industries in this zip code by the number of employees in 2005:
Wholesale Trade: Motor Vehicle Supplies and New Parts Merchant Wholesalers (10-19: 1, 1-4: 1)
Other Services (except Public Administration): Religious Organizations (1-4: 1)
Accommodation and Food Services: Drinking Places (Alcoholic Beverages) (1-4: 1)
Other Services (except Public Administration): Commercial and Industrial Machinery and Equipment (except Automotive and Electronic) Repair and Maintenance (1-4: 1)
Mining: Support Activities for Coal Mining (1-4: 1)
Fatal accident statistics in 2011:
Fatal accident count: 1
Vehicles involved in fatal accidents: 3
Fatal accidents caused by drunken drivers: 0
Fatalities: 1
Persons involved in fatal accidents: 5
Pedestrians involved in fatal accidents: 0
Home Mortgage Disclosure Act Aggregated Statistics For Year 2009 (Based on 4 partial tracts)
A) FHA, FSA/RHS & VA Home Purchase Loans
B) Conventional Home Purchase Loans
C) Refinancings
D) Home Improvement Loans
F) Non-occupant Loans on < 5 Family Dwellings (A B C & D)
G) Loans On Manufactured Home Dwelling (A B C & D)
Number
Average Value
Number
Average Value
Number
Average Value
Number
Average Value
Number
Average Value
Number
Average Value
LOANS ORIGINATED
6
$104,275
12
$201,293
21
$153,912
7
$45,534
1
$74,680
2
$47,425
APPLICATIONS APPROVED, NOT ACCEPTED
0
$0
3
$86,257
5
$89,616
0
$0
1
$15,070
1
$81,360
APPLICATIONS DENIED
1
$153,470
7
$94,309
17
$99,404
9
$32,891
2
$49,060
7
$41,236
APPLICATIONS WITHDRAWN
1
$202,450
2
$144,390
6
$119,615
1
$8,790
0
$0
0
$0
FILES CLOSED FOR INCOMPLETENESS
1
$46,540
1
$35,820
2
$172,945
1
$39,190
0
$0
1
$63,700
Aggregated Statistics For Year 2008 (Based on 4 partial tracts)
A) FHA, FSA/RHS & VA Home Purchase Loans
B) Conventional Home Purchase Loans
C) Refinancings
D) Home Improvement Loans
F) Non-occupant Loans on < 5 Family Dwellings (A B C & D)
G) Loans On Manufactured Home Dwelling (A B C & D)
Number
Average Value
Number
Average Value
Number
Average Value
Number
Average Value
Number
Average Value
Number
Average Value
LOANS ORIGINATED
3
$91,673
15
$176,467
21
$120,973
6
$40,510
3
$75,853
2
$50,525
APPLICATIONS APPROVED, NOT ACCEPTED
1
$123,090
3
$148,340
2
$53,590
3
$34,017
1
$55,000
2
$28,550
APPLICATIONS DENIED
2
$119,375
8
$97,210
23
$87,917
8
$35,948
2
$32,650
7
$58,523
APPLICATIONS WITHDRAWN
0
$0
3
$189,860
5
$82,678
0
$0
1
$43,860
0
$0
FILES CLOSED FOR INCOMPLETENESS
0
$0
0
$0
1
$145,950
0
$0
0
$0
0
$0
Aggregated Statistics For Year 2007 (Based on 4 partial tracts)
A) FHA, FSA/RHS & VA Home Purchase Loans
B) Conventional Home Purchase Loans
C) Refinancings
D) Home Improvement Loans
F) Non-occupant Loans on < 5 Family Dwellings (A B C & D)
G) Loans On Manufactured Home Dwelling (A B C & D)
Number
Average Value
Number
Average Value
Number
Average Value
Number
Average Value
Number
Average Value
Number
Average Value
LOANS ORIGINATED
3
$85,083
22
$111,634
24
$110,283
8
$37,915
6
$63,320
7
$48,960
APPLICATIONS APPROVED, NOT ACCEPTED
0
$0
4
$57,235
7
$65,121
3
$49,423
1
$24,360
2
$64,455
APPLICATIONS DENIED
1
$105,220
9
$62,389
25
$78,539
11
$25,358
3
$55,197
7
$64,631
APPLICATIONS WITHDRAWN
1
$40,180
2
$146,315
5
$89,174
0
$0
1
$43,870
1
$52,480
FILES CLOSED FOR INCOMPLETENESS
0
$0
1
$44,200
1
$140,320
0
$0
0
$0
0
$0
Aggregated Statistics For Year 2006 (Based on 4 partial tracts)
A) FHA, FSA/RHS & VA Home Purchase Loans
B) Conventional Home Purchase Loans
C) Refinancings
D) Home Improvement Loans
F) Non-occupant Loans on < 5 Family Dwellings (A B C & D)
G) Loans On Manufactured Home Dwelling (A B C & D)
Number
Average Value
Number
Average Value
Number
Average Value
Number
Average Value
Number
Average Value
Number
Average Value
LOANS ORIGINATED
1
$65,390
22
$105,978
30
$88,108
10
$32,106
7
$69,449
6
$48,777
APPLICATIONS APPROVED, NOT ACCEPTED
1
$39,020
6
$62,678
6
$52,295
3
$25,117
1
$79,790
6
$57,332
APPLICATIONS DENIED
0
$0
15
$83,315
20
$79,678
11
$45,828
3
$34,887
14
$50,087
APPLICATIONS WITHDRAWN
0
$0
4
$116,868
8
$90,626
1
$10,050
2
$92,900
1
$54,590
FILES CLOSED FOR INCOMPLETENESS
0
$0
2
$82,960
1
$117,470
1
$37,080
0
$0
0
$0
Aggregated Statistics For Year 2005 (Based on 4 partial tracts)
A) FHA, FSA/RHS & VA Home Purchase Loans
B) Conventional Home Purchase Loans
C) Refinancings
D) Home Improvement Loans
F) Non-occupant Loans on < 5 Family Dwellings (A B C & D)
G) Loans On Manufactured Home Dwelling (A B C & D)
Number
Average Value
Number
Average Value
Number
Average Value
Number
Average Value
Number
Average Value
Number
Average Value
LOANS ORIGINATED
1
$86,640
30
$129,743
33
$97,239
10
$18,542
4
$59,358
7
$39,357
APPLICATIONS APPROVED, NOT ACCEPTED
0
$0
11
$58,918
11
$56,253
3
$23,917
3
$47,827
9
$49,550
APPLICATIONS DENIED
2
$64,925
18
$54,129
29
$68,486
16
$24,527
3
$35,127
22
$47,734
APPLICATIONS WITHDRAWN
0
$0
3
$125,123
9
$84,580
1
$63,050
0
$0
0
$0
FILES CLOSED FOR INCOMPLETENESS
0
$0
1
$157,410
1
$102,890
0
$0
0
$0
0
$0
Aggregated Statistics For Year 2004 (Based on 4 partial tracts)
A) FHA, FSA/RHS & VA Home Purchase Loans
B) Conventional Home Purchase Loans
C) Refinancings
D) Home Improvement Loans
F) Non-occupant Loans on < 5 Family Dwellings (A B C & D)
G) Loans On Manufactured Home Dwelling (A B C & D)
Number
Average Value
Number
Average Value
Number
Average Value
Number
Average Value
Number
Average Value
Number
Average Value
LOANS ORIGINATED
3
$63,037
22
$125,749
33
$96,482
10
$31,882
2
$61,865
7
$43,794
APPLICATIONS APPROVED, NOT ACCEPTED
0
$0
6
$66,013
11
$51,890
2
$10,590
1
$13,650
4
$36,840
APPLICATIONS DENIED
1
$43,450
22
$48,048
32
$62,761
19
$23,404
3
$57,407
20
$41,840
APPLICATIONS WITHDRAWN
0
$0
5
$64,520
11
$89,268
2
$80,175
1
$46,540
3
$35,633
FILES CLOSED FOR INCOMPLETENESS
1
$59,030
1
$37,930
2
$142,920
0
$0
0
$0
1
$31,650
Aggregated Statistics For Year 2003 (Based on 4 partial tracts)
A) FHA, FSA/RHS & VA Home Purchase Loans
B) Conventional Home Purchase Loans
C) Refinancings
D) Home Improvement Loans
F) Non-occupant Loans on < 5 Family Dwellings (A B C & D)
Number
Average Value
Number
Average Value
Number
Average Value
Number
Average Value
Number
Average Value
LOANS ORIGINATED
1
$56,930
19
$103,620
60
$97,296
14
$14,424
6
$40,437
APPLICATIONS APPROVED, NOT ACCEPTED
0
$0
12
$75,708
14
$65,253
3
$10,240
2
$36,125
APPLICATIONS DENIED
0
$0
22
$46,020
36
$65,845
17
$12,483
3
$46,570
APPLICATIONS WITHDRAWN
0
$0
2
$96,450
17
$94,157
1
$32,230
1
$49,060
FILES CLOSED FOR INCOMPLETENESS
1
$53,410
2
$65,550
3
$69,140
1
$34,400
1
$39,180
Aggregated Statistics For Year 2002 (Based on 4 partial tracts)
A) FHA, FSA/RHS & VA Home Purchase Loans
B) Conventional Home Purchase Loans
C) Refinancings
D) Home Improvement Loans
F) Non-occupant Loans on < 5 Family Dwellings (A B C & D)
Number
Average Value
Number
Average Value
Number
Average Value
Number
Average Value
Number
Average Value
LOANS ORIGINATED
4
$56,425
22
$79,412
52
$106,325
12
$14,455
7
$54,019
APPLICATIONS APPROVED, NOT ACCEPTED
0
$0
7
$49,946
12
$64,721
3
$11,470
0
$0
APPLICATIONS DENIED
1
$67,470
21
$41,067
38
$66,383
13
$13,317
3
$43,007
APPLICATIONS WITHDRAWN
1
$38,760
3
$63,827
13
$74,896
1
$16,080
0
$0
FILES CLOSED FOR INCOMPLETENESS
0
$0
0
$0
2
$98,295
0
$0
0
$0
Aggregated Statistics For Year 2001 (Based on 4 partial tracts)
A) FHA, FSA/RHS & VA Home Purchase Loans
B) Conventional Home Purchase Loans
C) Refinancings
D) Home Improvement Loans
F) Non-occupant Loans on < 5 Family Dwellings (A B C & D)
Number
Average Value
Number
Average Value
Number
Average Value
Number
Average Value
Number
Average Value
LOANS ORIGINATED
3
$58,990
30
$64,308
43
$76,797
10
$7,434
8
$33,832
APPLICATIONS APPROVED, NOT ACCEPTED
0
$0
13
$54,965
12
$47,126
2
$11,635
2
$28,925
APPLICATIONS DENIED
1
$36,420
29
$40,856
29
$52,696
7
$10,550
2
$43,910
APPLICATIONS WITHDRAWN
1
$44,870
4
$41,332
21
$57,543
1
$23,190
1
$20,760
FILES CLOSED FOR INCOMPLETENESS
1
$39,440
1
$160,090
5
$58,454
0
$0
0
$0
Aggregated Statistics For Year 2000 (Based on 4 partial tracts)
A) FHA, FSA/RHS & VA Home Purchase Loans
B) Conventional Home Purchase Loans
C) Refinancings
D) Home Improvement Loans
F) Non-occupant Loans on < 5 Family Dwellings (A B C & D)
Number
Average Value
Number
Average Value
Number
Average Value
Number
Average Value
Number
Average Value
LOANS ORIGINATED
4
$54,942
28
$58,172
22
$54,442
14
$8,037
5
$34,980
APPLICATIONS APPROVED, NOT ACCEPTED
3
$41,023
10
$39,230
11
$43,419
3
$9,207
0
$0
APPLICATIONS DENIED
2
$25,275
50
$33,561
35
$54,205
9
$13,310
3
$33,347
APPLICATIONS WITHDRAWN
1
$23,610
4
$76,488
16
$57,501
1
$36,490
0
$0
FILES CLOSED FOR INCOMPLETENESS
1
$27,130
1
$8,700
1
$47,220
0
$0
0
$0
Aggregated Statistics For Year 1999 (Based on 2 partial tracts)
A) FHA, FSA/RHS & VA Home Purchase Loans
B) Conventional Home Purchase Loans
C) Refinancings
D) Home Improvement Loans
F) Non-occupant Loans on < 5 Family Dwellings (A B C & D)
Detailed PMIC statistics for the following Tracts:0122.00
, 0123.00
2003 - 2018 National Fire Incident Reporting System (NFIRS) incidents
Based on the data from the years 2003 - 2018 the average number of fire incidents per year is 7. The highest number of fire incidents - 19 took place in 2009, and the least - 2 in 2007. The data has a growing trend.
When looking into fire subcategories, the most reports belonged to: Structure Fires (49.5%), and Outside Fires (27.0%).
Fire incident types reported to NFIRS in Zip Code 25107

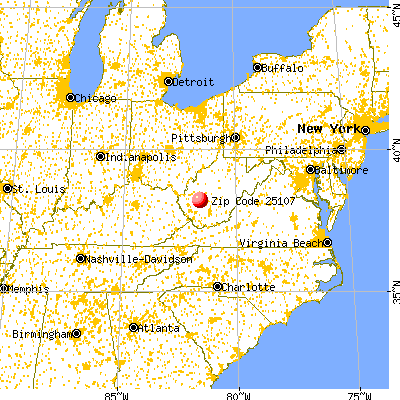


 Nearest zip codes: 25315, 25009, 25024, 25314, 25304, 25165.


 Based on the data from the years 2003 - 2018 the average number of fire incidents per year is 7. The highest number of fire incidents - 19 took place in 2009, and the least - 2 in 2007. The data has a growing trend.
 When looking into fire subcategories, the most reports belonged to: Structure Fires (49.5%), and Outside Fires (27.0%).