Estimated zip code population in 2022: 1,445 Zip code population in 2010: 1,561 Zip code population in 2000: 1,483
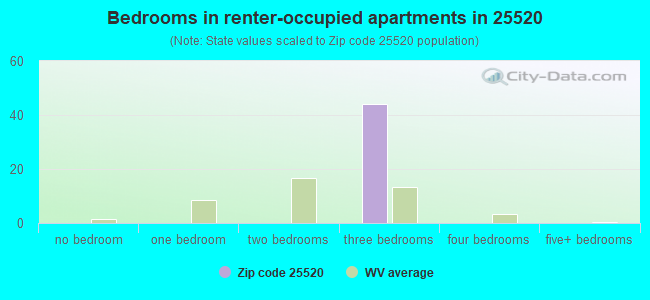
Houses and condos: 958 Renter-occupied apartments: 41
% of renters here:
5%
State:
26%
March 2022 cost of living index in zip code 25520: 83.4 (less than average, U.S. average is 100)
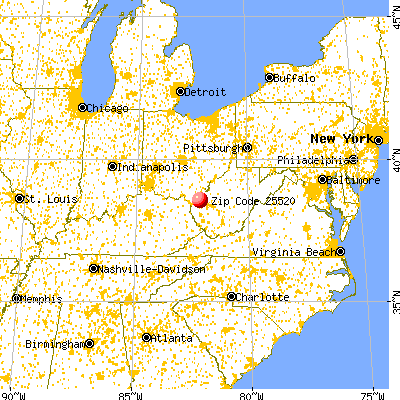
Land area: 39.5 sq. mi. Water area: 0.7 sq. mi.
Population density: 37 people per square mile
(very low).
OSM Map
General Map
Google Map
MSN Map
OSM Map
General Map
Google Map
MSN Map
OSM Map
General Map
Google Map
MSN Map
OSM Map
General Map
Google Map
MSN Map
Please wait while loading the map...
Real estate property taxes paid for housing units in 2022:
This zip code:
0.7% ($559)
West Virginia:
0.5% ($821)
Median real estate property taxes paid for housing units with mortgages in 2022: $203 Median real estate property taxes paid for housing units with no mortgage in 2022: $594
Business Search- 14 Million verified businesses
Males: 658
(45.5%)
Females: 787
(54.5%)
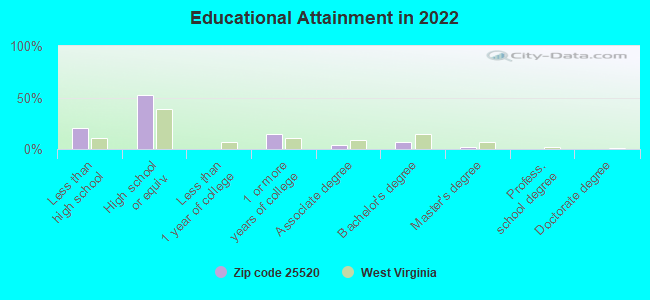
For population 25 years and over in 25520:
High school or higher: 77.3%
Bachelor's degree or higher: 9.0%
Graduate or professional degree: 2.1%
Mean travel time to work (commute): 37.6 minutes
For population 15 years and over in 25520:
Never married: 12.0%
Now married: 51.2%
Separated: 2.9%
Widowed: 29.5%
Divorced: 4.4%
Zip code 25520 compared to state average:
Median household income significantly below state average.
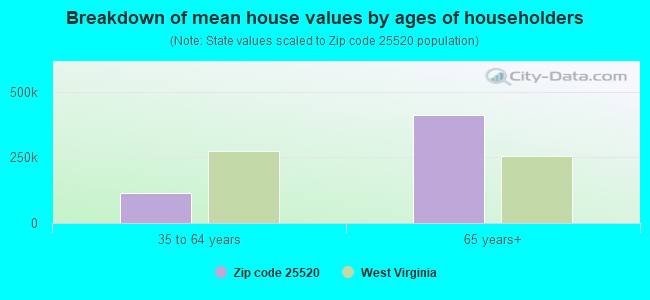
Median house value below state average.
Unemployed percentage significantly below state average.
Black race population percentage significantly below state average.
Median age significantly above state average.
Foreign-born population percentage above state average.
Renting percentage significantly below state average.
Length of stay since moving in significantly above state average.
House age below state average.
Percentage of population with a bachelor's degree or higher significantly below state average.
Estimated median house/condo value in 2022: $81,805
25520:
$81,805
West Virginia:
$155,100
According to our research of West Virginia and other state lists, there were 5 registered sex offenders living in 25520 zip code as of May 28, 2024. The ratio of all residents to sex offenders in zip code 25520 is 352 to 1. The ratio of registered sex offenders to all residents in this zip code is near the state average.
Median resident age:
This zip code:
61.1 years
West Virginia median age:
42.9 years
Average household size:
This zip code:
1.9 people
West Virginia:
2.3 people
Averages for the 2020 tax year for zip code 25520, filed in 2021:
Average Adjusted Gross Income (AGI) in 2020: $42,313 (Individual Income Tax Returns)
Here:
$42,313
State:
$56,292
Salary/wage: $40,300 (reported on 80.0% of returns)
Here:
$40,300
State:
$49,093
(% of AGI for various income ranges: 1115.6% for AGIs below $25k, 3564.2% for AGIs $25k-50k, 6150.0% for AGIs $50k-75k, 7747.5% for AGIs $75k-100k, 15526.7% for AGIs $100k-200k)
Taxable interest for individuals: $482 (reported on 20.0% of returns)
This zip code:
$482
West Virginia:
$1,141
(% of AGI for various income ranges: 24.4% for AGIs below $25k, 5.0% for AGIs $25k-50k, 7.5% for AGIs $75k-100k)
Ordinary dividends: $1,133 (reported on 5.5% of returns)
Here:
$1,133
State:
$5,456
(% of AGI for various income ranges: 28.3% for AGIs $25k-50k)
Net capital gain/loss in AGI: +$1,200 (reported on 3.6% of returns)
Here:
+$1,200
State:
+$11,656
(% of AGI for various income ranges: 13.3% for AGIs below $25k)
Profit/loss from business: +$4,825 (reported on 7.3% of returns)
Here:
+$4,825
State:
+$12,084
(% of AGI for various income ranges: 160.8% for AGIs $25k-50k)
Taxable individual retirement arrangement distribution: $15,400 (reported on 5.5% of returns)
25520:
$15,400
West Virginia:
$15,311
(% of AGI for various income ranges: 385.0% for AGIs $25k-50k)
Earned income credit: $2,583 (reported on 21.8% of returns)
Here:
$2,583
State:
$2,258
(% of AGI for various income ranges: 119.4% for AGIs below $25k, 79.2% for AGIs $25k-50k)
Percentage of individuals using paid preparers for their 2020 taxes: 98.2%
Here:
98%
State:
93%
(% for various income ranges: 96.0% for AGIs below $25k, 100.0% for AGIs $25k-50k, 100.0% for AGIs $50k-75k, 100.0% for AGIs $75k-100k, 100.0% for AGIs $100k-200k)
Averages for the 2012 tax year for zip code 25520, filed in 2013:
Average Adjusted Gross Income (AGI) in 2012: $37,954 (Individual Income Tax Returns)
Here:
$37,954
State:
$48,628
Salary/wage: $35,895 (reported on 84.0% of returns)
Here:
$35,895
State:
$42,328
(% of AGI for various income ranges: 73.5% for AGIs below $25k, 77.9% for AGIs $25k-50k, 86.3% for AGIs $50k-75k, 92.5% for AGIs $75k-100k, 67.1% for AGIs $100k-200k)
Taxable interest for individuals: $442 (reported on 24.0% of returns)
This zip code:
$442
West Virginia:
$1,211
(% of AGI for various income ranges: 0.8% for AGIs below $25k, 0.5% for AGIs $25k-50k)
Ordinary dividends: $300 (reported on 6.0% of returns)
Here:
$300
State:
$4,262
Net capital gain/loss in AGI: +$2,275 (reported on 8.0% of returns)
Here:
+$2,275
State:
+$8,875
Profit/loss from business: +$5,120 (reported on 10.0% of returns)
Here:
+$5,120
State:
+$13,636
(% of AGI for various income ranges: 6.5% for AGIs below $25k, 1.4% for AGIs $25k-50k)
Taxable individual retirement arrangement distribution: $6,300 (reported on 4.0% of returns)
25520:
$6,300
West Virginia:
$11,787
Total itemized deductions: $17,675 (18% of AGI, reported on 8.0% of returns)
Here:
$17,675
State:
$21,148
Here:
17.7% of AGI
State:
18.1% of AGI
Taxes paid: $6,175 (reported on 8.0% of returns)
25520:
$6,175
State:
$8,103
Earned income credit: $2,379 (reported on 28.0% of returns)
Here:
$2,379
State:
$2,140
(% of AGI for various income ranges: 8.6% for AGIs below $25k, 1.7% for AGIs $25k-50k)
Percentage of individuals using paid preparers for their 2012 taxes: 74.0%
Here:
74%
State:
49%
(% for various income ranges: 69.6% for AGIs below $25k, 73.3% for AGIs $25k-50k, 85.7% for AGIs $50k-75k, 133.3% for AGIs $75k-100k)
Averages for the 2004 tax year for zip code 25520, filed in 2005:
Average Adjusted Gross Income (AGI) in 2004: $28,669 (Individual Income Tax Returns)
Here:
$28,669
State:
$37,498
Salary/wage: $28,560 (reported on 84.6% of returns)
Here:
$28,560
State:
$33,645
(% of AGI for various income ranges: 80.4% for AGIs below $10k, 75.6% for AGIs $10k-25k, 86.8% for AGIs $25k-50k, 88.8% for AGIs $50k-75k, 82.6% for AGIs $75k-100k, 83.2% for AGIs over 100k)
Taxable interest for individuals: $982 (reported on 32.9% of returns)
This zip code:
$982
West Virginia:
$1,465
(% of AGI for various income ranges: 3.7% for AGIs below $10k, 3.5% for AGIs $10k-25k, 0.6% for AGIs $25k-50k, 0.5% for AGIs $50k-75k, 0.4% for AGIs $75k-100k)
Taxable dividends: $378 (reported on 7.1% of returns)
Here:
$378
State:
$2,913
Net capital gain/loss: +$615 (reported on 5.0% of returns)
Here:
+$615
State:
+$6,331
Profit/loss from business: +$7,167 (reported on 12.7% of returns)
Here:
+$7,167
State:
+$11,074
Total itemized deductions: $13,239 (21% of AGI, reported on 8.9% of returns)
Here:
$13,239
State:
$16,976
Here:
21.2% of AGI
State:
19.0% of AGI
Charity contributions deductions: $630 (1% of AGI, reported on 5.2% of returns)
Here:
$630
State:
$3,529
Here:
1.0% of AGI
State:
3.7% of AGI
Total tax: $3,159 (reported on 66.9% of returns)
25520:
$3,159
State:
$5,372
(% of AGI for various income ranges: 3.6% for AGIs below $10k, 3.5% for AGIs $10k-25k, 5.9% for AGIs $25k-50k, 8.9% for AGIs $50k-75k, 10.3% for AGIs $75k-100k, 16.6% for AGIs over 100k)
Earned income credit: $1,633 (reported on 26.8% of returns)
Here:
$1,633
State:
$1,662
Percentage of individuals using paid preparers for their 2004 taxes: 71.7%
Here:
72%
State:
55%
(% for various income ranges: 63.9% for AGIs below $10k, 77.6% for AGIs $10k-25k, 71.0% for AGIs $25k-50k, 90.7% for AGIs $50k-75k, 90.9% for AGIs over 100k)
Churches in zip code 25520 include: Union Baptist Church (A), Lawrence Chapel (B), Sunrise Church (C), Spurlock Creek Church (D), Moores Chapel (E), Fairfield Church (F). Display/hide their locations on the map
Streams, rivers, and creeks: Trace Fork (A), Perry Creek (B), Michael Branch (C), McCowan Branch (D), Lynn Fork (E), Left Fork Sprulock Creek (F), Knife Branch (G), Jenkins Branch (H), Bryan Creek (I). Display/hide their locations on the map
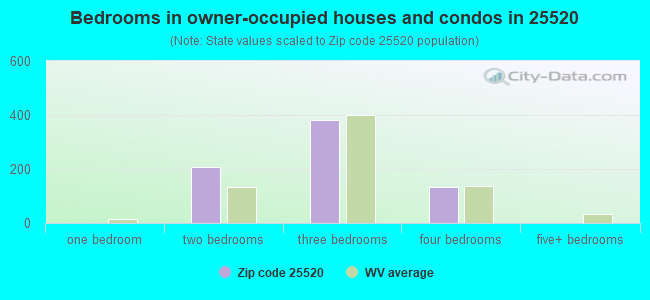
Size of family households: 241 2-persons, 22 3-persons, 19 4-persons, 13 5-persons, 51 6-persons
Size of nonfamily households: 391 1-person, 29 2-persons
190 married couples with children.
0 single-parent households ().
99.0% of residents of 25520 zip code speak English at home.
1.8% of residents speak other Indo-European language at home (100% very well).
Foreign born population: 42 (2.9%) (100.0% of them are naturalized citizens)
This zip code:
2.9%
Whole state:
1.8%
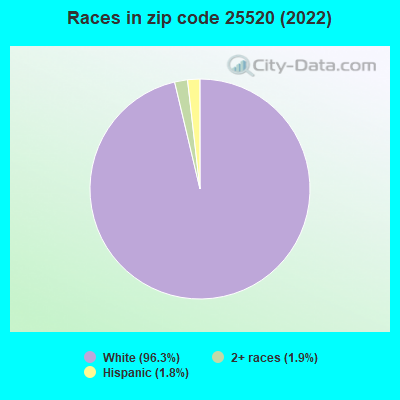
100%Nicaragua
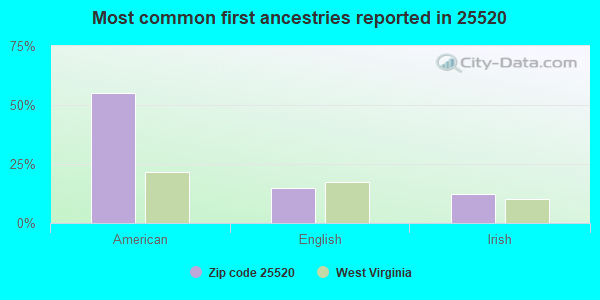
55%American
15%English
12%Irish
Year of entry for the foreign-born population
02010 or later
02000 to 2009
01990 to 1999
32Before 1990
Facilities with environmental interests located in this zip code:
DWAYNES AUTO BODY (JENKINS CREEK RD in GLENWOOD, WV)
Conditionally Exempt Small Quantity Generators, less than 100 kg/month of hazardous waste (Resource Conservation and Recovery Act (tracking hazardous waste)) - notification Organizations: DWAYNE TEMPLETON (CONTACT/OWNER)
Housing units lacking complete plumbing facilities: 11.4% Housing units lacking complete kitchen facilities: 10.9%
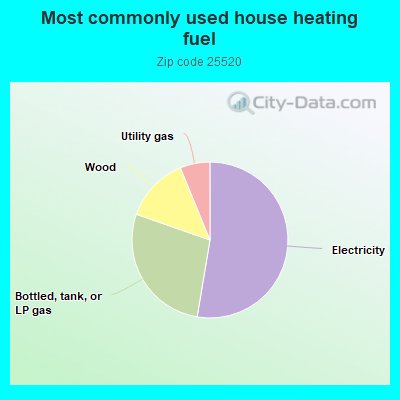
52.8%Electricity
27.8%Bottled, tank, or LP gas
13.5%Wood
6.2%Utility gas
Population in 1990: 3,201.
Place of birth for U.S.-born residents:
This state: 1,021
Midwest: 150
South: 237
71% of the 25520 zip code residents lived in the same house 5 years ago. Out of people who lived in different houses, 43% lived in this county. Out of people who lived in different counties, 50% lived in West Virginia.
97% of the 25520 zip code residents lived in the same house 1 year ago. Out of people who lived in different houses, 103% moved from this county.
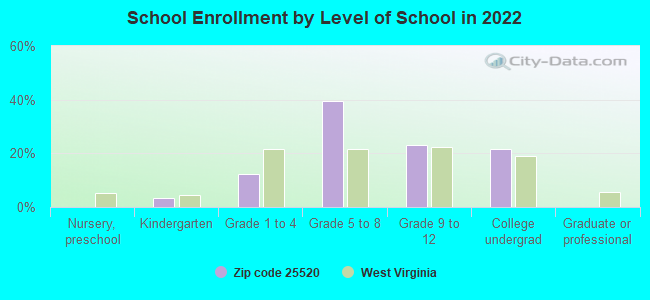
Private vs. public school enrollment:
Students in private schools in grades 1 to 8 (elementary and middle school): 55
Here:
49.9%
West Virginia:
12.2%
Students in private schools in grades 9 to 12 (high school): 14
Here:
29.7%
West Virginia:
8.8%
Students in private undergraduate colleges:
Here:
0.0%
West Virginia:
17.3%
Top industries in this zip code by the number of employees in 2005:
Construction: New Single-Family Housing Construction (except Operative Builders) (1-4 employees: 2 establishments)
Accommodation and Food Services: Drinking Places (Alcoholic Beverages) (1-4: 1)
Real Estate and Rental and Leasing: Other Activities Related to Real Estate (1-4: 1)
Professional, Scientific, and Technical Services: Building Inspection Services (1-4: 1)
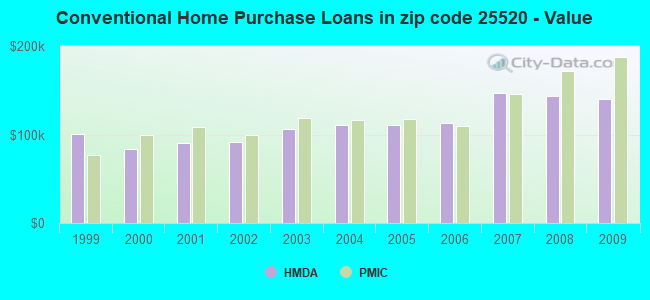
Home Mortgage Disclosure Act Aggregated Statistics For Year 2009 (Based on 2 partial tracts)
A) FHA, FSA/RHS & VA Home Purchase Loans
B) Conventional Home Purchase Loans
C) Refinancings
D) Home Improvement Loans
F) Non-occupant Loans on < 5 Family Dwellings (A B C & D)
G) Loans On Manufactured Home Dwelling (A B C & D)
Number
Average Value
Number
Average Value
Number
Average Value
Number
Average Value
Number
Average Value
Number
Average Value
LOANS ORIGINATED
9
$133,094
17
$139,685
50
$149,433
9
$54,298
3
$137,107
5
$62,578
APPLICATIONS APPROVED, NOT ACCEPTED
0
$0
0
$0
1
$147,420
1
$66,620
0
$0
1
$45,560
APPLICATIONS DENIED
4
$86,712
6
$124,642
22
$154,455
3
$52,150
1
$296,560
3
$47,133
APPLICATIONS WITHDRAWN
1
$213,610
2
$86,605
9
$163,849
0
$0
0
$0
0
$0
FILES CLOSED FOR INCOMPLETENESS
0
$0
1
$67,480
5
$139,684
0
$0
0
$0
2
$59,525
Aggregated Statistics For Year 2008 (Based on 2 partial tracts)
A) FHA, FSA/RHS & VA Home Purchase Loans
B) Conventional Home Purchase Loans
C) Refinancings
D) Home Improvement Loans
F) Non-occupant Loans on < 5 Family Dwellings (A B C & D)
G) Loans On Manufactured Home Dwelling (A B C & D)
Number
Average Value
Number
Average Value
Number
Average Value
Number
Average Value
Number
Average Value
Number
Average Value
LOANS ORIGINATED
9
$125,597
22
$143,651
36
$122,302
13
$47,774
3
$59,887
3
$77,077
APPLICATIONS APPROVED, NOT ACCEPTED
0
$0
3
$92,693
1
$200,290
1
$91,550
0
$0
1
$90,260
APPLICATIONS DENIED
2
$87,035
9
$71,060
25
$108,344
8
$51,415
1
$94,560
8
$55,551
APPLICATIONS WITHDRAWN
0
$0
4
$97,350
11
$141,405
1
$21,490
0
$0
1
$125,500
FILES CLOSED FOR INCOMPLETENESS
0
$0
0
$0
0
$0
0
$0
0
$0
0
$0
Aggregated Statistics For Year 2007 (Based on 2 partial tracts)
A) FHA, FSA/RHS & VA Home Purchase Loans
B) Conventional Home Purchase Loans
C) Refinancings
D) Home Improvement Loans
F) Non-occupant Loans on < 5 Family Dwellings (A B C & D)
G) Loans On Manufactured Home Dwelling (A B C & D)
Number
Average Value
Number
Average Value
Number
Average Value
Number
Average Value
Number
Average Value
Number
Average Value
LOANS ORIGINATED
1
$218,770
38
$147,263
35
$99,173
12
$56,733
6
$80,802
3
$44,413
APPLICATIONS APPROVED, NOT ACCEPTED
0
$0
3
$108,740
8
$71,884
3
$66,907
0
$0
1
$54,150
APPLICATIONS DENIED
0
$0
8
$92,408
26
$101,102
5
$36,790
2
$57,595
7
$52,804
APPLICATIONS WITHDRAWN
1
$140,970
5
$110,802
4
$117,442
1
$153,440
0
$0
2
$34,600
FILES CLOSED FOR INCOMPLETENESS
0
$0
0
$0
3
$131,663
0
$0
0
$0
0
$0
Aggregated Statistics For Year 2006 (Based on 2 partial tracts)
A) FHA, FSA/RHS & VA Home Purchase Loans
B) Conventional Home Purchase Loans
C) Refinancings
D) Home Improvement Loans
F) Non-occupant Loans on < 5 Family Dwellings (A B C & D)
G) Loans On Manufactured Home Dwelling (A B C & D)
Number
Average Value
Number
Average Value
Number
Average Value
Number
Average Value
Number
Average Value
Number
Average Value
LOANS ORIGINATED
3
$100,860
40
$112,608
31
$85,918
13
$32,268
9
$110,411
6
$58,597
APPLICATIONS APPROVED, NOT ACCEPTED
0
$0
6
$98,282
6
$80,015
2
$31,160
0
$0
2
$87,680
APPLICATIONS DENIED
1
$88,970
10
$55,014
24
$100,430
11
$41,535
3
$49,283
10
$47,149
APPLICATIONS WITHDRAWN
1
$45,130
4
$101,755
8
$102,884
1
$243,700
0
$0
3
$43,840
FILES CLOSED FOR INCOMPLETENESS
0
$0
1
$95,850
4
$122,170
0
$0
0
$0
0
$0
Aggregated Statistics For Year 2005 (Based on 2 partial tracts)
A) FHA, FSA/RHS & VA Home Purchase Loans
B) Conventional Home Purchase Loans
C) Refinancings
D) Home Improvement Loans
F) Non-occupant Loans on < 5 Family Dwellings (A B C & D)
G) Loans On Manufactured Home Dwelling (A B C & D)
Number
Average Value
Number
Average Value
Number
Average Value
Number
Average Value
Number
Average Value
Number
Average Value
LOANS ORIGINATED
1
$307,740
37
$111,109
49
$100,994
13
$25,887
4
$58,882
11
$45,051
APPLICATIONS APPROVED, NOT ACCEPTED
0
$0
6
$99,785
5
$99,198
3
$13,323
0
$0
4
$60,065
APPLICATIONS DENIED
2
$75,000
15
$67,565
24
$94,842
6
$15,402
2
$45,990
14
$52,374
APPLICATIONS WITHDRAWN
0
$0
2
$81,015
12
$102,400
2
$110,030
0
$0
1
$76,070
FILES CLOSED FOR INCOMPLETENESS
0
$0
0
$0
1
$141,830
0
$0
0
$0
0
$0
Aggregated Statistics For Year 2004 (Based on 2 partial tracts)
A) FHA, FSA/RHS & VA Home Purchase Loans
B) Conventional Home Purchase Loans
C) Refinancings
D) Home Improvement Loans
F) Non-occupant Loans on < 5 Family Dwellings (A B C & D)
G) Loans On Manufactured Home Dwelling (A B C & D)
Number
Average Value
Number
Average Value
Number
Average Value
Number
Average Value
Number
Average Value
Number
Average Value
LOANS ORIGINATED
2
$113,465
32
$110,298
60
$93,338
10
$35,888
2
$48,995
11
$42,472
APPLICATIONS APPROVED, NOT ACCEPTED
0
$0
4
$79,405
11
$94,907
5
$22,092
1
$27,510
5
$45,128
APPLICATIONS DENIED
1
$71,780
18
$62,345
32
$93,495
11
$30,125
3
$45,560
16
$43,544
APPLICATIONS WITHDRAWN
0
$0
2
$68,125
8
$127,650
1
$46,850
1
$58,880
0
$0
FILES CLOSED FOR INCOMPLETENESS
0
$0
1
$50,290
2
$86,820
0
$0
0
$0
0
$0
Aggregated Statistics For Year 2003 (Based on 2 partial tracts)
A) FHA, FSA/RHS & VA Home Purchase Loans
B) Conventional Home Purchase Loans
C) Refinancings
D) Home Improvement Loans
F) Non-occupant Loans on < 5 Family Dwellings (A B C & D)
Number
Average Value
Number
Average Value
Number
Average Value
Number
Average Value
Number
Average Value
LOANS ORIGINATED
1
$88,970
34
$106,047
65
$97,208
12
$20,093
3
$71,060
APPLICATIONS APPROVED, NOT ACCEPTED
0
$0
5
$34,814
11
$81,662
2
$41,045
2
$29,225
APPLICATIONS DENIED
0
$0
14
$61,554
25
$66,413
7
$27,323
2
$53,940
APPLICATIONS WITHDRAWN
0
$0
2
$104,870
11
$90,688
0
$0
0
$0
FILES CLOSED FOR INCOMPLETENESS
0
$0
0
$0
3
$88,683
0
$0
0
$0
Aggregated Statistics For Year 2002 (Based on 2 partial tracts)
A) FHA, FSA/RHS & VA Home Purchase Loans
B) Conventional Home Purchase Loans
C) Refinancings
D) Home Improvement Loans
F) Non-occupant Loans on < 5 Family Dwellings (A B C & D)
Number
Average Value
Number
Average Value
Number
Average Value
Number
Average Value
Number
Average Value
LOANS ORIGINATED
3
$81,950
25
$91,513
51
$94,522
11
$17,153
0
$0
APPLICATIONS APPROVED, NOT ACCEPTED
0
$0
5
$77,192
3
$61,173
2
$10,745
0
$0
APPLICATIONS DENIED
0
$0
15
$55,759
22
$75,625
7
$7,553
2
$91,330
APPLICATIONS WITHDRAWN
0
$0
2
$107,450
11
$147,695
2
$6,445
0
$0
FILES CLOSED FOR INCOMPLETENESS
1
$64,900
0
$0
3
$93,840
0
$0
0
$0
Aggregated Statistics For Year 2001 (Based on 2 partial tracts)
A) FHA, FSA/RHS & VA Home Purchase Loans
B) Conventional Home Purchase Loans
C) Refinancings
D) Home Improvement Loans
F) Non-occupant Loans on < 5 Family Dwellings (A B C & D)
Number
Average Value
Number
Average Value
Number
Average Value
Number
Average Value
Number
Average Value
LOANS ORIGINATED
4
$100,142
24
$90,061
54
$83,930
7
$15,227
2
$60,815
APPLICATIONS APPROVED, NOT ACCEPTED
1
$85,960
9
$59,886
6
$53,223
0
$0
1
$44,700
APPLICATIONS DENIED
0
$0
9
$41,881
23
$67,385
4
$13,325
0
$0
APPLICATIONS WITHDRAWN
0
$0
2
$74,570
10
$70,315
3
$6,017
0
$0
FILES CLOSED FOR INCOMPLETENESS
0
$0
0
$0
5
$66,704
0
$0
0
$0
Aggregated Statistics For Year 2000 (Based on 2 partial tracts)
A) FHA, FSA/RHS & VA Home Purchase Loans
B) Conventional Home Purchase Loans
C) Refinancings
D) Home Improvement Loans
F) Non-occupant Loans on < 5 Family Dwellings (A B C & D)
Number
Average Value
Number
Average Value
Number
Average Value
Number
Average Value
Number
Average Value
LOANS ORIGINATED
3
$97,993
27
$83,907
26
$65,875
3
$11,747
5
$39,972
APPLICATIONS APPROVED, NOT ACCEPTED
3
$41,977
9
$45,846
6
$37,965
1
$4,730
0
$0
APPLICATIONS DENIED
2
$45,560
20
$44,720
16
$59,930
2
$14,830
1
$30,950
APPLICATIONS WITHDRAWN
2
$45,345
2
$59,095
6
$51,003
1
$40,830
0
$0
FILES CLOSED FOR INCOMPLETENESS
0
$0
0
$0
2
$50,715
0
$0
0
$0
Aggregated Statistics For Year 1999 (Based on 1 partial tract)
A) FHA, FSA/RHS & VA Home Purchase Loans
B) Conventional Home Purchase Loans
C) Refinancings
D) Home Improvement Loans
F) Non-occupant Loans on < 5 Family Dwellings (A B C & D)
Detailed PMIC statistics for the following Tracts:0107.00
2003 - 2018 National Fire Incident Reporting System (NFIRS) incidents
Based on the data from the years 2003 - 2018 the average number of fire incidents per year is 10. The highest number of reported fire incidents - 20 took place in 2007, and the least - 3 in 2004. The data has an increasing trend.
When looking into fire subcategories, the most reports belonged to: Structure Fires (47.9%), and Outside Fires (35.6%).
Fire incident types reported to NFIRS in Zip Code 25520


 Nearest zip codes: 25503, 25541, 25537, 25545, 25502, 45623.


 Based on the data from the years 2003 - 2018 the average number of fire incidents per year is 10. The highest number of reported fire incidents - 20 took place in 2007, and the least - 3 in 2004. The data has an increasing trend.
 When looking into fire subcategories, the most reports belonged to: Structure Fires (47.9%), and Outside Fires (35.6%).