Estimated zip code population in 2022: 1,672 Zip code population in 2010: 2,152 Zip code population in 2000: 1,933
Houses and condos: 829 Renter-occupied apartments: 134
% of renters here:
17%
State:
26%
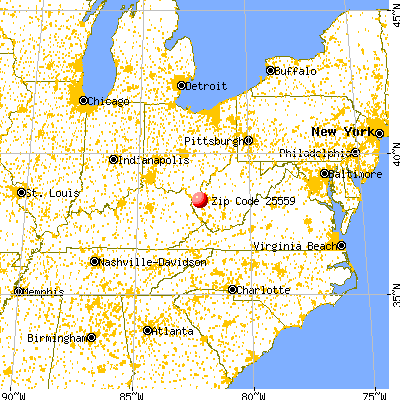
March 2022 cost of living index in zip code 25559: 82.7 (low, U.S. average is 100)
Land area: 20.4 sq. mi. Water area: 0.2 sq. mi.
Population density: 82 people per square mile
(very low).
OSM Map
General Map
Google Map
MSN Map
OSM Map
General Map
Google Map
MSN Map
OSM Map
General Map
Google Map
MSN Map
OSM Map
General Map
Google Map
MSN Map
Please wait while loading the map...
Real estate property taxes paid for housing units in 2022:
This zip code:
0.6% ($725)
West Virginia:
0.5% ($821)
Median real estate property taxes paid for housing units with mortgages in 2022: $859 (0.5%) Median real estate property taxes paid for housing units with no mortgage in 2022: $669 (0.5%)
Business Search- 14 Million verified businesses
Males: 881
(52.7%)
Females: 790
(47.3%)
For population 25 years and over in 25559:
High school or higher: 91.5%
Bachelor's degree or higher: 11.7%
Graduate or professional degree: 1.4%
Unemployed: 2.5%
Mean travel time to work (commute): 30.0 minutes
For population 15 years and over in 25559:
Never married: 9.7%
Now married: 59.8%
Separated: 0.0%
Widowed: 16.8%
Divorced: 13.7%
Zip code 25559 compared to state average:
Median household income below state average.
Unemployed percentage below state average.
Black race population percentage significantly below state average.
Hispanic race population percentage significantly above state average.
Median age significantly above state average.
Foreign-born population percentage significantly below state average.
Percentage of population with a bachelor's degree or higher below state average.
Estimated median house/condo value in 2022: $113,400
25559:
$113,400
West Virginia:
$155,100
According to our research of West Virginia and other state lists, there were 5 registered sex offenders living in 25559 zip code as of June 08, 2024. The ratio of all residents to sex offenders in zip code 25559 is 412 to 1. The ratio of registered sex offenders to all residents in this zip code is lower than the state average.
Median resident age:
This zip code:
54.1 years
West Virginia median age:
42.9 years
Average household size:
This zip code:
2.2 people
West Virginia:
2.3 people
Averages for the 2020 tax year for zip code 25559, filed in 2021:
Average Adjusted Gross Income (AGI) in 2020: $56,739 (Individual Income Tax Returns)
Here:
$56,739
State:
$56,292
Salary/wage: $53,786 (reported on 80.0% of returns)
Here:
$53,786
State:
$49,093
(% of AGI for various income ranges: 1057.6% for AGIs below $25k, 3348.9% for AGIs $25k-50k, 6006.0% for AGIs $50k-75k, 8830.0% for AGIs $75k-100k, 17407.0% for AGIs $100k-200k)
Taxable interest for individuals: $482 (reported on 24.4% of returns)
This zip code:
$482
West Virginia:
$1,141
(% of AGI for various income ranges: 12.9% for AGIs below $25k, 14.4% for AGIs $25k-50k, 26.0% for AGIs $50k-75k, 3.8% for AGIs $75k-100k, 24.0% for AGIs $100k-200k)
Ordinary dividends: $2,350 (reported on 6.7% of returns)
Here:
$2,350
State:
$5,456
(% of AGI for various income ranges: 33.3% for AGIs $25k-50k, 81.0% for AGIs $100k-200k)
Net capital gain/loss in AGI: +$1,117 (reported on 6.7% of returns)
Here:
+$1,117
State:
+$11,656
(% of AGI for various income ranges: 105.0% for AGIs $75k-100k)
Profit/loss from business: +$10,229 (reported on 7.8% of returns)
Here:
+$10,229
State:
+$12,084
(% of AGI for various income ranges: 68.6% for AGIs below $25k, 165.6% for AGIs $25k-50k, 342.5% for AGIs $75k-100k)
Taxable individual retirement arrangement distribution: $7,914 (reported on 7.8% of returns)
25559:
$7,914
West Virginia:
$15,311
(% of AGI for various income ranges: 182.4% for AGIs below $25k, 171.0% for AGIs $50k-75k)
Earned income credit: $2,180 (reported on 16.7% of returns)
Here:
$2,180
State:
$2,258
(% of AGI for various income ranges: 90.0% for AGIs below $25k, 76.7% for AGIs $25k-50k)
Percentage of individuals using paid preparers for their 2020 taxes: 93.3%
Here:
93%
State:
93%
(% for various income ranges: 90.0% for AGIs below $25k, 95.5% for AGIs $25k-50k, 92.3% for AGIs $50k-75k, 100.0% for AGIs $75k-100k, 93.3% for AGIs $100k-200k)
Averages for the 2012 tax year for zip code 25559, filed in 2013:
Average Adjusted Gross Income (AGI) in 2012: $45,790 (Individual Income Tax Returns)
Here:
$45,790
State:
$48,628
Salary/wage: $44,184 (reported on 83.3% of returns)
Here:
$44,184
State:
$42,328
(% of AGI for various income ranges: 69.6% for AGIs below $25k, 75.9% for AGIs $25k-50k, 86.0% for AGIs $50k-75k, 84.7% for AGIs $75k-100k, 80.0% for AGIs $100k-200k)
Taxable interest for individuals: $768 (reported on 27.8% of returns)
This zip code:
$768
West Virginia:
$1,211
(% of AGI for various income ranges: 1.9% for AGIs below $25k, 0.5% for AGIs $25k-50k, 0.1% for AGIs $75k-100k, 0.4% for AGIs $100k-200k)
Ordinary dividends: $938 (reported on 8.9% of returns)
Here:
$938
State:
$4,262
(% of AGI for various income ranges: 0.2% for AGIs below $25k, 0.3% for AGIs $25k-50k, 0.5% for AGIs $75k-100k)
Net capital gain/loss in AGI: +$675 (reported on 4.4% of returns)
Here:
+$675
State:
+$8,875
Profit/loss from business: +$6,488 (reported on 8.9% of returns)
Here:
+$6,488
State:
+$13,636
Taxable individual retirement arrangement distribution: $5,533 (reported on 6.7% of returns)
25559:
$5,533
West Virginia:
$11,787
Total itemized deductions: $18,193 (17% of AGI, reported on 15.6% of returns)
Here:
$18,193
State:
$21,148
Here:
17.1% of AGI
State:
18.1% of AGI
(% of AGI for various income ranges: 6.6% for AGIs below $25k, 4.8% for AGIs $50k-75k, 6.4% for AGIs $75k-100k, 10.6% for AGIs $100k-200k)
Charity contributions: $3,370 (reported on 11.1% of returns)
Here:
$3,370
State:
$4,508
(% of AGI for various income ranges: 1.3% for AGIs $25k-50k, 1.1% for AGIs $75k-100k, 1.3% for AGIs $100k-200k)
Taxes paid: $7,536 (reported on 15.6% of returns)
25559:
$7,536
State:
$8,103
(% of AGI for various income ranges: 0.8% for AGIs below $25k, 1.3% for AGIs $50k-75k, 2.2% for AGIs $75k-100k, 6.0% for AGIs $100k-200k)
Earned income credit: $2,224 (reported on 18.9% of returns)
Here:
$2,224
State:
$2,140
(% of AGI for various income ranges: 6.2% for AGIs below $25k, 1.3% for AGIs $25k-50k)
Percentage of individuals using paid preparers for their 2012 taxes: 61.1%
Here:
61%
State:
49%
(% for various income ranges: 54.1% for AGIs below $25k, 65.0% for AGIs $25k-50k, 66.7% for AGIs $50k-75k, 60.0% for AGIs $75k-100k, 75.0% for AGIs $100k-200k)
Averages for the 2004 tax year for zip code 25559, filed in 2005:
Average Adjusted Gross Income (AGI) in 2004: $34,181 (Individual Income Tax Returns)
Here:
$34,181
State:
$37,498
Salary/wage: $34,004 (reported on 87.8% of returns)
Here:
$34,004
State:
$33,645
(% of AGI for various income ranges: 112.7% for AGIs below $10k, 77.9% for AGIs $10k-25k, 85.6% for AGIs $25k-50k, 91.8% for AGIs $50k-75k, 91.8% for AGIs $75k-100k, 75.4% for AGIs over 100k)
Taxable interest for individuals: $775 (reported on 43.0% of returns)
This zip code:
$775
West Virginia:
$1,465
(% of AGI for various income ranges: 2.0% for AGIs below $10k, 2.7% for AGIs $10k-25k, 0.8% for AGIs $25k-50k, 0.8% for AGIs $50k-75k, 0.1% for AGIs $75k-100k, 0.7% for AGIs over 100k)
Taxable dividends: $571 (reported on 7.8% of returns)
Here:
$571
State:
$2,913
(% of AGI for various income ranges: 0.3% for AGIs $10k-25k, 0.2% for AGIs $25k-50k, 0.1% for AGIs $50k-75k, 0.1% for AGIs $75k-100k)
Profit/loss from business: +$1,830 (reported on 9.8% of returns)
Here:
+$1,830
State:
+$11,074
(% of AGI for various income ranges: -5.9% for AGIs below $10k, 2.7% for AGIs $10k-25k, 0.8% for AGIs $25k-50k, 0.2% for AGIs $50k-75k)
IRA payment deduction: $2,238 (reported on 2.3% of returns)
25559:
$2,238
West Virginia:
$2,796
Total itemized deductions: $14,574 (22% of AGI, reported on 13.6% of returns)
Here:
$14,574
State:
$16,976
Here:
21.8% of AGI
State:
19.0% of AGI
(% of AGI for various income ranges: 5.6% for AGIs $10k-25k, 4.3% for AGIs $25k-50k, 4.6% for AGIs $50k-75k, 9.3% for AGIs $75k-100k, 11.0% for AGIs over 100k)
Charity contributions deductions: $2,295 (3% of AGI, reported on 9.8% of returns)
Here:
$2,295
State:
$3,529
Here:
3.0% of AGI
State:
3.7% of AGI
(% of AGI for various income ranges: 0.4% for AGIs $25k-50k, 0.8% for AGIs $50k-75k, 1.0% for AGIs $75k-100k, 1.8% for AGIs over 100k)
Total tax: $3,692 (reported on 71.9% of returns)
25559:
$3,692
State:
$5,372
(% of AGI for various income ranges: 2.4% for AGIs below $10k, 3.3% for AGIs $10k-25k, 6.1% for AGIs $25k-50k, 8.0% for AGIs $50k-75k, 10.0% for AGIs $75k-100k, 18.0% for AGIs over 100k)
Earned income credit: $1,561 (reported on 19.0% of returns)
Here:
$1,561
State:
$1,662
Percentage of individuals using paid preparers for their 2004 taxes: 58.6%
Here:
59%
State:
55%
(% for various income ranges: 50.8% for AGIs below $10k, 57.7% for AGIs $10k-25k, 64.4% for AGIs $25k-50k, 58.6% for AGIs $50k-75k, 76.8% for AGIs $75k-100k)
Household received Food Stamps/SNAP in the past 12 months: 300 Household did not receive Food Stamps/SNAP in the past 12 months: 492
Women who did not have a birth in the past 12 months: 267 (104 now married, 162 unmarried)
Housing units in zip code 25559 with a mortgage: 317 (49 second mortgage, 49 both second mortgage and home equity loan) Median monthly owner costs for units with a mortgage: $1,039 Median monthly owner costs for units without a mortgage: $335
Residents with income below the poverty level in 2022:
This zip code:
19.5%
Whole state:
17.9%
Residents with income below 50% of the poverty level in 2022:
This zip code:
8.1%
Whole state:
9.7%
Median number of rooms in houses and condos:
Here:
6.6
State:
6.5
Notable locations in this zip code not listed on our city pages
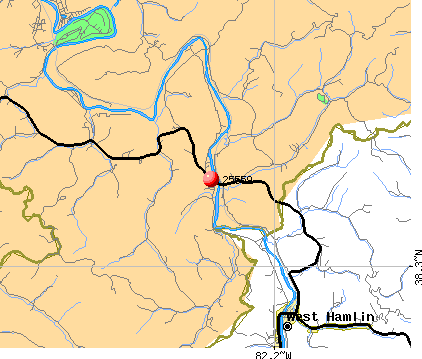
Notable locations in zip code 25559: Camp Asbury (A), Camp Dekanawida (B), Salt Rock Public Library (C), Salt Rock Volunteer Fire Department (D). Display/hide their locations on the map
Churches in zip code 25559 include: Upper Madison Church (A), Salt Rock Church (B), Merritt Creek Church (C), Mount Zion Church (D), Enom Church (E), Friendly United Church (F). Display/hide their locations on the map
Cemeteries: Gill Cemetery (1), Enom Cemetery (2), Ross Cemetery (3), Mount Zion Cemetery (4), Porter Cemetery (5), Baylous Cemetery (6). Display/hide their locations on the map
Streams, rivers, and creeks: Trace Creek (A), Smith Creek (B), Reuben Branch (C), Ray Branch (D), Merritt Creek (E), Madison Creek (F), Lisle Branch (G), Cavill Creek (H), Tyler Creek (I). Display/hide their locations on the map
Size of family households: 302 2-persons, 225 3-persons, 16 4-persons, 94 5-persons
Size of nonfamily households: 147 1-person
283 married couples with children.
55 single-parent households (55 women).
93.1% of residents of 25559 zip code speak English at home.
8.6% of residents speak Spanish at home (100% very well).
Foreign born population: 0 (0.0%)
:
0.0%
Whole state:
1.8%
25%English
19%American
6%Scottish
5%Irish
1%Scotch-Irish
Facilities with environmental interests located in this zip code:
HOLIDAY PARK LEISURE ACRES (P. O. BOX 302 in SALT ROCK, WV)
National Pollutant Discharge Elimination System NON-MAJOR (Tracking pollutant discharge elimination systems) - permit Business SIC classification: SPORTING AND RECREATIONAL CAMPS Alternative names: HOLIDAY PARK LEISURE ACRES SEW, MAYFORD G WITT
KEITH WATSON BODY SHOP (714 MCCOMAS RD in SALT ROCK, WV)
(Resource Conservation and Recovery Act (tracking hazardous waste))
65.2%Electricity
27.1%Utility gas
8.0%Wood
Population in 1990: 1,482. Population change in the 1990s: +451 (+30.4%).
Place of birth for U.S.-born residents:
This state: 1,321
Northeast: 21
Midwest: 43
South: 278
65% of the 25559 zip code residents lived in the same house 5 years ago. Out of people who lived in different houses, 71% lived in this county. Out of people who lived in different counties, 50% lived in West Virginia.
90% of the 25559 zip code residents lived in the same house 1 year ago. Out of people who lived in different houses, 94% moved from this county.
Private vs. public school enrollment:
Students in private schools in grades 1 to 8 (elementary and middle school):
Here:
0.0%
West Virginia:
12.2%
Students in private schools in grades 9 to 12 (high school):
Here:
0.0%
West Virginia:
8.8%
Students in private undergraduate colleges:
Here:
0.0%
West Virginia:
17.3%
Companies with federal contracts located in this zip code:
TRI-STATE COATING AND MACHINE (5610 MCCOMAS RD in SALT ROCK, WV; small business) : $598,487 in 18 contractsfrom 2001 to 2006
Contracts for Maintenance, Repair or Alteration of Real Property -- Restoration of real property, Non-nuclear Ship Repair (East) Ship repair (including overhauls and conversions) performed on non-nuclear propelled and nonpropelled ships east of the 108th meridian, Ship and Boat Propulsion Components, Miscellaneous Ship and Marine Equipment, and moreby U.S. Army Corps of Engineers - civil program financing only, Army, Navy Signed by year:2000: $0; 2001: $70,724; 2002: $46,852; 2003: $113,764; 2004: $53,950; 2005: $241,546; 2006: $71,651.
Biggest contracts:
$93,904 with U.S. Army Corps of Engineers - civil program financing only for Maintenance, Repair or Alteration of Real Property -- Restoration of real property. Signed on 2005-06-22. Completion date: 2005-07-29.
$93,904 with Army for Maintenance, Repair or Alteration of Real Property -- Restoration of real property. Signed on 2005-06-22. Completion date: 2005-07-29.
$55,061 with Navy for Non-nuclear Ship Repair (East) Ship repair (including overhauls and conversions) performed on non-nuclear propelled and nonpropelled ships east of the 108th meridian. Signed on 2006-02-28. Completion date: 2006-03-31.
$53,950 with Navy for Ship and Boat Propulsion Components. Signed on 2004-03-05. Completion date: 2004-04-30.
Top industries in this zip code by the number of employees in 2005:
Construction: Other Heavy and Civil Engineering Construction (10-19 employees: 1 establishment, 5-9 employees: 1 establishment)
Arts, Entertainment, and Recreation: Amusement Arcades (10-19: 1)
Accommodation and Food Services: Limited-Service Restaurants (5-9: 2)
Construction: New Single-Family Housing Construction (except Operative Builders) (5-9: 1, 1-4: 1)
Finance and Insurance: Insurance Agencies and Brokerages (1-4: 2)
Construction: Electrical Contractors (1-4: 1)
Professional, Scientific, and Technical Services: Tax Preparation Services (1-4: 1)
Fatal accident statistics in 2014:
Fatal accident count: 1
Vehicles involved in fatal accidents: 2
Fatal accidents caused by drunken drivers: 0
Fatalities: 1
Persons involved in fatal accidents: 5
Pedestrians involved in fatal accidents: 0
Fatal accident statistics in 2012:
Fatal accident count: 1
Vehicles involved in fatal accidents: 2
Fatal accidents caused by drunken drivers: 0
Fatalities: 1
Persons involved in fatal accidents: 3
Pedestrians involved in fatal accidents: 0
Home Mortgage Disclosure Act Aggregated Statistics For Year 2009 (Based on 4 partial tracts)
A) FHA, FSA/RHS & VA Home Purchase Loans
B) Conventional Home Purchase Loans
C) Refinancings
D) Home Improvement Loans
F) Non-occupant Loans on < 5 Family Dwellings (A B C & D)
G) Loans On Manufactured Home Dwelling (A B C & D)
Number
Average Value
Number
Average Value
Number
Average Value
Number
Average Value
Number
Average Value
Number
Average Value
LOANS ORIGINATED
12
$131,386
13
$153,575
59
$121,336
10
$57,934
2
$72,180
2
$57,680
APPLICATIONS APPROVED, NOT ACCEPTED
1
$58,000
3
$91,407
4
$73,600
1
$78,800
1
$116,620
2
$58,940
APPLICATIONS DENIED
3
$115,573
3
$78,590
25
$116,246
6
$14,815
1
$29,630
3
$90,357
APPLICATIONS WITHDRAWN
2
$99,920
1
$107,170
9
$142,610
1
$39,720
0
$0
1
$91,410
FILES CLOSED FOR INCOMPLETENESS
1
$151,930
0
$0
4
$127,812
1
$19,540
0
$0
1
$6,930
Aggregated Statistics For Year 2008 (Based on 4 partial tracts)
A) FHA, FSA/RHS & VA Home Purchase Loans
B) Conventional Home Purchase Loans
C) Refinancings
D) Home Improvement Loans
F) Non-occupant Loans on < 5 Family Dwellings (A B C & D)
G) Loans On Manufactured Home Dwelling (A B C & D)
Number
Average Value
Number
Average Value
Number
Average Value
Number
Average Value
Number
Average Value
Number
Average Value
LOANS ORIGINATED
6
$108,848
17
$111,173
49
$103,797
14
$92,939
6
$98,658
4
$46,178
APPLICATIONS APPROVED, NOT ACCEPTED
1
$100,230
5
$68,210
4
$99,760
1
$18,280
1
$65,560
6
$52,533
APPLICATIONS DENIED
1
$73,760
8
$66,586
35
$114,679
9
$39,436
1
$40,980
8
$60,598
APPLICATIONS WITHDRAWN
0
$0
4
$115,678
14
$131,709
1
$59,890
1
$192,900
1
$93,930
FILES CLOSED FOR INCOMPLETENESS
0
$0
0
$0
2
$76,280
0
$0
0
$0
0
$0
Aggregated Statistics For Year 2007 (Based on 4 partial tracts)
A) FHA, FSA/RHS & VA Home Purchase Loans
B) Conventional Home Purchase Loans
C) Refinancings
D) Home Improvement Loans
E) Loans on Dwellings For 5+ Families
F) Non-occupant Loans on < 5 Family Dwellings (A B C & D)
G) Loans On Manufactured Home Dwelling (A B C & D)
Number
Average Value
Number
Average Value
Number
Average Value
Number
Average Value
Number
Average Value
Number
Average Value
Number
Average Value
LOANS ORIGINATED
4
$121,825
35
$115,813
55
$96,153
13
$36,563
0
$0
4
$51,692
6
$71,760
APPLICATIONS APPROVED, NOT ACCEPTED
0
$0
14
$67,993
8
$92,826
4
$31,520
0
$0
1
$34,670
13
$60,034
APPLICATIONS DENIED
0
$0
17
$69,678
37
$101,784
10
$39,967
1
$18,910
3
$41,397
16
$60,479
APPLICATIONS WITHDRAWN
0
$0
2
$85,735
12
$136,062
1
$116,620
0
$0
0
$0
0
$0
FILES CLOSED FOR INCOMPLETENESS
0
$0
1
$63,040
4
$155,235
0
$0
0
$0
0
$0
0
$0
Aggregated Statistics For Year 2006 (Based on 4 partial tracts)
A) FHA, FSA/RHS & VA Home Purchase Loans
B) Conventional Home Purchase Loans
C) Refinancings
D) Home Improvement Loans
F) Non-occupant Loans on < 5 Family Dwellings (A B C & D)
G) Loans On Manufactured Home Dwelling (A B C & D)
Number
Average Value
Number
Average Value
Number
Average Value
Number
Average Value
Number
Average Value
Number
Average Value
LOANS ORIGINATED
3
$79,010
25
$106,260
46
$72,921
12
$21,591
3
$56,317
3
$52,323
APPLICATIONS APPROVED, NOT ACCEPTED
1
$82,580
8
$73,520
11
$54,673
2
$10,085
1
$40,350
4
$41,290
APPLICATIONS DENIED
1
$121,040
25
$68,008
39
$75,454
16
$32,584
4
$32,780
23
$52,268
APPLICATIONS WITHDRAWN
2
$127,655
4
$68,712
19
$102,855
1
$32,780
0
$0
3
$26,057
FILES CLOSED FOR INCOMPLETENESS
0
$0
0
$0
8
$87,862
1
$15,760
1
$39,720
0
$0
Aggregated Statistics For Year 2005 (Based on 4 partial tracts)
A) FHA, FSA/RHS & VA Home Purchase Loans
B) Conventional Home Purchase Loans
C) Refinancings
D) Home Improvement Loans
F) Non-occupant Loans on < 5 Family Dwellings (A B C & D)
G) Loans On Manufactured Home Dwelling (A B C & D)
Number
Average Value
Number
Average Value
Number
Average Value
Number
Average Value
Number
Average Value
Number
Average Value
LOANS ORIGINATED
3
$126,290
53
$97,724
57
$99,393
16
$56,184
4
$76,278
15
$52,491
APPLICATIONS APPROVED, NOT ACCEPTED
1
$67,450
13
$65,077
16
$97,358
3
$43,077
2
$36,250
9
$54,284
APPLICATIONS DENIED
1
$76,280
28
$53,877
43
$79,826
13
$23,034
3
$50,013
26
$49,923
APPLICATIONS WITHDRAWN
2
$122,300
6
$75,018
17
$97,824
4
$101,968
1
$31,520
2
$61,780
FILES CLOSED FOR INCOMPLETENESS
2
$115,365
1
$125,450
1
$75,650
0
$0
0
$0
1
$64,930
Aggregated Statistics For Year 2004 (Based on 4 partial tracts)
A) FHA, FSA/RHS & VA Home Purchase Loans
B) Conventional Home Purchase Loans
C) Refinancings
D) Home Improvement Loans
F) Non-occupant Loans on < 5 Family Dwellings (A B C & D)
G) Loans On Manufactured Home Dwelling (A B C & D)
Number
Average Value
Number
Average Value
Number
Average Value
Number
Average Value
Number
Average Value
Number
Average Value
LOANS ORIGINATED
5
$92,920
43
$96,363
59
$85,029
21
$45,539
2
$57,995
11
$49,056
APPLICATIONS APPROVED, NOT ACCEPTED
1
$59,890
8
$75,018
15
$81,195
3
$34,253
0
$0
5
$41,858
APPLICATIONS DENIED
3
$86,997
24
$49,854
36
$81,024
13
$32,926
1
$46,020
16
$40,661
APPLICATIONS WITHDRAWN
3
$56,737
9
$75,088
18
$97,257
1
$39,720
2
$73,125
3
$79,640
FILES CLOSED FOR INCOMPLETENESS
0
$0
2
$61,780
5
$98,972
2
$45,705
0
$0
0
$0
Aggregated Statistics For Year 2003 (Based on 4 partial tracts)
A) FHA, FSA/RHS & VA Home Purchase Loans
B) Conventional Home Purchase Loans
C) Refinancings
D) Home Improvement Loans
F) Non-occupant Loans on < 5 Family Dwellings (A B C & D)
Number
Average Value
Number
Average Value
Number
Average Value
Number
Average Value
Number
Average Value
LOANS ORIGINATED
8
$79,036
47
$94,171
117
$83,956
17
$17,466
8
$44,365
APPLICATIONS APPROVED, NOT ACCEPTED
0
$0
14
$50,522
19
$67,486
5
$10,086
1
$18,280
APPLICATIONS DENIED
1
$69,340
38
$46,749
47
$67,587
9
$26,897
1
$25,850
APPLICATIONS WITHDRAWN
1
$61,780
8
$91,092
19
$91,972
1
$6,300
1
$136,800
FILES CLOSED FOR INCOMPLETENESS
1
$69,970
0
$0
4
$63,198
0
$0
1
$32,780
Aggregated Statistics For Year 2002 (Based on 4 partial tracts)
A) FHA, FSA/RHS & VA Home Purchase Loans
B) Conventional Home Purchase Loans
C) Refinancings
D) Home Improvement Loans
F) Non-occupant Loans on < 5 Family Dwellings (A B C & D)
Number
Average Value
Number
Average Value
Number
Average Value
Number
Average Value
Number
Average Value
LOANS ORIGINATED
6
$81,952
45
$101,144
81
$82,108
18
$16,566
10
$115,489
APPLICATIONS APPROVED, NOT ACCEPTED
0
$0
25
$44,153
14
$65,201
4
$22,852
1
$13,240
APPLICATIONS DENIED
1
$46,020
46
$49,569
45
$66,696
8
$11,348
1
$34,670
APPLICATIONS WITHDRAWN
0
$0
4
$95,348
19
$70,605
0
$0
1
$46,020
FILES CLOSED FOR INCOMPLETENESS
0
$0
0
$0
4
$56,262
0
$0
0
$0
Aggregated Statistics For Year 2001 (Based on 4 partial tracts)
A) FHA, FSA/RHS & VA Home Purchase Loans
B) Conventional Home Purchase Loans
C) Refinancings
D) Home Improvement Loans
F) Non-occupant Loans on < 5 Family Dwellings (A B C & D)
Number
Average Value
Number
Average Value
Number
Average Value
Number
Average Value
Number
Average Value
LOANS ORIGINATED
8
$92,196
35
$71,685
61
$80,299
9
$28,018
7
$46,740
APPLICATIONS APPROVED, NOT ACCEPTED
0
$0
15
$51,273
18
$53,094
7
$19,091
2
$47,910
APPLICATIONS DENIED
0
$0
33
$49,592
37
$66,993
9
$13,519
1
$7,560
APPLICATIONS WITHDRAWN
0
$0
7
$65,741
19
$83,545
1
$24,590
2
$58,940
FILES CLOSED FOR INCOMPLETENESS
0
$0
0
$0
6
$63,460
0
$0
1
$39,720
Aggregated Statistics For Year 2000 (Based on 4 partial tracts)
A) FHA, FSA/RHS & VA Home Purchase Loans
B) Conventional Home Purchase Loans
C) Refinancings
D) Home Improvement Loans
F) Non-occupant Loans on < 5 Family Dwellings (A B C & D)
Number
Average Value
Number
Average Value
Number
Average Value
Number
Average Value
Number
Average Value
LOANS ORIGINATED
4
$63,512
37
$70,298
37
$63,466
12
$15,550
2
$32,150
APPLICATIONS APPROVED, NOT ACCEPTED
4
$43,812
14
$49,621
13
$65,804
3
$22,903
0
$0
APPLICATIONS DENIED
4
$34,830
32
$36,524
39
$64,915
9
$18,772
4
$33,095
APPLICATIONS WITHDRAWN
0
$0
6
$65,142
21
$63,970
1
$6,300
0
$0
FILES CLOSED FOR INCOMPLETENESS
0
$0
1
$39,080
3
$73,547
0
$0
0
$0
Aggregated Statistics For Year 1999 (Based on 2 partial tracts)
A) FHA, FSA/RHS & VA Home Purchase Loans
B) Conventional Home Purchase Loans
C) Refinancings
D) Home Improvement Loans
F) Non-occupant Loans on < 5 Family Dwellings (A B C & D)
Detailed PMIC statistics for the following Tracts:0105.00
2003 - 2018 National Fire Incident Reporting System (NFIRS) incidents
According to the data from the years 2003 - 2018 the average number of fire incidents per year is 18. The highest number of fires - 37 took place in 2005, and the least - 9 in 2018. The data has a dropping trend.
When looking into fire subcategories, the most incidents belonged to: Structure Fires (39.6%), and Outside Fires (35.2%).
Fire incident types reported to NFIRS in Zip Code 25559


 Nearest zip codes: 25504, 25571, 25506, 25545, 25702, 25705.


 According to the data from the years 2003 - 2018 the average number of fire incidents per year is 18. The highest number of fires - 37 took place in 2005, and the least - 9 in 2018. The data has a dropping trend.
 When looking into fire subcategories, the most incidents belonged to: Structure Fires (39.6%), and Outside Fires (35.2%).