Averages for the 2020 tax year for zip code 25669, filed in 2021:
Average Adjusted Gross Income (AGI) in 2020: $40,821 (Individual Income Tax Returns)
Here:
$40,821
State:
$56,292
Salary/wage: $38,117 (reported on 79.3% of returns)
Here:
$38,117
State:
$49,093
(% of AGI for various income ranges: 950.0% for AGIs below $25k, 2732.9% for AGIs $25k-50k, 6580.0% for AGIs $50k-75k, 13070.0% for AGIs $100k-200k)
Taxable interest for individuals: $175 (reported on 13.8% of returns)
This zip code:
$175
West Virginia:
$1,141
(% of AGI for various income ranges: 10.0% for AGIs $25k-50k)
Profit/loss from business: +$7,333 (reported on 10.3% of returns)
Here:
+$7,333
State:
+$12,084
(% of AGI for various income ranges: 220.0% for AGIs below $25k)
Earned income credit: $3,144 (reported on 31.0% of returns)
Here:
$3,144
State:
$2,258
(% of AGI for various income ranges: 195.0% for AGIs below $25k, 125.7% for AGIs $25k-50k)
Percentage of individuals using paid preparers for their 2020 taxes: 96.6%
Here:
97%
State:
93%
(% for various income ranges: 91.7% for AGIs below $25k, 100.0% for AGIs $25k-50k, 100.0% for AGIs $50k-75k, 100.0% for AGIs $100k-200k)
Averages for the 2012 tax year for zip code 25669, filed in 2013:
Average Adjusted Gross Income (AGI) in 2012: $40,003 (Individual Income Tax Returns)
Here:
$40,003
State:
$48,628
Salary/wage: $38,980 (reported on 85.7% of returns)
Here:
$38,980
State:
$42,328
(% of AGI for various income ranges: 70.0% for AGIs below $25k, 77.2% for AGIs $25k-50k, 89.0% for AGIs $50k-75k, 87.8% for AGIs $75k-100k, 88.4% for AGIs $100k-200k)
Taxable interest for individuals: $514 (reported on 20.0% of returns)
This zip code:
$514
West Virginia:
$1,211
Profit/loss from business: +$8,280 (reported on 14.3% of returns)
Here:
+$8,280
State:
+$13,636
Total itemized deductions: $17,033 (23% of AGI, reported on 8.6% of returns)
Here:
$17,033
State:
$21,148
Here:
22.7% of AGI
State:
18.1% of AGI
Taxes paid: $4,967 (reported on 8.6% of returns)
25669:
$4,967
State:
$8,103
Earned income credit: $2,625 (reported on 34.3% of returns)
Here:
$2,625
State:
$2,140
(% of AGI for various income ranges: 12.7% for AGIs below $25k, 1.7% for AGIs $25k-50k)
Percentage of individuals using paid preparers for their 2012 taxes: 60.0%
Here:
60%
State:
49%
(% for various income ranges: 47.1% for AGIs below $25k, 71.4% for AGIs $25k-50k, 60.0% for AGIs $50k-75k, 125.0% for AGIs $75k-100k)
Averages for the 2004 tax year for zip code 25669, filed in 2005:
Average Adjusted Gross Income (AGI) in 2004: $27,514 (Individual Income Tax Returns)
Here:
$27,514
State:
$37,498
Salary/wage: $26,754 (reported on 87.8% of returns)
Here:
$26,754
State:
$33,645
(% of AGI for various income ranges: 79.7% for AGIs below $10k, 75.9% for AGIs $10k-25k, 83.0% for AGIs $25k-50k, 93.0% for AGIs $50k-75k, 89.6% for AGIs $75k-100k)
Taxable interest for individuals: $806 (reported on 26.5% of returns)
This zip code:
$806
West Virginia:
$1,465
(% of AGI for various income ranges: 0.6% for AGIs below $10k, 2.7% for AGIs $10k-25k, 0.6% for AGIs $25k-50k, 0.2% for AGIs $50k-75k)
Taxable dividends: $208 (reported on 6.5% of returns)
Here:
$208
State:
$2,913
Net capital gain/loss: +$500 (reported on 3.2% of returns)
Here:
+$500
State:
+$6,331
Profit/loss from business: +$3,000 (reported on 7.3% of returns)
Here:
+$3,000
State:
+$11,074
Total itemized deductions: $13,259 (23% of AGI, reported on 7.3% of returns)
Here:
$13,259
State:
$16,976
Here:
23.3% of AGI
State:
19.0% of AGI
Charity contributions deductions: $2,455 (4% of AGI, reported on 5.9% of returns)
Here:
$2,455
State:
$3,529
Here:
4.1% of AGI
State:
3.7% of AGI
Total tax: $2,677 (reported on 61.9% of returns)
25669:
$2,677
State:
$5,372
(% of AGI for various income ranges: 2.4% for AGIs below $10k, 2.3% for AGIs $10k-25k, 5.5% for AGIs $25k-50k, 7.7% for AGIs $50k-75k, 11.1% for AGIs $75k-100k)
Earned income credit: $1,687 (reported on 31.1% of returns)
Here:
$1,687
State:
$1,662
Percentage of individuals using paid preparers for their 2004 taxes: 73.0%
Here:
73%
State:
55%
(% for various income ranges: 70.7% for AGIs below $10k, 79.1% for AGIs $10k-25k, 70.1% for AGIs $25k-50k, 86.5% for AGIs $50k-75k)
Household received Food Stamps/SNAP in the past 12 months: 224 Household did not receive Food Stamps/SNAP in the past 12 months: 146
Women who did not have a birth in the past 12 months: 98 (89 now married, 8 unmarried)
Housing units in zip code 25669 with a mortgage: 35 Median monthly owner costs for units with a mortgage: $1,033 Median monthly owner costs for units without a mortgage: $259
Residents with income below the poverty level in 2022:
This zip code:
34.5%
Whole state:
17.9%
Residents with income below 50% of the poverty level in 2022:
This zip code:
15.1%
Whole state:
9.7%
Median number of rooms in houses and condos:
Here:
5.5
State:
6.5
Median number of rooms in apartments:
Here:
6.5
State:
4.7
Notable locations in this zip code not listed on our city pages
Churches in zip code 25669 include: Walnut Grove Church (A), Thomas Copley Church (B), Bull Creek Church (C), Pine Grove Church (D). Display/hide their locations on the map
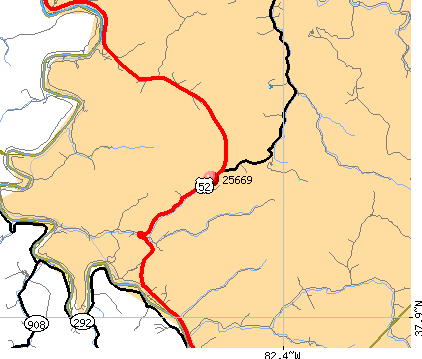
Streams, rivers, and creeks: Summer Fork (A), Silver Creek (B), Peters Branch (C), Laurel Branch (D), Jennie Creek (E), Hagerman Branch (F), Drag Creek (G), Coon Creek (H), Camp Creek (I). Display/hide their locations on the map
In group quarters: 2 (-1 institutionalized population)
Size of family households: 115 2-persons, 38 3-persons, 52 4-persons, 29 5-persons
Size of nonfamily households: 117 1-person
22 married couples with children.
0 single-parent households ().
99.4% of residents of 25669 zip code speak English at home.
Foreign born population: 2 (0.3%) (100.0% of them are naturalized citizens)
This zip code:
0.3%
Whole state:
1.8%
50%France
35%German
32%American
31%English
2%Dutch
Year of entry for the foreign-born population
02010 or later
22000 to 2009
01990 to 1999
0Before 1990
Facilities with environmental interests located in this zip code:
CRUM ELEMENTARY SCHOOL (150 SCHOOL STREET in CRUM, WV)
(National Center for Education Statistics) - STATE ID-89206 National Pollutant Discharge Elimination System NON-MAJOR (Tracking pollutant discharge elimination systems) - permit Business SIC classification: SEWERAGE SYSTEMS Organizations: WAYNE COUNTY SCHOOL DISTRICT (SCHOOL DISTRICT)
Alternative names: CRUM ELEMENTARY AND MIDDLE SCH, CRUM MIDDLE SCHOOL, WAYNE CNTY BD OF ED
A & L TRUCKING INC (RT 52 1 M SO OF CRUM in CRUM, WV)
Housing units lacking complete plumbing facilities: 8.8% Housing units lacking complete kitchen facilities: 8.4%
42.7%Electricity
41.3%Utility gas
16.3%Wood
Population in 1990: 763. Population change in the 1990s: +786 (+103.0%).
Place of birth for U.S.-born residents:
This state: 508
Northeast: 7
Midwest: 59
South: 303
West: 43
66% of the 25669 zip code residents lived in the same house 5 years ago. Out of people who lived in different houses, 59% lived in this county. Out of people who lived in different counties, 50% lived in West Virginia.
92% of the 25669 zip code residents lived in the same house 1 year ago. Out of people who lived in different houses, 19% moved from different county within same state. Out of people who lived in different houses, 87% moved from different state.
Private vs. public school enrollment:
Students in private schools in grades 1 to 8 (elementary and middle school):
Here:
0.0%
West Virginia:
12.2%
Occupation by median earnings in the past 12 months ($)
52,540Transportation occupations
21,793Healthcare support occupations
Top industries in this zip code by the number of employees in 2005:
Other Services (except Public Administration): General Automotive Repair (1-4 employees: 1 establishment)
Construction: New Single-Family Housing Construction (except Operative Builders) (1-4: 1)
Accommodation and Food Services: Full-Service Restaurants (1-4: 1)
Fatal accident statistics in 2011:
Fatal accident count: 1
Vehicles involved in fatal accidents: 2
Fatal accidents caused by drunken drivers: 1
Fatalities: 1
Persons involved in fatal accidents: 3
Pedestrians involved in fatal accidents: 0
Home Mortgage Disclosure Act Aggregated Statistics For Year 2009 (Based on 2 partial tracts)
B) Conventional Home Purchase Loans
C) Refinancings
D) Home Improvement Loans
F) Non-occupant Loans on < 5 Family Dwellings (A B C & D)
G) Loans On Manufactured Home Dwelling (A B C & D)
Number
Average Value
Number
Average Value
Number
Average Value
Number
Average Value
Number
Average Value
LOANS ORIGINATED
0
$0
7
$104,573
1
$13,050
1
$78,920
0
$0
APPLICATIONS APPROVED, NOT ACCEPTED
1
$60,900
1
$31,070
0
$0
0
$0
1
$60,900
APPLICATIONS DENIED
2
$48,470
1
$78,300
1
$15,530
1
$9,320
1
$67,110
APPLICATIONS WITHDRAWN
0
$0
1
$44,120
0
$0
0
$0
0
$0
FILES CLOSED FOR INCOMPLETENESS
0
$0
1
$45,980
0
$0
0
$0
0
$0
Aggregated Statistics For Year 2008 (Based on 2 partial tracts)
B) Conventional Home Purchase Loans
C) Refinancings
D) Home Improvement Loans
F) Non-occupant Loans on < 5 Family Dwellings (A B C & D)
G) Loans On Manufactured Home Dwelling (A B C & D)
Number
Average Value
Number
Average Value
Number
Average Value
Number
Average Value
Number
Average Value
LOANS ORIGINATED
2
$21,130
5
$65,992
1
$11,190
1
$57,790
1
$31,690
APPLICATIONS APPROVED, NOT ACCEPTED
5
$42,256
1
$19,260
1
$5,590
0
$0
5
$42,256
APPLICATIONS DENIED
1
$100,050
10
$128,133
2
$12,115
0
$0
2
$99,115
APPLICATIONS WITHDRAWN
0
$0
2
$262,230
0
$0
0
$0
0
$0
FILES CLOSED FOR INCOMPLETENESS
0
$0
0
$0
0
$0
0
$0
0
$0
Aggregated Statistics For Year 2007 (Based on 2 partial tracts)
B) Conventional Home Purchase Loans
C) Refinancings
D) Home Improvement Loans
F) Non-occupant Loans on < 5 Family Dwellings (A B C & D)
G) Loans On Manufactured Home Dwelling (A B C & D)
Number
Average Value
Number
Average Value
Number
Average Value
Number
Average Value
Number
Average Value
LOANS ORIGINATED
2
$33,865
6
$67,318
4
$40,080
2
$51,265
2
$33,865
APPLICATIONS APPROVED, NOT ACCEPTED
2
$54,370
1
$62,140
1
$54,680
1
$18,640
2
$54,370
APPLICATIONS DENIED
4
$34,488
7
$89,481
1
$12,430
1
$34,180
4
$53,595
APPLICATIONS WITHDRAWN
1
$42,260
1
$77,670
1
$105,640
2
$36,665
1
$42,260
FILES CLOSED FOR INCOMPLETENESS
0
$0
0
$0
0
$0
0
$0
0
$0
Aggregated Statistics For Year 2006 (Based on 2 partial tracts)
A) FHA, FSA/RHS & VA Home Purchase Loans
B) Conventional Home Purchase Loans
C) Refinancings
D) Home Improvement Loans
F) Non-occupant Loans on < 5 Family Dwellings (A B C & D)
G) Loans On Manufactured Home Dwelling (A B C & D)
Number
Average Value
Number
Average Value
Number
Average Value
Number
Average Value
Number
Average Value
Number
Average Value
LOANS ORIGINATED
1
$30,450
3
$41,633
5
$70,964
2
$49,710
0
$0
3
$45,157
APPLICATIONS APPROVED, NOT ACCEPTED
0
$0
2
$32,315
1
$16,160
1
$76,430
0
$0
2
$61,210
APPLICATIONS DENIED
1
$41,630
9
$56,548
7
$84,421
4
$54,218
1
$44,120
12
$55,771
APPLICATIONS WITHDRAWN
0
$0
2
$70,220
2
$190,460
0
$0
0
$0
1
$53,440
FILES CLOSED FOR INCOMPLETENESS
0
$0
0
$0
1
$55,930
0
$0
0
$0
0
$0
Aggregated Statistics For Year 2005 (Based on 2 partial tracts)
A) FHA, FSA/RHS & VA Home Purchase Loans
B) Conventional Home Purchase Loans
C) Refinancings
D) Home Improvement Loans
F) Non-occupant Loans on < 5 Family Dwellings (A B C & D)
G) Loans On Manufactured Home Dwelling (A B C & D)
Number
Average Value
Number
Average Value
Number
Average Value
Number
Average Value
Number
Average Value
Number
Average Value
LOANS ORIGINATED
1
$36,660
6
$56,443
10
$76,246
2
$15,535
2
$25,165
5
$32,188
APPLICATIONS APPROVED, NOT ACCEPTED
0
$0
3
$74,153
3
$48,883
0
$0
0
$0
3
$64,210
APPLICATIONS DENIED
0
$0
17
$57,461
7
$59,566
3
$28,790
0
$0
17
$48,762
APPLICATIONS WITHDRAWN
1
$84,510
1
$27,960
0
$0
0
$0
0
$0
1
$96,940
FILES CLOSED FOR INCOMPLETENESS
0
$0
0
$0
0
$0
0
$0
0
$0
0
$0
Aggregated Statistics For Year 2004 (Based on 2 partial tracts)
B) Conventional Home Purchase Loans
C) Refinancings
D) Home Improvement Loans
F) Non-occupant Loans on < 5 Family Dwellings (A B C & D)
G) Loans On Manufactured Home Dwelling (A B C & D)
Number
Average Value
Number
Average Value
Number
Average Value
Number
Average Value
Number
Average Value
LOANS ORIGINATED
6
$53,752
6
$61,725
2
$27,030
1
$65,870
5
$42,752
APPLICATIONS APPROVED, NOT ACCEPTED
1
$59,650
4
$77,985
1
$20,510
0
$0
2
$61,520
APPLICATIONS DENIED
14
$36,174
12
$73,118
11
$14,857
2
$11,495
17
$42,072
APPLICATIONS WITHDRAWN
2
$51,265
2
$154,730
1
$6,210
0
$0
1
$32,310
FILES CLOSED FOR INCOMPLETENESS
0
$0
0
$0
0
$0
0
$0
0
$0
Aggregated Statistics For Year 2003 (Based on 2 partial tracts)
A) FHA, FSA/RHS & VA Home Purchase Loans
B) Conventional Home Purchase Loans
C) Refinancings
D) Home Improvement Loans
F) Non-occupant Loans on < 5 Family Dwellings (A B C & D)
Number
Average Value
Number
Average Value
Number
Average Value
Number
Average Value
Number
Average Value
LOANS ORIGINATED
0
$0
7
$37,550
9
$50,886
7
$13,937
3
$47,020
APPLICATIONS APPROVED, NOT ACCEPTED
0
$0
5
$44,492
6
$50,643
1
$3,110
0
$0
APPLICATIONS DENIED
1
$16,160
17
$38,746
16
$58,140
4
$10,720
1
$42,260
APPLICATIONS WITHDRAWN
0
$0
1
$13,670
5
$65,744
0
$0
1
$18,640
FILES CLOSED FOR INCOMPLETENESS
0
$0
1
$49,710
1
$74,570
0
$0
0
$0
Aggregated Statistics For Year 2002 (Based on 2 partial tracts)
A) FHA, FSA/RHS & VA Home Purchase Loans
B) Conventional Home Purchase Loans
C) Refinancings
D) Home Improvement Loans
F) Non-occupant Loans on < 5 Family Dwellings (A B C & D)
Number
Average Value
Number
Average Value
Number
Average Value
Number
Average Value
Number
Average Value
LOANS ORIGINATED
1
$14,290
7
$39,859
12
$53,440
6
$6,525
3
$25,270
APPLICATIONS APPROVED, NOT ACCEPTED
0
$0
3
$30,450
2
$34,175
1
$8,080
0
$0
APPLICATIONS DENIED
0
$0
16
$39,187
23
$59,276
11
$7,400
0
$0
APPLICATIONS WITHDRAWN
0
$0
1
$30,450
6
$56,030
0
$0
0
$0
FILES CLOSED FOR INCOMPLETENESS
1
$36,660
1
$82,020
3
$82,647
0
$0
0
$0
Aggregated Statistics For Year 2001 (Based on 2 partial tracts)
A) FHA, FSA/RHS & VA Home Purchase Loans
B) Conventional Home Purchase Loans
C) Refinancings
D) Home Improvement Loans
F) Non-occupant Loans on < 5 Family Dwellings (A B C & D)
Number
Average Value
Number
Average Value
Number
Average Value
Number
Average Value
Number
Average Value
LOANS ORIGINATED
0
$0
12
$32,002
17
$53,879
4
$6,680
1
$13,050
APPLICATIONS APPROVED, NOT ACCEPTED
0
$0
5
$33,928
9
$39,770
1
$31,690
1
$7,460
APPLICATIONS DENIED
0
$0
40
$35,296
22
$55,502
10
$11,993
1
$34,800
APPLICATIONS WITHDRAWN
1
$39,770
2
$40,390
9
$50,196
2
$3,730
0
$0
FILES CLOSED FOR INCOMPLETENESS
0
$0
0
$0
4
$63,850
1
$16,780
0
$0
Aggregated Statistics For Year 2000 (Based on 2 partial tracts)
A) FHA, FSA/RHS & VA Home Purchase Loans
B) Conventional Home Purchase Loans
C) Refinancings
D) Home Improvement Loans
F) Non-occupant Loans on < 5 Family Dwellings (A B C & D)
Number
Average Value
Number
Average Value
Number
Average Value
Number
Average Value
Number
Average Value
LOANS ORIGINATED
1
$21,130
8
$29,516
12
$48,158
6
$9,010
1
$18,640
APPLICATIONS APPROVED, NOT ACCEPTED
0
$0
4
$41,322
9
$39,700
2
$11,495
1
$32,930
APPLICATIONS DENIED
0
$0
34
$31,655
21
$36,219
4
$6,370
4
$32,623
APPLICATIONS WITHDRAWN
1
$41,010
2
$36,350
9
$40,806
2
$20,815
0
$0
FILES CLOSED FOR INCOMPLETENESS
0
$0
1
$21,750
3
$44,120
0
$0
0
$0
Aggregated Statistics For Year 1999 (Based on 1 partial tract)
B) Conventional Home Purchase Loans
C) Refinancings
D) Home Improvement Loans
F) Non-occupant Loans on < 5 Family Dwellings (A B C & D)
Detailed HMDA statistics for the following Tracts:0210.00
Private Mortgage Insurance Companies Aggregated Statistics For Year 2000 (Based on 2 partial tracts)
B) Refinancings
Number
Average Value
LOANS ORIGINATED
0
$0
APPLICATIONS APPROVED, NOT ACCEPTED
0
$0
APPLICATIONS DENIED
1
$8,080
APPLICATIONS WITHDRAWN
0
$0
FILES CLOSED FOR INCOMPLETENESS
0
$0
Detailed PMIC statistics for the following Tracts:0210.00
2003 - 2018 National Fire Incident Reporting System (NFIRS) incidents
According to the data from the years 2003 - 2018 the average number of fire incidents per year is 11. The highest number of fire incidents - 24 took place in 2005, and the least - 5 in 2006. The data has a decreasing trend.
When looking into fire subcategories, the most incidents belonged to: Structure Fires (48.6%), and Mobile Property/Vehicle Fires (22.3%).
Fire incident types reported to NFIRS in Zip Code 25669

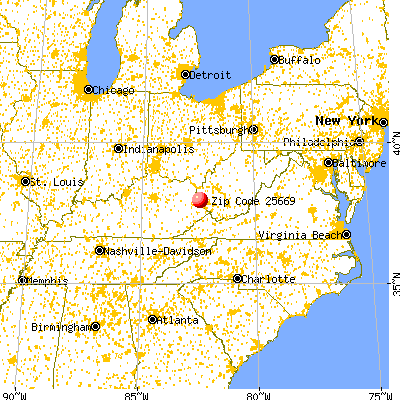


 Nearest zip codes: 25699, 41267, 25674, 41203, 41231, 25511.


 According to the data from the years 2003 - 2018 the average number of fire incidents per year is 11. The highest number of fire incidents - 24 took place in 2005, and the least - 5 in 2006. The data has a decreasing trend.
 When looking into fire subcategories, the most incidents belonged to: Structure Fires (48.6%), and Mobile Property/Vehicle Fires (22.3%).