Estimated zip code population in 2022: 2,554 Zip code population in 2010: 3,082 Zip code population in 2000: 3,247
Houses and condos: 1,431 Renter-occupied apartments: 222
% of renters here:
20%
State:
26%
March 2022 cost of living index in zip code 26059: 85.1 (less than average, U.S. average is 100)
Land area: 24.6 sq. mi. Water area: 0.1 sq. mi.
Population density: 104 people per square mile
(very low).
OSM Map
General Map
Google Map
MSN Map
OSM Map
General Map
Google Map
MSN Map
OSM Map
General Map
Google Map
MSN Map
OSM Map
General Map
Google Map
MSN Map
Please wait while loading the map...
Real estate property taxes paid for housing units in 2022:
This zip code:
0.6% ($808)
West Virginia:
0.5% ($821)
Median real estate property taxes paid for housing units with mortgages in 2022: $781 (0.5%) Median real estate property taxes paid for housing units with no mortgage in 2022: $828 (0.6%)
Estimated median house/condo value in 2022: $144,994
26059:
$144,994
West Virginia:
$155,100
According to our research of West Virginia and other state lists, there were 7 registered sex offenders living in 26059 zip code as of May 28, 2024. The ratio of all residents to sex offenders in zip code 26059 is 390 to 1. The ratio of registered sex offenders to all residents in this zip code is near the state average.
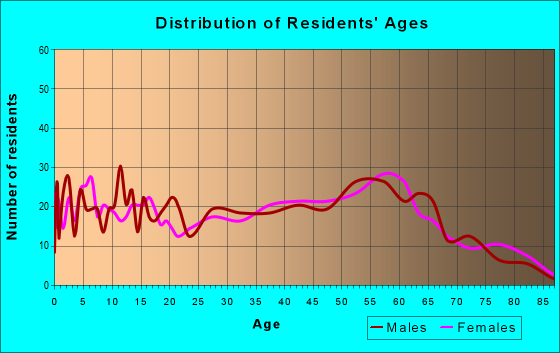
Median resident age:
This zip code:
49.6 years
West Virginia median age:
42.9 years
Average household size:
This zip code:
2.3 people
West Virginia:
2.3 people
Averages for the 2020 tax year for zip code 26059, filed in 2021:
Average Adjusted Gross Income (AGI) in 2020: $60,575 (Individual Income Tax Returns)
Here:
$60,575
State:
$56,292
Salary/wage: $50,017 (reported on 82.2% of returns)
Here:
$50,017
State:
$49,093
(% of AGI for various income ranges: 1208.9% for AGIs below $25k, 3315.0% for AGIs $25k-50k, 5861.8% for AGIs $50k-75k, 8920.9% for AGIs $75k-100k, 12996.7% for AGIs $100k-200k)
Taxable interest for individuals: $1,054 (reported on 26.1% of returns)
This zip code:
$1,054
West Virginia:
$1,141
(% of AGI for various income ranges: 9.7% for AGIs below $25k, 7.5% for AGIs $25k-50k, 44.1% for AGIs $50k-75k, 14.5% for AGIs $75k-100k, 74.0% for AGIs $100k-200k)
Ordinary dividends: $6,666 (reported on 18.5% of returns)
Here:
$6,666
State:
$5,456
(% of AGI for various income ranges: 42.2% for AGIs below $25k, 25.9% for AGIs $25k-50k, 66.5% for AGIs $50k-75k, 91.8% for AGIs $75k-100k, 500.7% for AGIs $100k-200k)
Net capital gain/loss in AGI: +$7,981 (reported on 16.6% of returns)
Here:
+$7,981
State:
+$11,656
(% of AGI for various income ranges: 7.2% for AGIs below $25k, 24.4% for AGIs $25k-50k, 116.5% for AGIs $50k-75k, 137.3% for AGIs $75k-100k, 299.3% for AGIs $100k-200k)
Profit/loss from business: +$17,729 (reported on 10.8% of returns)
Here:
+$17,729
State:
+$12,084
(% of AGI for various income ranges: 68.6% for AGIs below $25k, 121.6% for AGIs $25k-50k, 241.8% for AGIs $50k-75k, 544.0% for AGIs $100k-200k)
Taxable individual retirement arrangement distribution: $15,571 (reported on 8.9% of returns)
26059:
$15,571
West Virginia:
$15,311
(% of AGI for various income ranges: 39.7% for AGIs below $25k, 43.4% for AGIs $25k-50k, 259.4% for AGIs $50k-75k, 411.8% for AGIs $75k-100k, 669.3% for AGIs $100k-200k)
Total itemized deductions: $33,920 (reported on 3.2% of returns)
Here:
$33,920
State:
$31,950
(% of AGI for various income ranges: 1130.7% for AGIs $100k-200k)
Charity contributions: $11,500 (reported on 2.5% of returns)
Here:
$11,500
State:
$12,364
(% of AGI for various income ranges: 306.7% for AGIs $100k-200k)
Taxes paid: $7,980 (reported on 3.2% of returns)
26059:
$7,980
State:
$7,665
(% of AGI for various income ranges: 266.0% for AGIs $100k-200k)
Earned income credit: $2,433 (reported on 13.4% of returns)
Here:
$2,433
State:
$2,258
(% of AGI for various income ranges: 91.1% for AGIs below $25k, 57.2% for AGIs $25k-50k)
Percentage of individuals using paid preparers for their 2020 taxes: 94.9%
Here:
95%
State:
93%
(% for various income ranges: 94.1% for AGIs below $25k, 94.9% for AGIs $25k-50k, 95.8% for AGIs $50k-75k, 100.0% for AGIs $75k-100k, 95.2% for AGIs $100k-200k, 83.3% for AGIs over 200k)
Averages for the 2012 tax year for zip code 26059, filed in 2013:
Average Adjusted Gross Income (AGI) in 2012: $54,511 (Individual Income Tax Returns)
Here:
$54,511
State:
$48,628
Salary/wage: $43,287 (reported on 85.5% of returns)
Here:
$43,287
State:
$42,328
(% of AGI for various income ranges: 76.6% for AGIs below $25k, 79.7% for AGIs $25k-50k, 80.9% for AGIs $50k-75k, 74.2% for AGIs $75k-100k, 71.9% for AGIs $100k-200k, 33.3% for AGIs over 200k)
Taxable interest for individuals: $612 (reported on 34.2% of returns)
This zip code:
$612
West Virginia:
$1,211
(% of AGI for various income ranges: 0.9% for AGIs below $25k, 0.2% for AGIs $25k-50k, 0.4% for AGIs $50k-75k, 0.6% for AGIs $75k-100k, 0.2% for AGIs $100k-200k, 0.2% for AGIs over 200k)
Ordinary dividends: $6,154 (reported on 18.4% of returns)
Here:
$6,154
State:
$4,262
(% of AGI for various income ranges: 2.4% for AGIs below $25k, 1.1% for AGIs $25k-50k, 0.6% for AGIs $50k-75k, 2.0% for AGIs $75k-100k, 2.4% for AGIs $100k-200k, 3.6% for AGIs over 200k)
Net capital gain/loss in AGI: +$19,973 (reported on 14.5% of returns)
Here:
+$19,973
State:
+$8,875
(% of AGI for various income ranges: 1.0% for AGIs $50k-75k, 3.9% for AGIs $75k-100k, 4.1% for AGIs $100k-200k, 18.7% for AGIs over 200k)
Profit/loss from business: +$17,611 (reported on 11.8% of returns)
Here:
+$17,611
State:
+$13,636
(% of AGI for various income ranges: 5.9% for AGIs below $25k, 3.1% for AGIs $25k-50k, 1.1% for AGIs $50k-75k, 2.5% for AGIs $75k-100k, 9.0% for AGIs $100k-200k)
Taxable individual retirement arrangement distribution: $11,683 (reported on 7.9% of returns)
26059:
$11,683
West Virginia:
$11,787
(% of AGI for various income ranges: 1.6% for AGIs below $25k, 1.7% for AGIs $25k-50k, 3.7% for AGIs $50k-75k, 2.8% for AGIs $100k-200k)
Total itemized deductions: $20,219 (17% of AGI, reported on 21.1% of returns)
Here:
$20,219
State:
$21,148
Here:
16.7% of AGI
State:
18.1% of AGI
(% of AGI for various income ranges: 6.2% for AGIs $25k-50k, 6.7% for AGIs $50k-75k, 8.2% for AGIs $75k-100k, 12.1% for AGIs $100k-200k, 7.9% for AGIs over 200k)
Charity contributions: $4,004 (reported on 15.1% of returns)
Here:
$4,004
State:
$4,508
(% of AGI for various income ranges: 0.5% for AGIs $25k-50k, 0.6% for AGIs $50k-75k, 1.4% for AGIs $75k-100k, 1.7% for AGIs $100k-200k, 1.6% for AGIs over 200k)
Taxes paid: $8,012 (reported on 21.1% of returns)
26059:
$8,012
State:
$8,103
(% of AGI for various income ranges: 1.3% for AGIs $25k-50k, 2.0% for AGIs $50k-75k, 2.9% for AGIs $75k-100k, 5.3% for AGIs $100k-200k, 4.3% for AGIs over 200k)
Earned income credit: $2,318 (reported on 18.4% of returns)
Here:
$2,318
State:
$2,140
(% of AGI for various income ranges: 6.5% for AGIs below $25k, 1.1% for AGIs $25k-50k)
Percentage of individuals using paid preparers for their 2012 taxes: 50.7%
Here:
51%
State:
49%
(% for various income ranges: 43.5% for AGIs below $25k, 50.0% for AGIs $25k-50k, 52.4% for AGIs $50k-75k, 57.1% for AGIs $75k-100k, 66.7% for AGIs $100k-200k, 75.0% for AGIs over 200k)
Averages for the 2004 tax year for zip code 26059, filed in 2005:
Average Adjusted Gross Income (AGI) in 2004: $36,697 (Individual Income Tax Returns)
Here:
$36,697
State:
$37,498
Salary/wage: $32,722 (reported on 87.1% of returns)
Here:
$32,722
State:
$33,645
(% of AGI for various income ranges: 88.7% for AGIs below $10k, 78.4% for AGIs $10k-25k, 82.8% for AGIs $25k-50k, 86.5% for AGIs $50k-75k, 84.1% for AGIs $75k-100k, 59.7% for AGIs over 100k)
Taxable interest for individuals: $1,136 (reported on 39.8% of returns)
This zip code:
$1,136
West Virginia:
$1,465
(% of AGI for various income ranges: 3.7% for AGIs below $10k, 2.2% for AGIs $10k-25k, 1.2% for AGIs $25k-50k, 1.0% for AGIs $50k-75k, 1.0% for AGIs $75k-100k, 0.8% for AGIs over 100k)
Taxable dividends: $4,030 (reported on 20.4% of returns)
Here:
$4,030
State:
$2,913
(% of AGI for various income ranges: 2.8% for AGIs below $10k, 1.1% for AGIs $10k-25k, 1.3% for AGIs $25k-50k, 1.0% for AGIs $50k-75k, 1.7% for AGIs $75k-100k, 5.0% for AGIs over 100k)
Net capital gain/loss: +$3,094 (reported on 13.6% of returns)
Here:
+$3,094
State:
+$6,331
(% of AGI for various income ranges: -1.7% for AGIs below $10k, -0.5% for AGIs $10k-25k, 0.0% for AGIs $25k-50k, 0.8% for AGIs $50k-75k, 0.3% for AGIs $75k-100k, 4.0% for AGIs over 100k)
Profit/loss from business: +$9,911 (reported on 12.8% of returns)
Here:
+$9,911
State:
+$11,074
(% of AGI for various income ranges: 4.9% for AGIs below $10k, 4.5% for AGIs $10k-25k, 5.3% for AGIs $25k-50k, 2.8% for AGIs $50k-75k, 3.4% for AGIs over 100k)
IRA payment deduction: $2,854 (reported on 3.2% of returns)
26059:
$2,854
West Virginia:
$2,796
Total itemized deductions: $15,780 (18% of AGI, reported on 17.7% of returns)
Here:
$15,780
State:
$16,976
Here:
18.4% of AGI
State:
19.0% of AGI
(% of AGI for various income ranges: 3.8% for AGIs $10k-25k, 6.4% for AGIs $25k-50k, 6.3% for AGIs $50k-75k, 11.4% for AGIs $75k-100k, 10.7% for AGIs over 100k)
Charity contributions deductions: $2,578 (3% of AGI, reported on 14.9% of returns)
Here:
$2,578
State:
$3,529
Here:
2.8% of AGI
State:
3.7% of AGI
(% of AGI for various income ranges: 0.3% for AGIs $10k-25k, 0.6% for AGIs $25k-50k, 0.7% for AGIs $50k-75k, 1.5% for AGIs $75k-100k, 2.0% for AGIs over 100k)
Total tax: $5,147 (reported on 73.6% of returns)
26059:
$5,147
State:
$5,372
(% of AGI for various income ranges: 3.0% for AGIs below $10k, 4.1% for AGIs $10k-25k, 7.0% for AGIs $25k-50k, 8.9% for AGIs $50k-75k, 10.0% for AGIs $75k-100k, 18.8% for AGIs over 100k)
Earned income credit: $1,511 (reported on 18.5% of returns)
Here:
$1,511
State:
$1,662
Percentage of individuals using paid preparers for their 2004 taxes: 55.0%
Here:
55%
State:
55%
(% for various income ranges: 45.3% for AGIs below $10k, 55.0% for AGIs $10k-25k, 62.5% for AGIs $25k-50k, 54.2% for AGIs $50k-75k, 63.4% for AGIs $75k-100k, 58.3% for AGIs over 100k)
Churches in zip code 26059 include: Clinton Church (A), Dallas United Methodist Church (B), Triadelphia United Methodist Church (C). Display/hide their locations on the map
Streams, rivers, and creeks: Point Run (A), Orrs Run (B), Middle Wheeling Creek (C), McCoy Run (D), Marlow Run (E), Gashell Run (F), Dixon Run (G), Browns Run (H), Gillespie Run (I). Display/hide their locations on the map
Size of family households: 437 2-persons, 182 3-persons, 126 4-persons, 8 5-persons, 24 6-persons
Size of nonfamily households: 274 1-person, 47 2-persons, 1 4-persons
262 married couples with children.
131 single-parent households (12 men, 119 women).
98.6% of residents of 26059 zip code speak English at home.
0.7% of residents speak other Indo-European language at home (100% not well).
0.6% of residents speak other language at home (100% very well).
Foreign born population: 11 (0.5%) (100.0% of them are naturalized citizens)
This zip code:
0.5%
Whole state:
1.8%
25%German
17%English
15%American
8%Irish
7%Italian
5%Polish
2%Scotch-Irish
Year of entry for the foreign-born population
02010 or later
142000 to 2009
01990 to 1999
15Before 1990
Facilities with environmental interests located in this zip code:
APPROVAL AND CERTIFICATION CENTER (RR#1 BOX 251 in TRIADELPHIA, WV) . Federal Facility. DEPARTMENT OF LABOR
(Resource Conservation and Recovery Act (tracking hazardous waste)) Organizations: US DEPT OF LABOR - MSHA (CONTACT/OWNER)
CON-WAY FREIGHT-XWW (RD 2 BOX 165A in TRIADELPHIA, WV)
National Pollutant Discharge Elimination System NON-MAJOR (Tracking pollutant discharge elimination systems) - permit Business SIC classification: TRUCKING, EXCEPT LOCAL Organizations: CNF TRANSPORTATION INC (CONTACT/OWNER)
Alternative names: CNF TRANSPORTATION, INC., JUDGE JAMES SEIBERT
CRISWELL SERVICE CENTER (NATIONAL RD 2 MI N OF CITY in TRIADELPHIA, WV)
(Resource Conservation and Recovery Act (tracking hazardous waste)) Organizations: HARRY W CRISWELL (CONTACT/OWNER)
CROWS AUTO SALVAGE (RT 2 BOX 148 RT 40 in TRIADELPHIA, WV)
National Pollutant Discharge Elimination System NON-MAJOR (Tracking pollutant discharge elimination systems) - permit Business SIC classification: SCRAP AND WASTE MATERIALS
FRANKLIN WOODS SUBD. (RT 88 in TRIADELPHIA, WV)
National Pollutant Discharge Elimination System NON-MAJOR (Tracking pollutant discharge elimination systems) - permit Business SIC classification: SEWERAGE SYSTEMS Organizations: FRANKLIN WOODS HOMEOWNERS ASSO (CONTACT/OWNER)
Alternative names: FRANKLIN WOODS HOMEOWNERS ASSO
National Pollutant Discharge Elimination System NON-MAJOR (Tracking pollutant discharge elimination systems) - permit Business SIC classification: OPERATORS OF RESIDENTIAL MOBILE HOME SITES Alternative names: DALLAS PIKE CAMPGROUND LLC, HERMAR CORP
DALLAS PIKE INDUSTRIAL PARK (P.O. BOX 216, 411 NATIONAL ROAD in TRIADELPHIA, WV)
National Pollutant Discharge Elimination System NON-MAJOR (Tracking pollutant discharge elimination systems) - permit Business SIC classification: MANUFACTURING INDUSTRIES Alternative names: OHIO CNTY PSD
DAYS INN (I-70,DALLAS PIKE,EXIT 11 in TRIADELPHIA, WV)
National Pollutant Discharge Elimination System NON-MAJOR (Tracking pollutant discharge elimination systems) - permit Business SIC classification: HOTELS AND MOTELS Alternative names: GOKUL INC
ELM GROVE COLLISION CENTER INC (1 NATIONAL RD (REAR) in TRIADELPHIA, WV)
Conditionally Exempt Small Quantity Generators, less than 100 kg/month of hazardous waste (Resource Conservation and Recovery Act (tracking hazardous waste))
GARYS BODY SHOP (262 NATIONAL RD in TRIADELPHIA, WV)
Small Quantity Generators, between 100 kg and 1000 kg of hazardous waste/month (Resource Conservation and Recovery Act (tracking hazardous waste)) - notification Organizations: OPERNAME (CONTACT/OPERATOR)
, BITZER, GARY (CONTACT/OWNER)
AMERICAS TRUCK WASH (EXIT 11 I 70 in TRIADELPHIA, WV)
Conditionally Exempt Small Quantity Generators, less than 100 kg/month of hazardous waste (Resource Conservation and Recovery Act (tracking hazardous waste)) Organizations: OPERNAME (CONTACT/OPERATOR)
Housing units lacking complete plumbing facilities: 8.7% Housing units lacking complete kitchen facilities: 8.5%
51.3%Electricity
39.7%Utility gas
3.4%Fuel oil, kerosene, etc.
3.2%Wood
2.7%Bottled, tank, or LP gas
Population in 1990: 2,320. Population change in the 1990s: +927 (+40.0%).
Place of birth for U.S.-born residents:
This state: 1,854
Northeast: 359
Midwest: 206
South: 72
West: 7
68% of the 26059 zip code residents lived in the same house 5 years ago. Out of people who lived in different houses, 68% lived in this county. Out of people who lived in different counties, 50% lived in West Virginia.
91% of the 26059 zip code residents lived in the same house 1 year ago. Out of people who lived in different houses, 11% moved from this county. Out of people who lived in different houses, 63% moved from different county within same state. Out of people who lived in different houses, 29% moved from different state.
Private vs. public school enrollment:
Students in private schools in grades 1 to 8 (elementary and middle school): 78
Here:
38.5%
West Virginia:
12.2%
Students in private schools in grades 9 to 12 (high school): 41
Here:
27.4%
West Virginia:
8.8%
Students in private undergraduate colleges:
Here:
0.0%
West Virginia:
17.3%
Occupation by median earnings in the past 12 months ($)
150,292Health diagnosing and treating practitioners and other technical occupations
110,837Installation, maintenance, and repair occupations
70,909Management occupations
70,105Architecture and engineering occupations
58,596Construction and extraction occupations
56,017Sales and related occupations
Companies with federal contracts located in this zip code:
TOUCHSTONE RESEARCH LABORATORY (RR 1 BOX 100B in TRIADELPHIA, WV; small business) : $34,254,761 in 85 contractsfrom 1999 to 2006
Contracts for Defense Missile and Space Systems -- Advanced Development (R&D), Other Defense -- Management and Support (R&D), Other Sciences Not Elsewhere Classified -- Applied Research and Exploratory Development (R&D), Defense Missile and Space Systems -- Management and Support (R&D), and moreby Army, Air Force, Navy, Missile Defense Agency, and others Signed by year:2000: $1,415,095; 2001: $5,376,344; 2002: $5,778,112; 2003: $5,369,674; 2004: $5,768,886; 2005: $9,417,054; 2006: $614,619.
Biggest contracts:
$3,611,662 with Army for Defense Missile and Space Systems -- Advanced Development (R&D). Signed on 2005-09-24. Completion date: 2006-08-02.
$3,510,000 with Air Force for Other Defense -- Management and Support (R&D). Signed on 2001-03-30. Completion date: 2002-02-28.
$2,580,905 with Navy for Other Sciences Not Elsewhere Classified -- Applied Research and Exploratory Development (R&D). Signed on 2002-02-27. Completion date: 2004-02-26.
$2,499,997 with Army for Defense Missile and Space Systems -- Advanced Development (R&D). Signed on 2005-03-03. Completion date: 2006-08-02.
Top industries in this zip code by the number of employees in 2005:
Administrative and Support and Waste Management and Remediation Services: Temporary Help Services (100-249 employees: 1 establishment)
Professional, Scientific, and Technical Services: Research and Development in the Physical, Engineering, and Life Sciences (50-99: 1)
Wholesale Trade: Industrial and Personal Service Paper Merchant Wholesalers (50-99: 1)
Accommodation and Food Services: Hotels (except Casino Hotels) and Motels (20-49: 1, 10-19: 1)
Real Estate and Rental and Leasing: Home Health Equipment Rental (20-49: 1, 10-19: 1)
Other Services (except Public Administration): Car Washes (20-49: 1)
People in group quarters in 2000:
49 people in religious group quarters
6 people in other nonhousehold living situations
Fatal accident statistics in 2013:
Fatal accident count: 1
Vehicles involved in fatal accidents: 2
Fatal accidents caused by drunken drivers: 0
Fatalities: 1
Persons involved in fatal accidents: 3
Pedestrians involved in fatal accidents: 0
Fatal accident statistics in 2012:
Fatal accident count: 1
Vehicles involved in fatal accidents: 2
Fatal accidents caused by drunken drivers: 1
Fatalities: 1
Persons involved in fatal accidents: 4
Pedestrians involved in fatal accidents: 0
Home Mortgage Disclosure Act Aggregated Statistics For Year 2009 (Based on 4 partial tracts)
A) FHA, FSA/RHS & VA Home Purchase Loans
B) Conventional Home Purchase Loans
C) Refinancings
D) Home Improvement Loans
E) Loans on Dwellings For 5+ Families
F) Non-occupant Loans on < 5 Family Dwellings (A B C & D)
G) Loans On Manufactured Home Dwelling (A B C & D)
Number
Average Value
Number
Average Value
Number
Average Value
Number
Average Value
Number
Average Value
Number
Average Value
Number
Average Value
LOANS ORIGINATED
5
$107,120
7
$146,120
41
$134,559
9
$79,384
1
$96,160
5
$45,096
2
$91,860
APPLICATIONS APPROVED, NOT ACCEPTED
0
$0
1
$60,810
3
$111,370
2
$98,075
0
$0
0
$0
0
$0
APPLICATIONS DENIED
1
$68,810
4
$112,780
18
$142,821
5
$12,630
0
$0
1
$12,270
3
$101,340
APPLICATIONS WITHDRAWN
1
$59,740
2
$331,135
8
$147,951
0
$0
1
$14,400
1
$27,740
0
$0
FILES CLOSED FOR INCOMPLETENESS
0
$0
0
$0
2
$38,405
0
$0
0
$0
0
$0
0
$0
Aggregated Statistics For Year 2008 (Based on 4 partial tracts)
A) FHA, FSA/RHS & VA Home Purchase Loans
B) Conventional Home Purchase Loans
C) Refinancings
D) Home Improvement Loans
F) Non-occupant Loans on < 5 Family Dwellings (A B C & D)
G) Loans On Manufactured Home Dwelling (A B C & D)
Number
Average Value
Number
Average Value
Number
Average Value
Number
Average Value
Number
Average Value
Number
Average Value
LOANS ORIGINATED
2
$79,210
17
$118,534
38
$117,410
13
$31,948
6
$98,555
7
$38,861
APPLICATIONS APPROVED, NOT ACCEPTED
1
$28,800
2
$121,805
3
$32,580
1
$16,000
0
$0
1
$33,450
APPLICATIONS DENIED
0
$0
6
$56,147
16
$141,974
10
$58,678
0
$0
3
$30,980
APPLICATIONS WITHDRAWN
0
$0
1
$59,210
8
$125,181
2
$125,745
1
$38,400
0
$0
FILES CLOSED FOR INCOMPLETENESS
1
$95,500
1
$102,410
2
$114,715
0
$0
0
$0
0
$0
Aggregated Statistics For Year 2007 (Based on 4 partial tracts)
A) FHA, FSA/RHS & VA Home Purchase Loans
B) Conventional Home Purchase Loans
C) Refinancings
D) Home Improvement Loans
E) Loans on Dwellings For 5+ Families
F) Non-occupant Loans on < 5 Family Dwellings (A B C & D)
G) Loans On Manufactured Home Dwelling (A B C & D)
Number
Average Value
Number
Average Value
Number
Average Value
Number
Average Value
Number
Average Value
Number
Average Value
Number
Average Value
LOANS ORIGINATED
1
$33,600
31
$123,198
29
$97,613
12
$86,902
2
$287,235
4
$81,592
6
$47,210
APPLICATIONS APPROVED, NOT ACCEPTED
0
$0
3
$65,827
7
$110,336
1
$26,670
0
$0
0
$0
1
$25,600
APPLICATIONS DENIED
1
$33,070
7
$78,653
19
$109,117
8
$27,866
0
$0
1
$112,550
5
$67,824
APPLICATIONS WITHDRAWN
0
$0
1
$197,830
5
$172,972
1
$36,910
0
$0
1
$16,000
0
$0
FILES CLOSED FOR INCOMPLETENESS
0
$0
0
$0
2
$55,205
1
$122,680
0
$0
0
$0
0
$0
Aggregated Statistics For Year 2006 (Based on 4 partial tracts)
A) FHA, FSA/RHS & VA Home Purchase Loans
B) Conventional Home Purchase Loans
C) Refinancings
D) Home Improvement Loans
F) Non-occupant Loans on < 5 Family Dwellings (A B C & D)
G) Loans On Manufactured Home Dwelling (A B C & D)
Number
Average Value
Number
Average Value
Number
Average Value
Number
Average Value
Number
Average Value
Number
Average Value
LOANS ORIGINATED
2
$97,415
26
$98,611
28
$105,962
10
$32,024
6
$100,878
4
$57,112
APPLICATIONS APPROVED, NOT ACCEPTED
0
$0
1
$89,020
3
$161,180
1
$198,420
0
$0
1
$54,350
APPLICATIONS DENIED
2
$65,640
3
$65,430
22
$89,715
11
$18,076
2
$91,480
5
$49,588
APPLICATIONS WITHDRAWN
1
$32,000
5
$87,190
5
$106,988
2
$125,430
2
$67,740
1
$71,080
FILES CLOSED FOR INCOMPLETENESS
0
$0
1
$30,940
2
$132,420
1
$26,670
0
$0
0
$0
Aggregated Statistics For Year 2005 (Based on 4 partial tracts)
A) FHA, FSA/RHS & VA Home Purchase Loans
B) Conventional Home Purchase Loans
C) Refinancings
D) Home Improvement Loans
E) Loans on Dwellings For 5+ Families
F) Non-occupant Loans on < 5 Family Dwellings (A B C & D)
G) Loans On Manufactured Home Dwelling (A B C & D)
Number
Average Value
Number
Average Value
Number
Average Value
Number
Average Value
Number
Average Value
Number
Average Value
Number
Average Value
LOANS ORIGINATED
3
$91,220
19
$133,184
32
$91,065
24
$49,926
1
$461,200
5
$93,362
3
$30,083
APPLICATIONS APPROVED, NOT ACCEPTED
1
$22,580
4
$77,955
7
$79,721
2
$45,030
0
$0
1
$4,180
4
$42,382
APPLICATIONS DENIED
0
$0
11
$82,406
18
$81,829
10
$38,189
0
$0
0
$0
7
$53,976
APPLICATIONS WITHDRAWN
0
$0
2
$73,920
5
$95,758
4
$77,278
0
$0
0
$0
2
$41,115
FILES CLOSED FOR INCOMPLETENESS
0
$0
0
$0
1
$92,970
0
$0
0
$0
0
$0
0
$0
Aggregated Statistics For Year 2004 (Based on 4 partial tracts)
B) Conventional Home Purchase Loans
C) Refinancings
D) Home Improvement Loans
E) Loans on Dwellings For 5+ Families
F) Non-occupant Loans on < 5 Family Dwellings (A B C & D)
G) Loans On Manufactured Home Dwelling (A B C & D)
Number
Average Value
Number
Average Value
Number
Average Value
Number
Average Value
Number
Average Value
Number
Average Value
LOANS ORIGINATED
24
$121,868
34
$83,930
14
$31,085
1
$36,800
5
$169,588
4
$56,142
APPLICATIONS APPROVED, NOT ACCEPTED
2
$88,635
6
$73,678
0
$0
0
$0
0
$0
2
$52,620
APPLICATIONS DENIED
6
$88,300
22
$82,388
4
$22,490
0
$0
1
$53,340
2
$30,405
APPLICATIONS WITHDRAWN
3
$69,497
6
$87,350
1
$53,340
0
$0
0
$0
1
$32,000
FILES CLOSED FOR INCOMPLETENESS
0
$0
0
$0
1
$25,090
0
$0
0
$0
0
$0
Aggregated Statistics For Year 2003 (Based on 4 partial tracts)
A) FHA, FSA/RHS & VA Home Purchase Loans
B) Conventional Home Purchase Loans
C) Refinancings
D) Home Improvement Loans
F) Non-occupant Loans on < 5 Family Dwellings (A B C & D)
Number
Average Value
Number
Average Value
Number
Average Value
Number
Average Value
Number
Average Value
LOANS ORIGINATED
0
$0
31
$95,542
78
$92,188
13
$23,385
7
$57,970
APPLICATIONS APPROVED, NOT ACCEPTED
0
$0
5
$118,434
11
$83,140
0
$0
1
$63,550
APPLICATIONS DENIED
1
$96,310
5
$90,924
25
$86,239
2
$19,390
2
$24,270
APPLICATIONS WITHDRAWN
0
$0
2
$142,530
7
$82,390
2
$18,860
0
$0
FILES CLOSED FOR INCOMPLETENESS
1
$65,680
0
$0
2
$75,375
0
$0
0
$0
Aggregated Statistics For Year 2002 (Based on 4 partial tracts)
A) FHA, FSA/RHS & VA Home Purchase Loans
B) Conventional Home Purchase Loans
C) Refinancings
D) Home Improvement Loans
F) Non-occupant Loans on < 5 Family Dwellings (A B C & D)
Number
Average Value
Number
Average Value
Number
Average Value
Number
Average Value
Number
Average Value
LOANS ORIGINATED
1
$72,540
17
$63,647
53
$83,463
11
$18,678
4
$48,698
APPLICATIONS APPROVED, NOT ACCEPTED
0
$0
2
$97,790
4
$50,620
0
$0
0
$0
APPLICATIONS DENIED
0
$0
4
$59,472
16
$76,674
9
$10,524
1
$27,800
APPLICATIONS WITHDRAWN
0
$0
1
$104,530
6
$71,177
2
$2,090
0
$0
FILES CLOSED FOR INCOMPLETENESS
0
$0
0
$0
3
$94,970
1
$12,540
1
$12,540
Aggregated Statistics For Year 2001 (Based on 4 partial tracts)
A) FHA, FSA/RHS & VA Home Purchase Loans
B) Conventional Home Purchase Loans
C) Refinancings
D) Home Improvement Loans
F) Non-occupant Loans on < 5 Family Dwellings (A B C & D)
Number
Average Value
Number
Average Value
Number
Average Value
Number
Average Value
Number
Average Value
LOANS ORIGINATED
1
$34,640
28
$73,203
50
$75,656
10
$18,137
7
$54,816
APPLICATIONS APPROVED, NOT ACCEPTED
0
$0
3
$49,953
5
$41,914
1
$33,090
0
$0
APPLICATIONS DENIED
0
$0
7
$65,003
13
$68,069
3
$14,757
2
$35,150
APPLICATIONS WITHDRAWN
0
$0
3
$87,207
4
$48,240
1
$18,040
1
$66,900
FILES CLOSED FOR INCOMPLETENESS
0
$0
0
$0
2
$76,365
0
$0
0
$0
Aggregated Statistics For Year 2000 (Based on 4 partial tracts)
A) FHA, FSA/RHS & VA Home Purchase Loans
B) Conventional Home Purchase Loans
C) Refinancings
D) Home Improvement Loans
F) Non-occupant Loans on < 5 Family Dwellings (A B C & D)
Number
Average Value
Number
Average Value
Number
Average Value
Number
Average Value
Number
Average Value
LOANS ORIGINATED
1
$41,540
25
$69,825
15
$70,444
16
$9,324
5
$48,316
APPLICATIONS APPROVED, NOT ACCEPTED
0
$0
6
$48,742
3
$70,230
2
$16,765
0
$0
APPLICATIONS DENIED
0
$0
13
$43,421
15
$47,043
8
$6,386
1
$8,530
APPLICATIONS WITHDRAWN
0
$0
2
$46,210
3
$42,673
1
$9,600
1
$27,740
FILES CLOSED FOR INCOMPLETENESS
1
$33,600
0
$0
0
$0
0
$0
0
$0
Aggregated Statistics For Year 1999 (Based on 2 partial tracts)
A) FHA, FSA/RHS & VA Home Purchase Loans
B) Conventional Home Purchase Loans
C) Refinancings
D) Home Improvement Loans
F) Non-occupant Loans on < 5 Family Dwellings (A B C & D)
Detailed PMIC statistics for the following Tracts:0021.00
, 0022.00
2003 - 2018 National Fire Incident Reporting System (NFIRS) incidents
According to the data from the years 2003 - 2018 the average number of fires per year is 21. The highest number of fire incidents - 50 took place in 2018, and the least - 11 in 2012. The data has a rising trend.
When looking into fire subcategories, the most reports belonged to: Mobile Property/Vehicle Fires (35.0%), and Structure Fires (32.3%).
Fire incident types reported to NFIRS in Zip Code 26059


 Nearest zip codes: 26003, 26060, 26036, 26074, 26040, 26031.


 . Federal Facility. DEPARTMENT OF LABOR


 According to the data from the years 2003 - 2018 the average number of fires per year is 21. The highest number of fire incidents - 50 took place in 2018, and the least - 11 in 2012. The data has a rising trend.
 When looking into fire subcategories, the most reports belonged to: Mobile Property/Vehicle Fires (35.0%), and Structure Fires (32.3%).