Estimated zip code population in 2022: 2,446 Zip code population in 2010: 2,361 Zip code population in 2000: 2,054
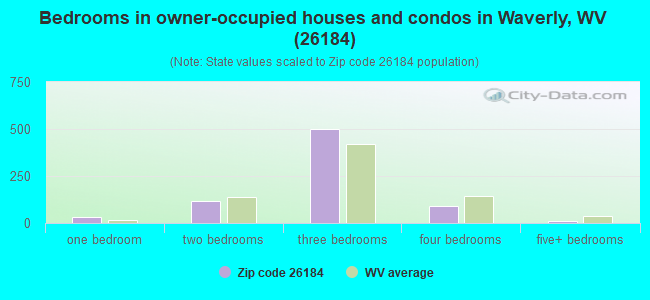
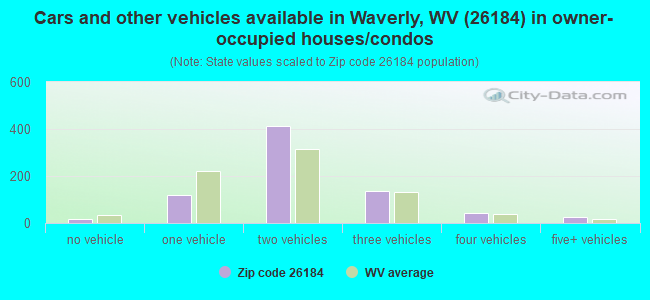
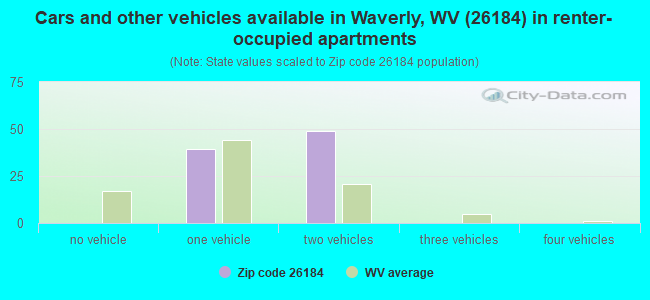
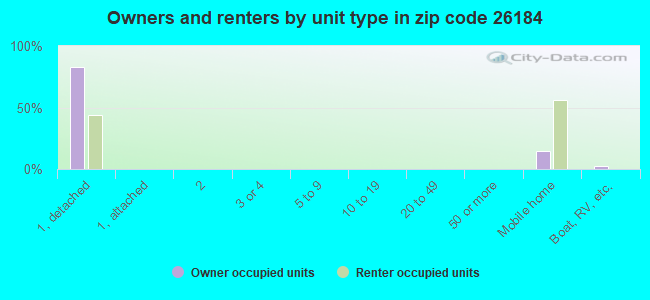
Houses and condos: 975 Renter-occupied apartments: 88
% of renters here:
10%
State:
26%
March 2022 cost of living index in zip code 26184: 82.0 (low, U.S. average is 100)
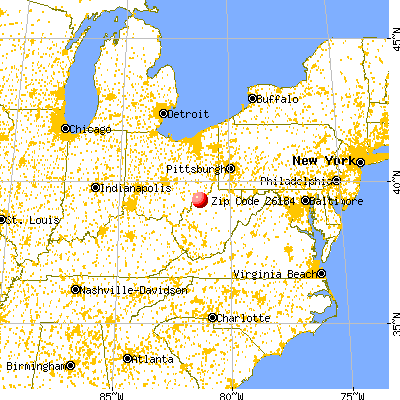
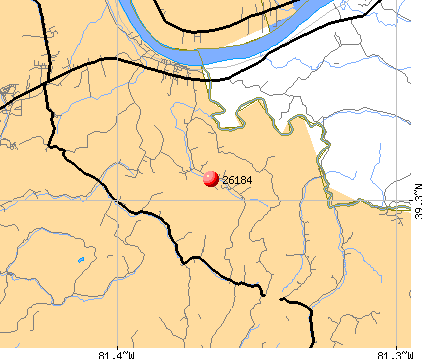
Land area: 38.9 sq. mi. Water area: 0.1 sq. mi.
Population density: 63 people per square mile
(very low).
OSM Map
General Map
Google Map
MSN Map
OSM Map
General Map
Google Map
MSN Map
OSM Map
General Map
Google Map
MSN Map
OSM Map
General Map
Google Map
MSN Map
Please wait while loading the map...
Real estate property taxes paid for housing units in 2022:
This zip code:
0.5% ($836)
West Virginia:
0.5% ($821)
Median real estate property taxes paid for housing units with mortgages in 2022: $1,262 (0.6%) Median real estate property taxes paid for housing units with no mortgage in 2022: $593 (0.4%)
Business Search- 14 Million verified businesses
Males: 1,292
(52.8%)
Females: 1,153
(47.2%)
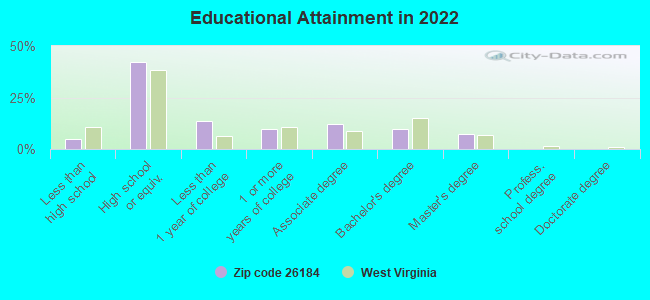
For population 25 years and over in 26184:
High school or higher: 95.9%
Bachelor's degree or higher: 17.0%
Graduate or professional degree: 7.3%
Unemployed: 2.3%
Mean travel time to work (commute): 26.7 minutes
For population 15 years and over in 26184:
Never married: 24.2%
Now married: 59.5%
Separated: 0.2%
Widowed: 10.4%
Divorced: 5.7%
Zip code 26184 compared to state average:
Unemployed percentage below state average.
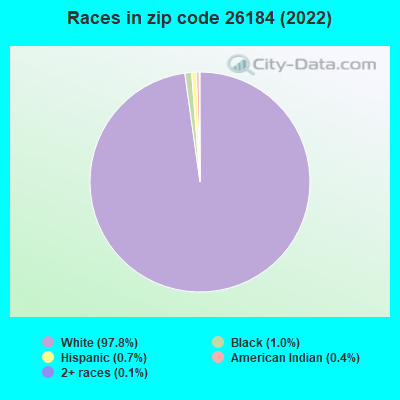
Black race population percentage significantly below state average.
Hispanic race population percentage below state average.
Median age below state average.
Foreign-born population percentage below state average.
Renting percentage significantly below state average.
House age below state average.
Percentage of population with a bachelor's degree or higher below state average.
Estimated median house/condo value in 2022: $176,801
26184:
$176,801
West Virginia:
$155,100
According to our research of West Virginia and other state lists, there were 6 registered sex offenders living in 26184 zip code as of May 28, 2024. The ratio of all residents to sex offenders in zip code 26184 is 328 to 1. The ratio of registered sex offenders to all residents in this zip code is near the state average.
Median resident age:
This zip code:
38.2 years
West Virginia median age:
42.9 years
Average household size:
This zip code:
2.7 people
West Virginia:
2.3 people
Averages for the 2020 tax year for zip code 26184, filed in 2021:
Average Adjusted Gross Income (AGI) in 2020: $56,243 (Individual Income Tax Returns)
Here:
$56,243
State:
$56,292
Salary/wage: $47,885 (reported on 80.6% of returns)
Here:
$47,885
State:
$49,093
(% of AGI for various income ranges: 1039.6% for AGIs below $25k, 3192.0% for AGIs $25k-50k, 5841.7% for AGIs $50k-75k, 8235.0% for AGIs $75k-100k, 19190.0% for AGIs $100k-200k)
Taxable interest for individuals: $625 (reported on 32.7% of returns)
This zip code:
$625
West Virginia:
$1,141
(% of AGI for various income ranges: 10.8% for AGIs below $25k, 19.0% for AGIs $25k-50k, 28.3% for AGIs $50k-75k, 20.0% for AGIs $75k-100k, 107.5% for AGIs $100k-200k)
Ordinary dividends: $1,377 (reported on 13.3% of returns)
Here:
$1,377
State:
$5,456
(% of AGI for various income ranges: 7.1% for AGIs below $25k, 12.5% for AGIs $25k-50k, 56.7% for AGIs $50k-75k, 86.2% for AGIs $100k-200k)
Net capital gain/loss in AGI: +$5,092 (reported on 12.2% of returns)
Here:
+$5,092
State:
+$11,656
(% of AGI for various income ranges: 50.5% for AGIs $25k-50k, 116.7% for AGIs $50k-75k, 462.5% for AGIs $100k-200k)
Profit/loss from business: +$19,145 (reported on 11.2% of returns)
Here:
+$19,145
State:
+$12,084
(% of AGI for various income ranges: 113.3% for AGIs below $25k, 292.5% for AGIs $50k-75k, 1853.8% for AGIs $100k-200k)
Taxable individual retirement arrangement distribution: $17,222 (reported on 9.2% of returns)
26184:
$17,222
West Virginia:
$15,311
(% of AGI for various income ranges: 156.7% for AGIs below $25k, 368.3% for AGIs $50k-75k, 915.0% for AGIs $75k-100k)
Total itemized deductions: $33,400 (reported on 2.0% of returns)
Here:
$33,400
State:
$31,950
(% of AGI for various income ranges: 835.0% for AGIs $75k-100k)
Taxes paid: $9,200 (reported on 2.0% of returns)
26184:
$9,200
State:
$7,665
(% of AGI for various income ranges: 230.0% for AGIs $75k-100k)
Earned income credit: $2,240 (reported on 15.3% of returns)
Here:
$2,240
State:
$2,258
(% of AGI for various income ranges: 90.8% for AGIs below $25k, 59.0% for AGIs $25k-50k)
Percentage of individuals using paid preparers for their 2020 taxes: 93.9%
Here:
94%
State:
93%
(% for various income ranges: 97.0% for AGIs below $25k, 92.0% for AGIs $25k-50k, 93.8% for AGIs $50k-75k, 90.0% for AGIs $75k-100k, 92.9% for AGIs $100k-200k)
Averages for the 2012 tax year for zip code 26184, filed in 2013:
Average Adjusted Gross Income (AGI) in 2012: $46,604 (Individual Income Tax Returns)
Here:
$46,604
State:
$48,628
Salary/wage: $40,910 (reported on 84.3% of returns)
Here:
$40,910
State:
$42,328
(% of AGI for various income ranges: 73.3% for AGIs below $25k, 74.5% for AGIs $25k-50k, 78.3% for AGIs $50k-75k, 76.8% for AGIs $75k-100k, 69.1% for AGIs $100k-200k)
Taxable interest for individuals: $739 (reported on 32.4% of returns)
This zip code:
$739
West Virginia:
$1,211
(% of AGI for various income ranges: 0.6% for AGIs below $25k, 0.6% for AGIs $25k-50k, 0.9% for AGIs $50k-75k, 0.2% for AGIs $75k-100k, 0.3% for AGIs $100k-200k)
Ordinary dividends: $1,033 (reported on 11.8% of returns)
Here:
$1,033
State:
$4,262
(% of AGI for various income ranges: 0.3% for AGIs below $25k, 0.2% for AGIs $25k-50k, 0.2% for AGIs $50k-75k, 0.3% for AGIs $75k-100k, 0.3% for AGIs $100k-200k)
Net capital gain/loss in AGI: +$1,500 (reported on 7.8% of returns)
Here:
+$1,500
State:
+$8,875
(% of AGI for various income ranges: 1.6% for AGIs $75k-100k)
Profit/loss from business: +$7,673 (reported on 10.8% of returns)
Here:
+$7,673
State:
+$13,636
(% of AGI for various income ranges: 3.0% for AGIs below $25k, 5.3% for AGIs $25k-50k, 2.3% for AGIs $75k-100k)
Taxable individual retirement arrangement distribution: $14,356 (reported on 8.8% of returns)
26184:
$14,356
West Virginia:
$11,787
(% of AGI for various income ranges: 5.7% for AGIs below $25k, 2.7% for AGIs $50k-75k, 8.4% for AGIs $75k-100k)
Total itemized deductions: $17,511 (19% of AGI, reported on 18.6% of returns)
Here:
$17,511
State:
$21,148
Here:
19.0% of AGI
State:
18.1% of AGI
(% of AGI for various income ranges: 7.7% for AGIs $25k-50k, 5.5% for AGIs $50k-75k, 6.3% for AGIs $75k-100k, 10.7% for AGIs $100k-200k)
Charity contributions: $4,000 (reported on 10.8% of returns)
Here:
$4,000
State:
$4,508
(% of AGI for various income ranges: 1.1% for AGIs below $25k, 1.9% for AGIs $50k-75k, 1.2% for AGIs $100k-200k)
Taxes paid: $6,126 (reported on 18.6% of returns)
26184:
$6,126
State:
$8,103
(% of AGI for various income ranges: 1.3% for AGIs $25k-50k, 1.3% for AGIs $50k-75k, 1.8% for AGIs $75k-100k, 5.3% for AGIs $100k-200k)
Earned income credit: $2,216 (reported on 18.6% of returns)
Here:
$2,216
State:
$2,140
(% of AGI for various income ranges: 6.1% for AGIs below $25k, 1.1% for AGIs $25k-50k)
Percentage of individuals using paid preparers for their 2012 taxes: 52.0%
Here:
52%
State:
49%
(% for various income ranges: 46.3% for AGIs below $25k, 52.0% for AGIs $25k-50k, 52.9% for AGIs $50k-75k, 60.0% for AGIs $75k-100k, 66.7% for AGIs $100k-200k)
Averages for the 2004 tax year for zip code 26184, filed in 2005:
Average Adjusted Gross Income (AGI) in 2004: $35,603 (Individual Income Tax Returns)
Here:
$35,603
State:
$37,498
Salary/wage: $33,840 (reported on 88.7% of returns)
Here:
$33,840
State:
$33,645
(% of AGI for various income ranges: 107.7% for AGIs below $10k, 73.5% for AGIs $10k-25k, 84.9% for AGIs $25k-50k, 85.6% for AGIs $50k-75k, 90.7% for AGIs $75k-100k, 80.3% for AGIs over 100k)
Taxable interest for individuals: $707 (reported on 37.9% of returns)
This zip code:
$707
West Virginia:
$1,465
(% of AGI for various income ranges: 1.7% for AGIs below $10k, 2.4% for AGIs $10k-25k, 0.5% for AGIs $25k-50k, 0.5% for AGIs $50k-75k, 0.2% for AGIs $75k-100k, 0.4% for AGIs over 100k)
Taxable dividends: $558 (reported on 13.5% of returns)
Here:
$558
State:
$2,913
(% of AGI for various income ranges: 0.3% for AGIs below $10k, 0.1% for AGIs $10k-25k, 0.2% for AGIs $25k-50k, 0.3% for AGIs $50k-75k, 0.1% for AGIs $75k-100k, 0.2% for AGIs over 100k)
Net capital gain/loss: +$892 (reported on 9.7% of returns)
Here:
+$892
State:
+$6,331
(% of AGI for various income ranges: 0.3% for AGIs $10k-25k, 0.1% for AGIs $25k-50k, 0.6% for AGIs $50k-75k, 0.1% for AGIs over 100k)
Profit/loss from business: +$4,949 (reported on 10.3% of returns)
Here:
+$4,949
State:
+$11,074
(% of AGI for various income ranges: -8.5% for AGIs below $10k, 2.7% for AGIs $10k-25k, 2.2% for AGIs $25k-50k, -0.3% for AGIs $50k-75k, 5.1% for AGIs $75k-100k)
IRA payment deduction: $3,353 (reported on 1.8% of returns)
26184:
$3,353
West Virginia:
$2,796
Total itemized deductions: $15,055 (20% of AGI, reported on 17.3% of returns)
Here:
$15,055
State:
$16,976
Here:
19.8% of AGI
State:
19.0% of AGI
(% of AGI for various income ranges: 6.9% for AGIs $25k-50k, 6.7% for AGIs $50k-75k, 12.1% for AGIs $75k-100k, 12.0% for AGIs over 100k)
Charity contributions deductions: $2,383 (3% of AGI, reported on 13.9% of returns)
Here:
$2,383
State:
$3,529
Here:
3.1% of AGI
State:
3.7% of AGI
(% of AGI for various income ranges: 0.7% for AGIs $25k-50k, 1.0% for AGIs $50k-75k, 1.7% for AGIs $75k-100k, 1.4% for AGIs over 100k)
Total tax: $4,174 (reported on 70.0% of returns)
26184:
$4,174
State:
$5,372
(% of AGI for various income ranges: 1.2% for AGIs below $10k, 3.5% for AGIs $10k-25k, 5.4% for AGIs $25k-50k, 8.4% for AGIs $50k-75k, 10.0% for AGIs $75k-100k, 15.7% for AGIs over 100k)
Earned income credit: $1,853 (reported on 19.9% of returns)
Here:
$1,853
State:
$1,662
Percentage of individuals using paid preparers for their 2004 taxes: 50.6%
Here:
51%
State:
55%
(% for various income ranges: 41.5% for AGIs below $10k, 53.6% for AGIs $10k-25k, 54.1% for AGIs $25k-50k, 48.7% for AGIs $50k-75k, 53.2% for AGIs $75k-100k, 56.1% for AGIs over 100k)
Household received Food Stamps/SNAP in the past 12 months: 122 Household did not receive Food Stamps/SNAP in the past 12 months: 717
Women who had a birth in the past 12 months: 42 (43 now married, 0 unmarried) Women who did not have a birth in the past 12 months: 403 (187 now married, 215 unmarried)
Housing units in zip code 26184 with a mortgage: 319 (43 second mortgage, 19 both second mortgage and home equity loan) Median monthly owner costs for units with a mortgage: $1,153 Median monthly owner costs for units without a mortgage: $299
Residents with income below the poverty level in 2022:
This zip code:
16.5%
Whole state:
17.9%
Residents with income below 50% of the poverty level in 2022:
This zip code:
11.9%
Whole state:
9.7%
Median number of rooms in houses and condos:
Here:
7.0
State:
6.5
Median number of rooms in apartments:
Here:
5.1
State:
4.7
Notable locations in this zip code not listed on our city pages
Churches in zip code 26184 include: Shiloh United Methodist Church (A), Pleasant Grove Church (B), Nash Springs Church (C), Middle Ridge Baptist Church (D), Bethel Presbyterian Church (E). Display/hide their locations on the map
Cemeteries: Sinclair Cemetery (1), Shiloh Cemetery (2), Pleasant Grove Cemetery (3), Newland Cemetery (4), Middle Ridge Baptist Church Cemetery (5), McMullen Cemetery (6), Bethel Presbyterian Church Cemetery (7). Display/hide their locations on the map
Streams, rivers, and creeks: Laurel Fork (A), Isaacs Fork (B), Horseneck Run (C), Gough Run (D), Clay Lick Run (E), Bull Run (F), Bull Creek (G), Slate Run (H), Long Run (I). Display/hide their locations on the map
In group quarters: 145 (-1 institutionalized population)
Size of family households: 332 2-persons, 171 3-persons, 66 4-persons, 72 5-persons, 17 6-persons
Size of nonfamily households: 169 1-person, 16 2-persons
356 married couples with children.
194 single-parent households (17 men, 177 women).
99.6% of residents of 26184 zip code speak English at home.
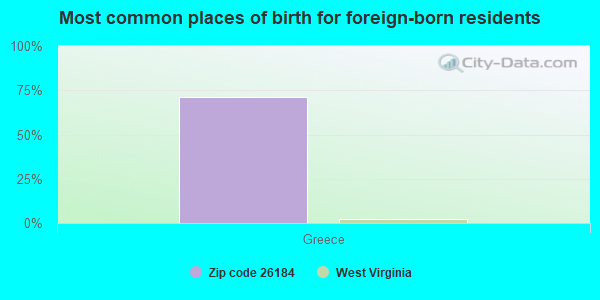
Foreign born population: 21 (0.9%) (0.0% of them are naturalized citizens)
:
0.9%
Whole state:
1.8%
71%Greece
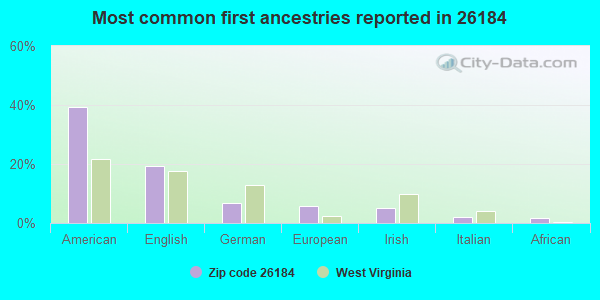
39%American
19%English
7%German
6%European
5%Irish
2%Italian
2%African
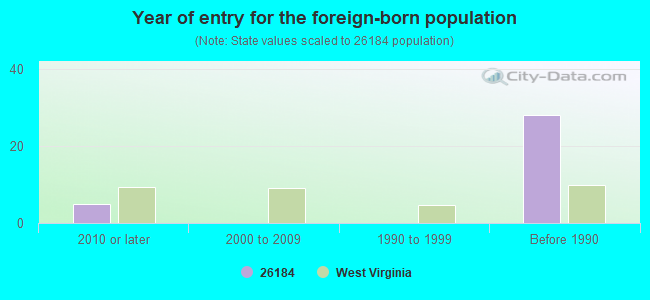
Year of entry for the foreign-born population
52010 or later
02000 to 2009
01990 to 1999
28Before 1990
Facilities with environmental interests located in this zip code:
FLOWSERVE US, INC. (STATE RTE 2 in WAVERLY, WV)
(Resource Conservation and Recovery Act (tracking hazardous waste)) Business NAICS classification: OTHER COMMERCIAL AND SERVICE INDUSTRY MACHINERY MANUFACTURING.; FLUID POWER CYLINDER AND ACTUATOR MANUFACTURING. Organizations: IVS/FRED CLARK (CONTACT/OWNER)
Alternative names: VALVE ACTUATION & REPAIR
ADEX CORPORATION (RT 2 in WAVERLY, WV)
Conditionally Exempt Small Quantity Generators, less than 100 kg/month of hazardous waste (Resource Conservation and Recovery Act (tracking hazardous waste)) Business NAICS classification: METAL COATING, ENGRAVING (EXCEPT JEWELRY AND SILVERWARE), AND ALLIED SERVICES TO MANUFACTURERS.
CUSTOM IMAGES (RAILROAD ST in WAVERLY, WV)
Conditionally Exempt Small Quantity Generators, less than 100 kg/month of hazardous waste (Resource Conservation and Recovery Act (tracking hazardous waste)) - notification Organizations: DAN SAYRES (CONTACT/OWNER)
Housing units lacking complete plumbing facilities: 4.5% Housing units lacking complete kitchen facilities: 2.2%
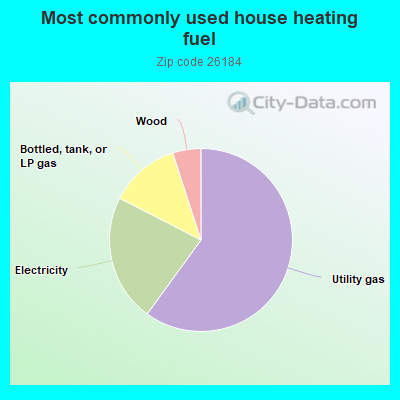
60.2%Utility gas
22.6%Electricity
12.5%Bottled, tank, or LP gas
5.0%Wood
Population in 1990: 2,836.
Place of birth for U.S.-born residents:
This state: 1,647
Northeast: 46
Midwest: 457
South: 184
West: 69
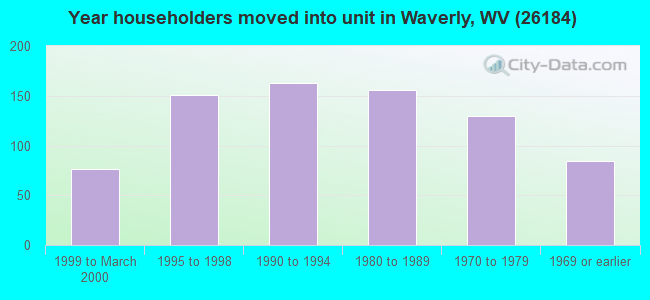
67% of the 26184 zip code residents lived in the same house 5 years ago. Out of people who lived in different houses, 70% lived in this county. Out of people who lived in different counties, 50% lived in West Virginia.
95% of the 26184 zip code residents lived in the same house 1 year ago. Out of people who lived in different houses, 42% moved from this county. Out of people who lived in different houses, 19% moved from different county within same state. Out of people who lived in different houses, 42% moved from different state.
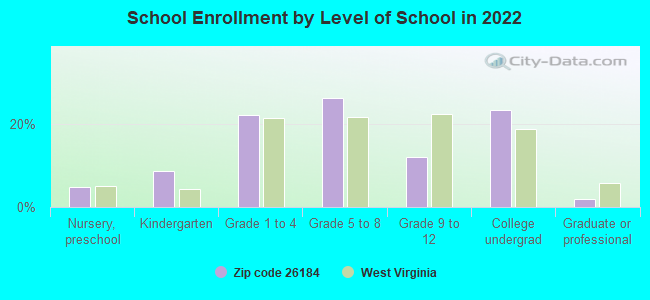
Private vs. public school enrollment:
Students in private schools in grades 1 to 8 (elementary and middle school): 21
Here:
7.4%
West Virginia:
12.2%
Students in private schools in grades 9 to 12 (high school): 11
Here:
14.9%
West Virginia:
8.8%
Students in private undergraduate colleges: 125
Here:
84.5%
West Virginia:
17.3%
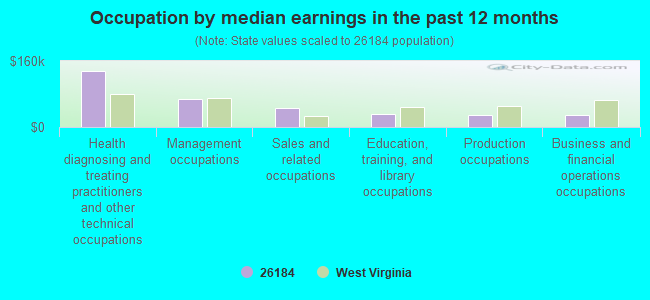
Occupation by median earnings in the past 12 months ($)
135,425Health diagnosing and treating practitioners and other technical occupations
69,062Management occupations
46,864Sales and related occupations
31,514Education, training, and library occupations
30,272Production occupations
29,000Business and financial operations occupations
Companies with federal contracts located in this zip code:
CARR CONCRETE CORPORATION (WAVERLY RD in WAVERLY, WV; small business) : $2,569,052 in 49 contractsfrom 2000 to 2006
Contracts for Prefabricated and Portable Buildings, Maintenance, Repair or Alteration of Real Property -- Recreation Facilities (Non-Building), Tile, Brick, and Block, Construction of Structures and Facilities -- Miscellaneous Buildings, and moreby Army, U.S. Coast Guard, Forest Service, Navy, and others Signed by year:2000: $69,644; 2001: $64,266; 2002: $61,000; 2003: $1,058,334; 2004: $618,445; 2005: $456,388; 2006: $240,975.
Biggest contracts:
$671,291 with Army for Prefabricated and Portable Buildings. Taking place in OH. Signed on 2003-06-16. Completion date: 2003-08-29.
$156,698 with Army for Prefabricated and Portable Buildings. Taking place in VA. Signed on 2004-09-10. Completion date: 2004-11-08.
$101,174 with U.S. Coast Guard for Prefabricated and Portable Buildings. Taking place in TX. Signed on 2003-05-15. Completion date: 2003-07-15.
$91,811 with Forest Service for Prefabricated and Portable Buildings. Signed on 2003-05-15. Completion date: 2003-09-15.
Top industries in this zip code by the number of employees in 2005:
Construction: All Other Specialty Trade Contractors (100-249 employees: 1 establishment)
Administrative and Support and Waste Management and Remediation Services: Office Administrative Services (20-49: 1)
Educational Services: Other Technical and Trade Schools (20-49: 1)
Arts, Entertainment, and Recreation: Golf Courses and Country Clubs (10-19: 1)
Construction: New Single-Family Housing Construction (except Operative Builders) (5-9: 1)
Other Services (except Public Administration): Religious Organizations (1-4: 3)
Construction: Poured Concrete Foundation and Structure Contractors (1-4: 2)
People in group quarters in 2010:
73 people in college/university student housing
People in group quarters in 2000:
43 people in college dormitories (includes college quarters off campus)
Fatal accident statistics in 2013:
Fatal accident count: 3
Vehicles involved in fatal accidents: 4
Fatal accidents caused by drunken drivers: 3
Fatalities: 3
Persons involved in fatal accidents: 6
Pedestrians involved in fatal accidents: 0
Fatal accident statistics in 2010:
Fatal accident count: 2
Vehicles involved in fatal accidents: 4
Fatal accidents caused by drunken drivers: 1
Fatalities: 2
Persons involved in fatal accidents: 5
Pedestrians involved in fatal accidents: 0
Home Mortgage Disclosure Act Aggregated Statistics For Year 2009 (Based on 4 partial tracts)
A) FHA, FSA/RHS & VA Home Purchase Loans
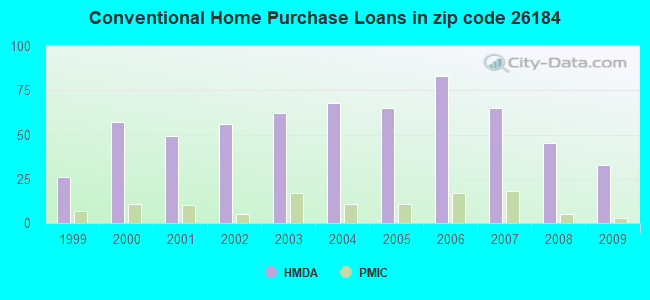
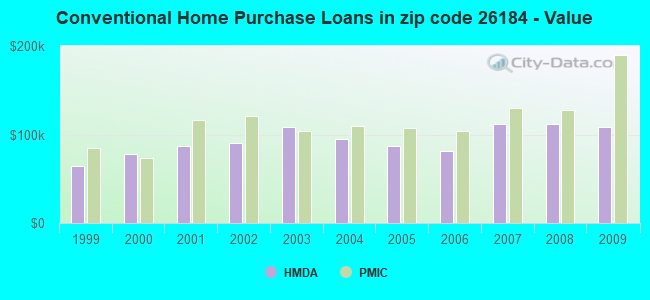
B) Conventional Home Purchase Loans
C) Refinancings
D) Home Improvement Loans
F) Non-occupant Loans on < 5 Family Dwellings (A B C & D)
G) Loans On Manufactured Home Dwelling (A B C & D)
Number
Average Value
Number
Average Value
Number
Average Value
Number
Average Value
Number
Average Value
Number
Average Value
LOANS ORIGINATED
15
$97,037
33
$107,958
103
$130,314
18
$61,002
7
$97,147
10
$65,668
APPLICATIONS APPROVED, NOT ACCEPTED
2
$107,340
2
$104,785
7
$124,874
1
$5,260
0
$0
2
$89,920
APPLICATIONS DENIED
4
$73,270
4
$84,400
37
$100,211
2
$17,145
3
$78,307
2
$32,280
APPLICATIONS WITHDRAWN
3
$159,070
4
$74,885
37
$148,122
2
$83,270
1
$865,480
4
$43,190
FILES CLOSED FOR INCOMPLETENESS
0
$0
0
$0
2
$83,740
0
$0
0
$0
1
$37,090
Aggregated Statistics For Year 2008 (Based on 4 partial tracts)
A) FHA, FSA/RHS & VA Home Purchase Loans
B) Conventional Home Purchase Loans
C) Refinancings
D) Home Improvement Loans
F) Non-occupant Loans on < 5 Family Dwellings (A B C & D)
G) Loans On Manufactured Home Dwelling (A B C & D)
Number
Average Value
Number
Average Value
Number
Average Value
Number
Average Value
Number
Average Value
Number
Average Value
LOANS ORIGINATED
18
$99,454
45
$111,411
60
$103,074
17
$54,588
20
$92,718
14
$45,854
APPLICATIONS APPROVED, NOT ACCEPTED
0
$0
2
$156,800
3
$31,610
4
$49,792
0
$0
0
$0
APPLICATIONS DENIED
5
$135,086
8
$82,858
53
$94,338
18
$54,915
1
$67,440
8
$78,958
APPLICATIONS WITHDRAWN
0
$0
7
$138,046
30
$105,058
1
$67,440
0
$0
1
$82,900
FILES CLOSED FOR INCOMPLETENESS
0
$0
0
$0
6
$139,750
0
$0
0
$0
0
$0
Aggregated Statistics For Year 2007 (Based on 4 partial tracts)
A) FHA, FSA/RHS & VA Home Purchase Loans
B) Conventional Home Purchase Loans
C) Refinancings
D) Home Improvement Loans
E) Loans on Dwellings For 5+ Families
F) Non-occupant Loans on < 5 Family Dwellings (A B C & D)
G) Loans On Manufactured Home Dwelling (A B C & D)
Number
Average Value
Number
Average Value
Number
Average Value
Number
Average Value
Number
Average Value
Number
Average Value
Number
Average Value
LOANS ORIGINATED
12
$104,807
65
$112,269
77
$86,344
25
$27,338
2
$113,555
10
$99,937
17
$44,551
APPLICATIONS APPROVED, NOT ACCEPTED
0
$0
7
$69,436
9
$86,492
2
$8,565
0
$0
2
$33,155
3
$78,680
APPLICATIONS DENIED
2
$135,045
18
$65,338
64
$83,637
15
$42,419
0
$0
2
$71,375
12
$67,918
APPLICATIONS WITHDRAWN
2
$170,850
5
$69,276
29
$93,675
6
$65,640
0
$0
0
$0
2
$72,250
FILES CLOSED FOR INCOMPLETENESS
1
$107,900
2
$54,120
4
$109,820
1
$50,950
0
$0
0
$0
0
$0
Aggregated Statistics For Year 2006 (Based on 4 partial tracts)
A) FHA, FSA/RHS & VA Home Purchase Loans
B) Conventional Home Purchase Loans
C) Refinancings
D) Home Improvement Loans
F) Non-occupant Loans on < 5 Family Dwellings (A B C & D)
G) Loans On Manufactured Home Dwelling (A B C & D)
Number
Average Value
Number
Average Value
Number
Average Value
Number
Average Value
Number
Average Value
Number
Average Value
LOANS ORIGINATED
11
$112,478
83
$80,945
67
$86,095
28
$29,659
8
$59,376
26
$50,917
APPLICATIONS APPROVED, NOT ACCEPTED
0
$0
17
$79,041
9
$80,197
1
$82,090
0
$0
6
$44,623
APPLICATIONS DENIED
2
$53,560
8
$80,726
60
$91,626
24
$32,909
1
$3,240
10
$47,406
APPLICATIONS WITHDRAWN
2
$76,430
3
$57,693
26
$82,308
5
$54,454
1
$35,990
3
$35,607
FILES CLOSED FOR INCOMPLETENESS
1
$69,690
0
$0
5
$73,064
0
$0
1
$22,480
0
$0
Aggregated Statistics For Year 2005 (Based on 4 partial tracts)
A) FHA, FSA/RHS & VA Home Purchase Loans
B) Conventional Home Purchase Loans
C) Refinancings
D) Home Improvement Loans
F) Non-occupant Loans on < 5 Family Dwellings (A B C & D)
G) Loans On Manufactured Home Dwelling (A B C & D)
Number
Average Value
Number
Average Value
Number
Average Value
Number
Average Value
Number
Average Value
Number
Average Value
LOANS ORIGINATED
10
$103,753
65
$87,469
77
$95,424
29
$41,302
14
$63,728
21
$41,229
APPLICATIONS APPROVED, NOT ACCEPTED
2
$69,690
11
$90,741
13
$74,149
2
$110,200
0
$0
2
$62,970
APPLICATIONS DENIED
5
$78,068
15
$61,277
55
$80,461
21
$29,521
3
$40,833
17
$57,364
APPLICATIONS WITHDRAWN
3
$83,293
7
$81,427
18
$86,349
4
$79,870
2
$98,950
5
$54,338
FILES CLOSED FOR INCOMPLETENESS
0
$0
1
$76,430
2
$76,090
0
$0
0
$0
0
$0
Aggregated Statistics For Year 2004 (Based on 4 partial tracts)
A) FHA, FSA/RHS & VA Home Purchase Loans
B) Conventional Home Purchase Loans
C) Refinancings
D) Home Improvement Loans
F) Non-occupant Loans on < 5 Family Dwellings (A B C & D)
G) Loans On Manufactured Home Dwelling (A B C & D)
Number
Average Value
Number
Average Value
Number
Average Value
Number
Average Value
Number
Average Value
Number
Average Value
LOANS ORIGINATED
3
$124,560
68
$94,886
113
$90,149
26
$24,438
15
$61,129
15
$52,059
APPLICATIONS APPROVED, NOT ACCEPTED
0
$0
11
$73,135
24
$85,530
0
$0
1
$112,400
6
$52,932
APPLICATIONS DENIED
2
$41,245
10
$82,792
45
$82,608
20
$29,229
2
$10,900
4
$71,848
APPLICATIONS WITHDRAWN
0
$0
8
$74,631
26
$123,731
2
$16,860
2
$111,560
2
$68,950
FILES CLOSED FOR INCOMPLETENESS
0
$0
0
$0
7
$94,700
1
$16,860
0
$0
0
$0
Aggregated Statistics For Year 2003 (Based on 4 partial tracts)
A) FHA, FSA/RHS & VA Home Purchase Loans
B) Conventional Home Purchase Loans
C) Refinancings
D) Home Improvement Loans
F) Non-occupant Loans on < 5 Family Dwellings (A B C & D)
Number
Average Value
Number
Average Value
Number
Average Value
Number
Average Value
Number
Average Value
LOANS ORIGINATED
8
$94,015
62
$108,087
171
$92,262
22
$32,925
10
$64,618
APPLICATIONS APPROVED, NOT ACCEPTED
0
$0
2
$146,355
19
$98,994
0
$0
1
$123,640
APPLICATIONS DENIED
3
$51,727
21
$54,364
46
$74,718
5
$11,540
2
$34,740
APPLICATIONS WITHDRAWN
1
$59,570
9
$89,416
34
$85,583
1
$11,320
2
$44,440
FILES CLOSED FOR INCOMPLETENESS
0
$0
7
$67,761
6
$99,857
0
$0
0
$0
Aggregated Statistics For Year 2002 (Based on 4 partial tracts)
A) FHA, FSA/RHS & VA Home Purchase Loans
B) Conventional Home Purchase Loans
C) Refinancings
D) Home Improvement Loans
F) Non-occupant Loans on < 5 Family Dwellings (A B C & D)
Number
Average Value
Number
Average Value
Number
Average Value
Number
Average Value
Number
Average Value
LOANS ORIGINATED
9
$76,227
56
$90,281
120
$83,455
20
$22,243
9
$55,833
APPLICATIONS APPROVED, NOT ACCEPTED
0
$0
2
$83,710
18
$58,874
2
$13,345
0
$0
APPLICATIONS DENIED
1
$85,730
14
$72,424
44
$64,938
7
$10,157
3
$54,993
APPLICATIONS WITHDRAWN
2
$104,530
4
$51,220
28
$75,576
2
$8,205
0
$0
FILES CLOSED FOR INCOMPLETENESS
0
$0
2
$48,775
7
$78,324
0
$0
0
$0
Aggregated Statistics For Year 2001 (Based on 4 partial tracts)
A) FHA, FSA/RHS & VA Home Purchase Loans
B) Conventional Home Purchase Loans
C) Refinancings
D) Home Improvement Loans
F) Non-occupant Loans on < 5 Family Dwellings (A B C & D)
Number
Average Value
Number
Average Value
Number
Average Value
Number
Average Value
Number
Average Value
LOANS ORIGINATED
9
$65,192
49
$86,657
112
$74,602
24
$7,908
6
$20,528
APPLICATIONS APPROVED, NOT ACCEPTED
0
$0
9
$58,382
11
$61,754
0
$0
0
$0
APPLICATIONS DENIED
0
$0
14
$49,312
37
$59,124
5
$18,026
3
$21,813
APPLICATIONS WITHDRAWN
1
$74,180
4
$35,242
28
$70,789
3
$24,800
0
$0
FILES CLOSED FOR INCOMPLETENESS
1
$65,190
0
$0
8
$57,949
1
$34,840
0
$0
Aggregated Statistics For Year 2000 (Based on 4 partial tracts)
A) FHA, FSA/RHS & VA Home Purchase Loans
B) Conventional Home Purchase Loans
C) Refinancings
D) Home Improvement Loans
F) Non-occupant Loans on < 5 Family Dwellings (A B C & D)
Number
Average Value
Number
Average Value
Number
Average Value
Number
Average Value
Number
Average Value
LOANS ORIGINATED
5
$75,712
57
$77,791
53
$58,786
16
$12,587
8
$55,312
APPLICATIONS APPROVED, NOT ACCEPTED
0
$0
8
$55,948
13
$49,886
3
$8,777
2
$48,235
APPLICATIONS DENIED
1
$54,590
25
$45,379
39
$59,814
5
$19,556
0
$0
APPLICATIONS WITHDRAWN
0
$0
12
$78,510
23
$49,900
3
$14,503
0
$0
FILES CLOSED FOR INCOMPLETENESS
0
$0
0
$0
2
$53,380
0
$0
0
$0
Aggregated Statistics For Year 1999 (Based on 2 partial tracts)
A) FHA, FSA/RHS & VA Home Purchase Loans
B) Conventional Home Purchase Loans
C) Refinancings
D) Home Improvement Loans
F) Non-occupant Loans on < 5 Family Dwellings (A B C & D)
Detailed PMIC statistics for the following Tracts:0106.01
, 0106.02
2003 - 2018 National Fire Incident Reporting System (NFIRS) incidents
Based on the data from the years 2003 - 2018 the average number of fires per year is 10. The highest number of reported fires - 20 took place in 2009, and the least - 2 in 2006. The data has a constant trend.
When looking into fire subcategories, the most incidents belonged to: Structure Fires (40.6%), and Outside Fires (34.5%).
Fire incident types reported to NFIRS in Zip Code 26184


 Nearest zip codes: 26134, 26180, 26187, 26104, 26142, 45768.
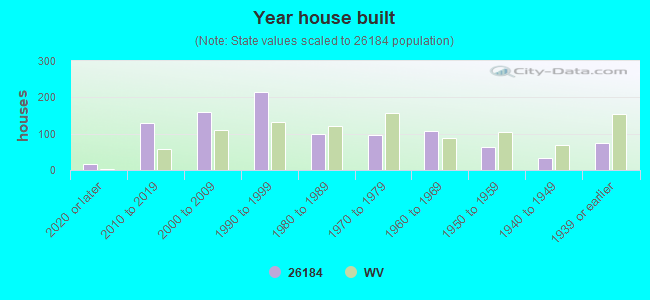


 Based on the data from the years 2003 - 2018 the average number of fires per year is 10. The highest number of reported fires - 20 took place in 2009, and the least - 2 in 2006. The data has a constant trend.
 When looking into fire subcategories, the most incidents belonged to: Structure Fires (40.6%), and Outside Fires (34.5%).