Estimated zip code population in 2022: 1,107 Zip code population in 2010: 1,135 Zip code population in 2000: 1,068
Houses and condos: 530 Renter-occupied apartments: 48
% of renters here:
10%
State:
26%
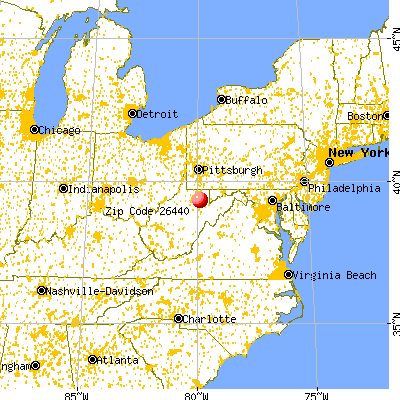
March 2022 cost of living index in zip code 26440: 82.1 (low, U.S. average is 100)
Land area: 43.0 sq. mi. Water area: 0.0 sq. mi.
Population density: 26 people per square mile
(very low).
OSM Map
General Map
Google Map
MSN Map
OSM Map
General Map
Google Map
MSN Map
OSM Map
General Map
Google Map
MSN Map
OSM Map
General Map
Google Map
MSN Map
Please wait while loading the map...
Real estate property taxes paid for housing units in 2022:
This zip code:
0.5% ($878)
West Virginia:
0.5% ($821)
Median real estate property taxes paid for housing units with mortgages in 2022: $938 (0.4%) Median real estate property taxes paid for housing units with no mortgage in 2022: $835 (0.8%)
Business Search- 14 Million verified businesses
Males: 549
(49.6%)
Females: 558
(50.4%)
For population 25 years and over in 26440:
High school or higher: 85.1%
Bachelor's degree or higher: 8.5%
Graduate or professional degree: 5.3%
Unemployed: 7.8%
Mean travel time to work (commute): 36.7 minutes
For population 15 years and over in 26440:
Never married: 27.0%
Now married: 51.6%
Separated: 0.0%
Widowed: 5.2%
Divorced: 16.2%
Zip code 26440 compared to state average:
Black race population percentage significantly below state average.
Hispanic race population percentage significantly below state average.
Foreign-born population percentage significantly below state average.
Renting percentage significantly below state average.
Length of stay since moving in significantly below state average.
Number of college students significantly below state average.
Percentage of population with a bachelor's degree or higher significantly below state average.
Estimated median house/condo value in 2022: $167,546
26440:
$167,546
West Virginia:
$155,100
According to our research of West Virginia and other state lists, there were 4 registered sex offenders living in 26440 zip code as of May 28, 2024. The ratio of all residents to sex offenders in zip code 26440 is 313 to 1. The ratio of registered sex offenders to all residents in this zip code is near the state average.
Median resident age:
This zip code:
41.4 years
West Virginia median age:
42.9 years
Average household size:
This zip code:
2.3 people
West Virginia:
2.3 people
Averages for the 2020 tax year for zip code 26440, filed in 2021:
Average Adjusted Gross Income (AGI) in 2020: $52,629 (Individual Income Tax Returns)
Here:
$52,629
State:
$56,292
Salary/wage: $48,949 (reported on 82.7% of returns)
Here:
$48,949
State:
$49,093
(% of AGI for various income ranges: 1212.1% for AGIs below $25k, 3247.0% for AGIs $25k-50k, 6826.0% for AGIs $50k-75k, 8656.0% for AGIs $75k-100k, 16726.0% for AGIs $100k-200k)
Taxable interest for individuals: $643 (reported on 26.9% of returns)
This zip code:
$643
West Virginia:
$1,141
(% of AGI for various income ranges: 20.7% for AGIs below $25k, 27.0% for AGIs $25k-50k, 14.0% for AGIs $75k-100k, 54.0% for AGIs $100k-200k)
Ordinary dividends: $950 (reported on 7.7% of returns)
Here:
$950
State:
$5,456
(% of AGI for various income ranges: 76.0% for AGIs $50k-75k)
Net capital gain/loss in AGI: +$1,367 (reported on 5.8% of returns)
Here:
+$1,367
State:
+$11,656
(% of AGI for various income ranges: 41.0% for AGIs $25k-50k)
Profit/loss from business: +$6,440 (reported on 9.6% of returns)
Here:
+$6,440
State:
+$12,084
(% of AGI for various income ranges: 92.1% for AGIs below $25k, 386.0% for AGIs $50k-75k)
Taxable individual retirement arrangement distribution: $20,400 (reported on 5.8% of returns)
26440:
$20,400
West Virginia:
$15,311
(% of AGI for various income ranges: 612.0% for AGIs $25k-50k)
Earned income credit: $2,188 (reported on 15.4% of returns)
Here:
$2,188
State:
$2,258
(% of AGI for various income ranges: 87.1% for AGIs below $25k, 53.0% for AGIs $25k-50k)
Percentage of individuals using paid preparers for their 2020 taxes: 88.5%
Here:
88%
State:
93%
(% for various income ranges: 89.5% for AGIs below $25k, 91.7% for AGIs $25k-50k, 85.7% for AGIs $50k-75k, 83.3% for AGIs $75k-100k, 87.5% for AGIs $100k-200k)
Averages for the 2012 tax year for zip code 26440, filed in 2013:
Average Adjusted Gross Income (AGI) in 2012: $41,592 (Individual Income Tax Returns)
Here:
$41,592
State:
$48,628
Salary/wage: $36,695 (reported on 89.6% of returns)
Here:
$36,695
State:
$42,328
(% of AGI for various income ranges: 76.9% for AGIs below $25k, 86.2% for AGIs $25k-50k, 86.4% for AGIs $50k-75k, 86.5% for AGIs $75k-100k, 62.5% for AGIs $100k-200k)
Taxable interest for individuals: $621 (reported on 29.2% of returns)
This zip code:
$621
West Virginia:
$1,211
(% of AGI for various income ranges: 0.6% for AGIs below $25k, 0.4% for AGIs $25k-50k, 0.5% for AGIs $50k-75k, 0.6% for AGIs $100k-200k)
Ordinary dividends: $675 (reported on 8.3% of returns)
Here:
$675
State:
$4,262
Net capital gain/loss in AGI: +$800 (reported on 6.2% of returns)
Here:
+$800
State:
+$8,875
Profit/loss from business: +$4,320 (reported on 10.4% of returns)
Here:
+$4,320
State:
+$13,636
Total itemized deductions: $17,729 (20% of AGI, reported on 14.6% of returns)
Here:
$17,729
State:
$21,148
Here:
19.6% of AGI
State:
18.1% of AGI
Charity contributions: $4,650 (reported on 8.3% of returns)
Here:
$4,650
State:
$4,508
(% of AGI for various income ranges: 5.5% for AGIs $75k-100k)
Taxes paid: $7,650 (reported on 12.5% of returns)
26440:
$7,650
State:
$8,103
Earned income credit: $1,733 (reported on 25.0% of returns)
Here:
$1,733
State:
$2,140
(% of AGI for various income ranges: 5.8% for AGIs below $25k, 1.3% for AGIs $25k-50k)
Percentage of individuals using paid preparers for their 2012 taxes: 56.2%
Here:
56%
State:
49%
(% for various income ranges: 47.8% for AGIs below $25k, 60.0% for AGIs $25k-50k, 62.5% for AGIs $50k-75k, 75.0% for AGIs $75k-100k, 66.7% for AGIs $100k-200k)
Averages for the 2004 tax year for zip code 26440, filed in 2005:
Average Adjusted Gross Income (AGI) in 2004: $28,173 (Individual Income Tax Returns)
Here:
$28,173
State:
$37,498
Salary/wage: $28,609 (reported on 83.6% of returns)
Here:
$28,609
State:
$33,645
(% of AGI for various income ranges: 99.6% for AGIs below $10k, 79.7% for AGIs $10k-25k, 88.8% for AGIs $25k-50k, 89.3% for AGIs $50k-75k, 76.0% for AGIs $75k-100k)
Taxable interest for individuals: $1,033 (reported on 34.1% of returns)
This zip code:
$1,033
West Virginia:
$1,465
(% of AGI for various income ranges: 2.6% for AGIs below $10k, 4.1% for AGIs $10k-25k, 0.3% for AGIs $25k-50k, 0.4% for AGIs $50k-75k, 0.3% for AGIs $75k-100k)
Taxable dividends: $1,000 (reported on 12.0% of returns)
Here:
$1,000
State:
$2,913
(% of AGI for various income ranges: 1.7% for AGIs below $10k, 1.2% for AGIs $10k-25k, 0.3% for AGIs $25k-50k, 0.0% for AGIs $50k-75k)
Net capital gain/loss: +$300 (reported on 6.8% of returns)
Here:
+$300
State:
+$6,331
Profit/loss from business: +$482 (reported on 12.7% of returns)
Here:
+$482
State:
+$11,074
Total itemized deductions: $13,976 (21% of AGI, reported on 9.3% of returns)
Here:
$13,976
State:
$16,976
Here:
20.9% of AGI
State:
19.0% of AGI
(% of AGI for various income ranges: 4.2% for AGIs $10k-25k, 8.1% for AGIs $50k-75k, 9.8% for AGIs $75k-100k)
Charity contributions deductions: $2,250 (3% of AGI, reported on 6.4% of returns)
Here:
$2,250
State:
$3,529
Here:
3.3% of AGI
State:
3.7% of AGI
Total tax: $3,042 (reported on 64.3% of returns)
26440:
$3,042
State:
$5,372
(% of AGI for various income ranges: 1.3% for AGIs below $10k, 3.7% for AGIs $10k-25k, 5.4% for AGIs $25k-50k, 7.8% for AGIs $50k-75k, 13.4% for AGIs $75k-100k)
Earned income credit: $1,757 (reported on 23.4% of returns)
Here:
$1,757
State:
$1,662
Percentage of individuals using paid preparers for their 2004 taxes: 55.9%
Here:
56%
State:
55%
(% for various income ranges: 54.5% for AGIs below $10k, 56.7% for AGIs $10k-25k, 58.9% for AGIs $25k-50k, 47.8% for AGIs $50k-75k, 58.3% for AGIs $75k-100k)
Household received Food Stamps/SNAP in the past 12 months: 89 Household did not receive Food Stamps/SNAP in the past 12 months: 381
Women who had a birth in the past 12 months: 19 (20 now married, 0 unmarried) Women who did not have a birth in the past 12 months: 147 (58 now married, 89 unmarried)
Housing units in zip code 26440 with a mortgage: 158 (11 second mortgage, 11 both second mortgage and home equity loan) Median monthly owner costs for units with a mortgage: $1,471 Median monthly owner costs for units without a mortgage: $412
Residents with income below the poverty level in 2022:
This zip code:
11.5%
Whole state:
17.9%
Residents with income below 50% of the poverty level in 2022:
This zip code:
4.9%
Whole state:
9.7%
Median number of rooms in houses and condos:
Here:
6.8
State:
6.5
Median number of rooms in apartments:
Here:
4.8
State:
4.7
Notable locations in this zip code not listed on our city pages
Churches in zip code 26440 include: Bethany Church (A), Bethel United Methodist Church (B), Maple Run Church (C), Martin Beulah Church (D), Thornton United Methodist Church (E), Mount Pleasant United Methodist Church (F), Pleasant Valley Church (G), Otterbein United Methodist Church (H), Evansville United Methodist Church (I). Display/hide their locations on the map
Streams, rivers, and creeks: Raccoon Creek (A), Oldroad Run (B), Maple Run (C), Little Sandy Creek (D), Little Laurel Run (E), Left Fork Sandy Creek (F), Glade Run (G), York Run (H). Display/hide their locations on the map
Size of family households: 133 2-persons, 100 3-persons, 47 4-persons, 20 5-persons
Size of nonfamily households: 143 1-person, 27 2-persons
280 married couples with children.
83 single-parent households (11 men, 72 women).
98.3% of residents of 26440 zip code speak English at home.
1.6% of residents speak other language at home (100% very well).
Foreign born population: 0 (0.0%)
:
0.0%
Whole state:
1.8%
53%American
13%English
7%German
5%Irish
4%European
2%Italian
1%French
Year of entry for the foreign-born population
02010 or later
02000 to 2009
01990 to 1999
8Before 1990
Facilities with environmental interests located in this zip code:
A & N TRUCK SERVICE INC (RT 1 BOX 80A in THORNTON, WV)
(Resource Conservation and Recovery Act (tracking hazardous waste)) Small Quantity Generators, between 100 kg and 1000 kg of hazardous waste/month (Resource Conservation and Recovery Act (tracking hazardous waste)) - notification Organizations: OPERNAME (CONTACT/OPERATOR)
, WOLFE, ADRIAN (CONTACT/OWNER)
, ADRIAN E WOLFE (CONTACT/OWNER)
FRANKLIN JENNINGS (ROUTE 1 BOX 94 in THORNTON, WV)
Housing units lacking complete plumbing facilities: 2.4%
42.6%Electricity
23.1%Bottled, tank, or LP gas
17.4%Wood
8.6%Utility gas
6.6%Fuel oil, kerosene, etc.
2.4%Other fuel
Population in 1990: 1,144.
Place of birth for U.S.-born residents:
This state: 849
Northeast: 40
Midwest: 112
South: 69
West: 19
72% of the 26440 zip code residents lived in the same house 5 years ago. Out of people who lived in different houses, 48% lived in this county. Out of people who lived in different counties, 50% lived in West Virginia.
84% of the 26440 zip code residents lived in the same house 1 year ago. Out of people who lived in different houses, 91% moved from this county.
Private vs. public school enrollment:
Students in private schools in grades 1 to 8 (elementary and middle school): 45
Here:
43.0%
West Virginia:
12.2%
Students in private schools in grades 9 to 12 (high school):
Here:
0.0%
West Virginia:
8.8%
Students in private undergraduate colleges:
Here:
0.0%
West Virginia:
17.3%
Occupation by median earnings in the past 12 months ($)
88,896Construction and extraction occupations
30,178Sales and related occupations
21,038Office and administrative support occupations
17,427Building and grounds cleaning and maintenance occupations
Top industries in this zip code by the number of employees in 2005:
Other Services (except Public Administration): General Automotive Repair (5-9 employees: 1 establishment, 1-4 employees: 1 establishment)
Health Care and Social Assistance: Offices of Physicians (except Mental Health Specialists) (5-9: 1)
Administrative and Support and Waste Management and Remediation Services: Landscaping Services (1-4: 1)
Construction: New Single-Family Housing Construction (except Operative Builders) (1-4: 1)
Construction: All Other Specialty Trade Contractors (1-4: 1)
People in group quarters in 2000:
12 people in other noninstitutional group quarters
Fatal accident statistics in 2014:
Fatal accident count: 1
Vehicles involved in fatal accidents: 1
Fatal accidents caused by drunken drivers: 0
Fatalities: 1
Persons involved in fatal accidents: 2
Pedestrians involved in fatal accidents: 0
Fatal accident statistics in 2011:
Fatal accident count: 1
Vehicles involved in fatal accidents: 2
Fatal accidents caused by drunken drivers: 0
Fatalities: 1
Persons involved in fatal accidents: 4
Pedestrians involved in fatal accidents: 0
2003 - 2018 National Fire Incident Reporting System (NFIRS) incidents
According to the data from the years 2003 - 2018 the average number of fire incidents per year is 13. The highest number of fires - 24 took place in 2013, and the least - 6 in 2005. The data has a growing trend.
When looking into fire subcategories, the most reports belonged to: Structure Fires (50.7%), and Outside Fires (23.7%).
Fire incident types reported to NFIRS in Zip Code 26440


 Nearest zip codes: 26405, 26354, 26410, 26374, 26444, 26425.


 According to the data from the years 2003 - 2018 the average number of fire incidents per year is 13. The highest number of fires - 24 took place in 2013, and the least - 6 in 2005. The data has a growing trend.
 When looking into fire subcategories, the most reports belonged to: Structure Fires (50.7%), and Outside Fires (23.7%).