Estimated zip code population in 2022: 2,018 Zip code population in 2010: 2,547 Zip code population in 2000: 2,354
Houses and condos: 1,014 Renter-occupied apartments: 173
% of renters here:
20%
State:
26%
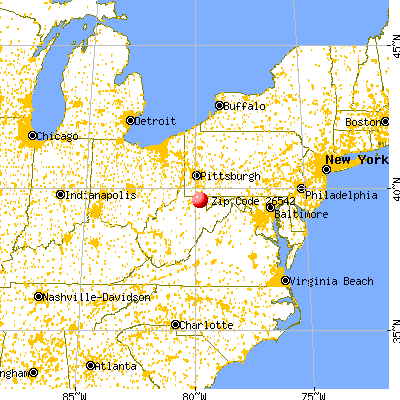
March 2022 cost of living index in zip code 26542: 86.3 (less than average, U.S. average is 100)
Land area: 36.0 sq. mi. Water area: 0.3 sq. mi.
Population density: 56 people per square mile
(very low).
OSM Map
General Map
Google Map
MSN Map
OSM Map
General Map
Google Map
MSN Map
OSM Map
General Map
Google Map
MSN Map
OSM Map
General Map
Google Map
MSN Map
Please wait while loading the map...
Real estate property taxes paid for housing units in 2022:
This zip code:
0.5% ($755)
West Virginia:
0.5% ($821)
Median real estate property taxes paid for housing units with mortgages in 2022: $833 (0.5%) Median real estate property taxes paid for housing units with no mortgage in 2022: $689 (0.5%)
Business Search- 14 Million verified businesses
Males: 1,060
(52.6%)
Females: 957
(47.4%)
For population 25 years and over in 26542:
High school or higher: 89.2%
Bachelor's degree or higher: 23.4%
Graduate or professional degree: 5.5%
Unemployed: 3.4%
Mean travel time to work (commute): 30.1 minutes
For population 15 years and over in 26542:
Never married: 30.0%
Now married: 57.6%
Separated: 0.8%
Widowed: 4.5%
Divorced: 7.0%
Zip code 26542 compared to state average:
Black race population percentage significantly below state average.
Foreign-born population percentage significantly below state average.
Length of stay since moving in above state average.
Number of college students significantly below state average.
Estimated median house/condo value in 2022: $150,526
26542:
$150,526
West Virginia:
$155,100
According to our research of West Virginia and other state lists, there were 8 registered sex offenders living in 26542 zip code as of May 28, 2024. The ratio of all residents to sex offenders in zip code 26542 is 328 to 1. The ratio of registered sex offenders to all residents in this zip code is near the state average.
Median resident age:
This zip code:
45.6 years
West Virginia median age:
42.9 years
Average household size:
This zip code:
2.3 people
West Virginia:
2.3 people
Averages for the 2020 tax year for zip code 26542, filed in 2021:
Average Adjusted Gross Income (AGI) in 2020: $58,386 (Individual Income Tax Returns)
Here:
$58,386
State:
$56,292
Salary/wage: $49,749 (reported on 82.5% of returns)
Here:
$49,749
State:
$49,093
(% of AGI for various income ranges: 1077.4% for AGIs below $25k, 3346.8% for AGIs $25k-50k, 5775.0% for AGIs $50k-75k, 8826.2% for AGIs $75k-100k, 12974.0% for AGIs $100k-200k)
Taxable interest for individuals: $1,050 (reported on 21.1% of returns)
This zip code:
$1,050
West Virginia:
$1,141
(% of AGI for various income ranges: 19.3% for AGIs below $25k, 9.6% for AGIs $25k-50k, 4.3% for AGIs $50k-75k, 95.0% for AGIs $75k-100k, 91.0% for AGIs $100k-200k)
Ordinary dividends: $5,250 (reported on 10.5% of returns)
Here:
$5,250
State:
$5,456
(% of AGI for various income ranges: 18.1% for AGIs below $25k, 22.5% for AGIs $25k-50k, 92.5% for AGIs $75k-100k, 444.0% for AGIs $100k-200k)
Net capital gain/loss in AGI: +$8,467 (reported on 10.5% of returns)
Here:
+$8,467
State:
+$11,656
(% of AGI for various income ranges: 8.1% for AGIs below $25k, 4.6% for AGIs $25k-50k, 204.3% for AGIs $50k-75k, 695.0% for AGIs $100k-200k)
Profit/loss from business: +$10,958 (reported on 10.5% of returns)
Here:
+$10,958
State:
+$12,084
(% of AGI for various income ranges: 44.1% for AGIs below $25k, 81.4% for AGIs $25k-50k, 282.1% for AGIs $50k-75k, 573.0% for AGIs $100k-200k)
Taxable individual retirement arrangement distribution: $13,675 (reported on 7.0% of returns)
26542:
$13,675
West Virginia:
$15,311
(% of AGI for various income ranges: 68.9% for AGIs below $25k, 156.8% for AGIs $25k-50k, 586.2% for AGIs $75k-100k)
Total itemized deductions: $28,533 (reported on 2.6% of returns)
Here:
$28,533
State:
$31,950
(% of AGI for various income ranges: 856.0% for AGIs $100k-200k)
Taxes paid: $7,367 (reported on 2.6% of returns)
26542:
$7,367
State:
$7,665
(% of AGI for various income ranges: 221.0% for AGIs $100k-200k)
Earned income credit: $2,228 (reported on 15.8% of returns)
Here:
$2,228
State:
$2,258
(% of AGI for various income ranges: 82.2% for AGIs below $25k, 63.9% for AGIs $25k-50k)
Percentage of individuals using paid preparers for their 2020 taxes: 90.4%
Here:
90%
State:
93%
(% for various income ranges: 89.2% for AGIs below $25k, 90.9% for AGIs $25k-50k, 94.1% for AGIs $50k-75k, 81.8% for AGIs $75k-100k, 92.3% for AGIs $100k-200k, 100.0% for AGIs over 200k)
Averages for the 2012 tax year for zip code 26542, filed in 2013:
Average Adjusted Gross Income (AGI) in 2012: $45,037 (Individual Income Tax Returns)
Here:
$45,037
State:
$48,628
Salary/wage: $40,362 (reported on 85.5% of returns)
Here:
$40,362
State:
$42,328
(% of AGI for various income ranges: 74.4% for AGIs below $25k, 82.6% for AGIs $25k-50k, 82.0% for AGIs $50k-75k, 83.5% for AGIs $75k-100k, 65.8% for AGIs $100k-200k)
Taxable interest for individuals: $1,311 (reported on 24.5% of returns)
This zip code:
$1,311
West Virginia:
$1,211
(% of AGI for various income ranges: 1.6% for AGIs below $25k, 1.1% for AGIs $25k-50k, 0.1% for AGIs $75k-100k, 0.9% for AGIs $100k-200k)
Ordinary dividends: $2,023 (reported on 11.8% of returns)
Here:
$2,023
State:
$4,262
(% of AGI for various income ranges: 0.8% for AGIs below $25k, 0.3% for AGIs $25k-50k, 0.6% for AGIs $50k-75k, 0.8% for AGIs $100k-200k)
Net capital gain/loss in AGI: +$3,929 (reported on 6.4% of returns)
Here:
+$3,929
State:
+$8,875
Profit/loss from business: +$10,607 (reported on 13.6% of returns)
Here:
+$10,607
State:
+$13,636
(% of AGI for various income ranges: 6.6% for AGIs below $25k, 6.7% for AGIs $25k-50k, 6.3% for AGIs $75k-100k)
Taxable individual retirement arrangement distribution: $9,288 (reported on 7.3% of returns)
26542:
$9,288
West Virginia:
$11,787
(% of AGI for various income ranges: 3.3% for AGIs below $25k, 1.5% for AGIs $25k-50k, 3.8% for AGIs $50k-75k)
Total itemized deductions: $19,447 (17% of AGI, reported on 13.6% of returns)
Here:
$19,447
State:
$21,148
Here:
17.3% of AGI
State:
18.1% of AGI
(% of AGI for various income ranges: 4.1% for AGIs $25k-50k, 4.6% for AGIs $50k-75k, 6.7% for AGIs $75k-100k, 9.9% for AGIs $100k-200k)
Charity contributions: $3,111 (reported on 8.2% of returns)
Here:
$3,111
State:
$4,508
(% of AGI for various income ranges: 0.4% for AGIs $25k-50k, 1.0% for AGIs $75k-100k, 1.0% for AGIs $100k-200k)
Taxes paid: $7,887 (reported on 13.6% of returns)
26542:
$7,887
State:
$8,103
(% of AGI for various income ranges: 0.8% for AGIs $25k-50k, 2.1% for AGIs $50k-75k, 2.2% for AGIs $75k-100k, 4.7% for AGIs $100k-200k)
Earned income credit: $2,132 (reported on 20.0% of returns)
Here:
$2,132
State:
$2,140
(% of AGI for various income ranges: 6.1% for AGIs below $25k, 1.1% for AGIs $25k-50k)
Percentage of individuals using paid preparers for their 2012 taxes: 40.9%
Here:
41%
State:
49%
(% for various income ranges: 31.9% for AGIs below $25k, 37.9% for AGIs $25k-50k, 50.0% for AGIs $50k-75k, 55.6% for AGIs $75k-100k, 66.7% for AGIs $100k-200k)
Averages for the 2004 tax year for zip code 26542, filed in 2005:
Average Adjusted Gross Income (AGI) in 2004: $32,401 (Individual Income Tax Returns)
Here:
$32,401
State:
$37,498
Salary/wage: $31,141 (reported on 86.9% of returns)
Here:
$31,141
State:
$33,645
(% of AGI for various income ranges: 126.8% for AGIs below $10k, 79.3% for AGIs $10k-25k, 84.9% for AGIs $25k-50k, 84.0% for AGIs $50k-75k, 82.6% for AGIs $75k-100k, 79.1% for AGIs over 100k)
Taxable interest for individuals: $1,453 (reported on 34.6% of returns)
This zip code:
$1,453
West Virginia:
$1,465
(% of AGI for various income ranges: 4.2% for AGIs below $10k, 2.7% for AGIs $10k-25k, 1.4% for AGIs $25k-50k, 1.1% for AGIs $50k-75k, 0.3% for AGIs $75k-100k, 2.1% for AGIs over 100k)
Taxable dividends: $1,658 (reported on 12.0% of returns)
Here:
$1,658
State:
$2,913
(% of AGI for various income ranges: 1.0% for AGIs $10k-25k, 0.5% for AGIs $25k-50k, 0.7% for AGIs $50k-75k, 0.4% for AGIs $75k-100k, 0.6% for AGIs over 100k)
Net capital gain/loss: +$4,678 (reported on 9.7% of returns)
Here:
+$4,678
State:
+$6,331
(% of AGI for various income ranges: -1.6% for AGIs below $10k, -0.5% for AGIs $10k-25k, 0.5% for AGIs $25k-50k, 2.3% for AGIs $50k-75k, 3.0% for AGIs $75k-100k, 2.6% for AGIs over 100k)
Profit/loss from business: +$5,515 (reported on 14.3% of returns)
Here:
+$5,515
State:
+$11,074
(% of AGI for various income ranges: -3.3% for AGIs below $10k, 4.3% for AGIs $10k-25k, 4.1% for AGIs $25k-50k, 4.0% for AGIs $50k-75k, -2.2% for AGIs $75k-100k)
IRA payment deduction: $2,800 (reported on 1.6% of returns)
26542:
$2,800
West Virginia:
$2,796
Total itemized deductions: $15,326 (18% of AGI, reported on 10.3% of returns)
Here:
$15,326
State:
$16,976
Here:
17.5% of AGI
State:
19.0% of AGI
(% of AGI for various income ranges: 2.3% for AGIs $10k-25k, 2.2% for AGIs $25k-50k, 4.8% for AGIs $50k-75k, 7.3% for AGIs $75k-100k, 11.1% for AGIs over 100k)
Charity contributions deductions: $1,870 (2% of AGI, reported on 7.5% of returns)
Here:
$1,870
State:
$3,529
Here:
2.0% of AGI
State:
3.7% of AGI
(% of AGI for various income ranges: 0.3% for AGIs $25k-50k, 0.5% for AGIs $50k-75k, 0.4% for AGIs $75k-100k, 1.1% for AGIs over 100k)
Total tax: $4,091 (reported on 72.1% of returns)
26542:
$4,091
State:
$5,372
(% of AGI for various income ranges: 3.0% for AGIs below $10k, 4.1% for AGIs $10k-25k, 5.9% for AGIs $25k-50k, 9.5% for AGIs $50k-75k, 10.7% for AGIs $75k-100k, 18.9% for AGIs over 100k)
Earned income credit: $1,498 (reported on 23.0% of returns)
Here:
$1,498
State:
$1,662
Percentage of individuals using paid preparers for their 2004 taxes: 48.8%
Here:
49%
State:
55%
(% for various income ranges: 44.7% for AGIs below $10k, 45.1% for AGIs $10k-25k, 50.6% for AGIs $25k-50k, 53.0% for AGIs $50k-75k, 56.2% for AGIs $75k-100k, 70.4% for AGIs over 100k)
Household received Food Stamps/SNAP in the past 12 months: 217 Household did not receive Food Stamps/SNAP in the past 12 months: 654
Women who had a birth in the past 12 months: 11 (11 now married, 0 unmarried) Women who did not have a birth in the past 12 months: 375 (133 now married, 242 unmarried)
Housing units in zip code 26542 with a mortgage: 318 (7 second mortgage, 7 both second mortgage and home equity loan) Median monthly owner costs for units with a mortgage: $993 Median monthly owner costs for units without a mortgage: $402
Residents with income below the poverty level in 2022:
This zip code:
12.2%
Whole state:
17.9%
Residents with income below 50% of the poverty level in 2022:
This zip code:
6.2%
Whole state:
9.7%
Median number of rooms in houses and condos:
Here:
6.4
State:
6.5
Median number of rooms in apartments:
Here:
4.7
State:
4.7
Notable locations in this zip code not listed on our city pages
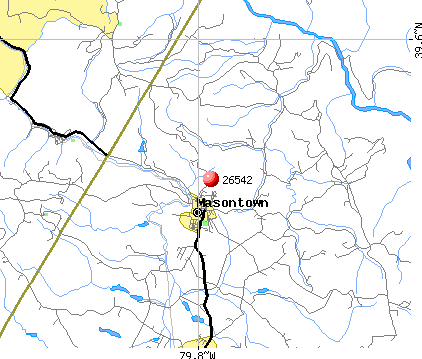
Notable locations in zip code 26542: Valley District Ambulance Service Incorporated (A), Masontown Volunteer Fire Department and Rescue Company 6 (B). Display/hide their locations on the map
Churches in zip code 26542 include: Sturgiss Church (A), Pleasant Valley United Methodist Church (B), Zion Church (C), Pleasant Grove Baptist Church (D). Display/hide their locations on the map
Streams, rivers, and creeks: Swamp Run (A), Slabcamp Run (B), Mountain Run (C), Middle Run (D), Lick Run (E), Gum Run (F), Glady Run (G), Falls Run (H), Buzzard Run (I). Display/hide their locations on the map
Parks in zip code 26542 include: Snake Hill Wildlife Management Area (1), Elkins Coal and Coke Company Historic District (2). Display/hide their locations on the map
Size of family households: 278 2-persons, 104 3-persons, 91 4-persons, 123 5-persons, 5 6-persons
Size of nonfamily households: 213 1-person, 49 2-persons
232 married couples with children.
50 single-parent households (50 men).
99.4% of residents of 26542 zip code speak English at home.
0.9% of residents speak Spanish at home (100% very well).
Foreign born population: 0 (0.0%)
:
0.0%
Whole state:
1.8%
36%American
18%English
11%German
8%European
7%Italian
6%Irish
2%Hungarian
Year of entry for the foreign-born population
122010 or later
02000 to 2009
01990 to 1999
0Before 1990
Facilities with environmental interests located in this zip code:
DECKER'S CREEK LIMESTONE COMPA (ST RT 7 WEST in MASONTOWN, WV)
National Pollutant Discharge Elimination System NON-MAJOR (Tracking pollutant discharge elimination systems) - permit Business SIC classification: MARINE CARGO HANDLING Organizations: GREER INDUSTRIES, INC (CONTACT/OWNER)
FRIENDS AUTO REPAIR (RT 7 & LOCUST ST in MASONTOWN, WV)
(Resource Conservation and Recovery Act (tracking hazardous waste)) Organizations: LOUIS FRIEND (CONTACT/OWNER)
DAIRY MART #8 (ROUTE #1 in MASONTOWN, WV)
ENFORCEMENT/COMPLIANCE ACTIVITY (Integrated Compliance Information System)
Housing units lacking complete plumbing facilities: 7.2% Housing units lacking complete kitchen facilities: 4.0%
30.7%Electricity
21.3%Fuel oil, kerosene, etc.
17.0%Utility gas
14.9%Wood
14.6%Bottled, tank, or LP gas
1.7%Coal or coke
Population in 1990: 658. Population change in the 1990s: +1,696 (+257.8%).
Place of birth for U.S.-born residents:
This state: 1,629
Northeast: 51
Midwest: 87
South: 202
West: 19
67% of the 26542 zip code residents lived in the same house 5 years ago. Out of people who lived in different houses, 66% lived in this county. Out of people who lived in different counties, 50% lived in West Virginia.
96% of the 26542 zip code residents lived in the same house 1 year ago. Out of people who lived in different houses, 20% moved from this county. Out of people who lived in different houses, 77% moved from different county within same state. Out of people who lived in different houses, 11% moved from different state.
Private vs. public school enrollment:
Students in private schools in grades 1 to 8 (elementary and middle school):
Here:
0.0%
West Virginia:
12.2%
Students in private schools in grades 9 to 12 (high school):
Here:
0.0%
West Virginia:
8.8%
Students in private undergraduate colleges:
Here:
0.0%
West Virginia:
17.3%
Occupation by median earnings in the past 12 months ($)
80,188Management occupations
52,733Transportation occupations
50,948Construction and extraction occupations
36,835Education, training, and library occupations
33,007Material moving occupations
29,574Building and grounds cleaning and maintenance occupations
Companies with federal contracts located in this zip code:
STREET'S STORE LTD (659 MAIN ST in MASONTOWN, WV; small business) : $7,838 in 2 contractsfrom 2004 to 2005
$4,399 with Army for Miscellaneous Construction Materials. Signed on 2004-08-26. Completion date: 2004-09-27.
$3,439 with Army for Lumber and Related Basic Wood Materials. Signed on 2005-05-25. Completion date: 2005-07-06.
Top industries in this zip code by the number of employees in 2005:
Health Care and Social Assistance: Residential Mental Retardation Facilities (5-9 employees: 2 establishments)
Wholesale Trade: Other Chemical and Allied Products Merchant Wholesalers (5-9: 1)
Finance and Insurance: Commercial Banking (5-9: 1)
Administrative and Support and Waste Management and Remediation Services: Solid Waste Collection (5-9: 1)
Fatal accident statistics in 2012:
Fatal accident count: 1
Vehicles involved in fatal accidents: 1
Fatal accidents caused by drunken drivers: 0
Fatalities: 1
Persons involved in fatal accidents: 1
Pedestrians involved in fatal accidents: 0
Fatal accident statistics in 2011:
Fatal accident count: 1
Vehicles involved in fatal accidents: 1
Fatal accidents caused by drunken drivers: 1
Fatalities: 1
Persons involved in fatal accidents: 2
Pedestrians involved in fatal accidents: 0
Home Mortgage Disclosure Act Aggregated Statistics For Year 2009 (Based on 2 partial tracts)
A) FHA, FSA/RHS & VA Home Purchase Loans
B) Conventional Home Purchase Loans
C) Refinancings
D) Home Improvement Loans
F) Non-occupant Loans on < 5 Family Dwellings (A B C & D)
G) Loans On Manufactured Home Dwelling (A B C & D)
Number
Average Value
Number
Average Value
Number
Average Value
Number
Average Value
Number
Average Value
Number
Average Value
LOANS ORIGINATED
40
$193,636
89
$184,841
236
$193,886
22
$165,726
17
$175,365
13
$61,729
APPLICATIONS APPROVED, NOT ACCEPTED
6
$171,865
9
$183,077
18
$155,466
2
$11,475
2
$85,470
2
$39,175
APPLICATIONS DENIED
6
$198,378
13
$116,579
62
$161,126
4
$108,818
2
$159,865
14
$43,471
APPLICATIONS WITHDRAWN
4
$213,875
17
$179,788
52
$193,787
3
$242,170
4
$128,800
2
$53,025
FILES CLOSED FOR INCOMPLETENESS
1
$94,970
4
$147,002
6
$224,230
0
$0
1
$60,940
1
$22,160
Aggregated Statistics For Year 2008 (Based on 2 partial tracts)
A) FHA, FSA/RHS & VA Home Purchase Loans
B) Conventional Home Purchase Loans
C) Refinancings
D) Home Improvement Loans
E) Loans on Dwellings For 5+ Families
F) Non-occupant Loans on < 5 Family Dwellings (A B C & D)
G) Loans On Manufactured Home Dwelling (A B C & D)
Number
Average Value
Number
Average Value
Number
Average Value
Number
Average Value
Number
Average Value
Number
Average Value
Number
Average Value
LOANS ORIGINATED
19
$175,441
145
$174,103
123
$177,447
17
$84,261
2
$793,380
22
$154,647
13
$31,535
APPLICATIONS APPROVED, NOT ACCEPTED
2
$197,455
11
$140,582
9
$209,721
6
$62,917
0
$0
2
$347,820
3
$50,123
APPLICATIONS DENIED
3
$190,463
24
$138,462
68
$169,616
9
$77,206
0
$0
2
$206,160
13
$56,737
APPLICATIONS WITHDRAWN
4
$146,608
17
$162,423
30
$165,798
3
$123,460
0
$0
1
$189,940
2
$68,455
FILES CLOSED FOR INCOMPLETENESS
1
$97,340
5
$247,234
11
$165,690
2
$100,110
0
$0
4
$191,915
1
$69,640
Aggregated Statistics For Year 2007 (Based on 2 partial tracts)
A) FHA, FSA/RHS & VA Home Purchase Loans
B) Conventional Home Purchase Loans
C) Refinancings
D) Home Improvement Loans
E) Loans on Dwellings For 5+ Families
F) Non-occupant Loans on < 5 Family Dwellings (A B C & D)
G) Loans On Manufactured Home Dwelling (A B C & D)
Number
Average Value
Number
Average Value
Number
Average Value
Number
Average Value
Number
Average Value
Number
Average Value
Number
Average Value
LOANS ORIGINATED
5
$195,476
201
$177,096
127
$161,477
40
$94,750
1
$633,120
27
$216,287
18
$47,660
APPLICATIONS APPROVED, NOT ACCEPTED
1
$146,410
20
$195,753
20
$207,268
4
$121,480
0
$0
2
$117,525
3
$73,863
APPLICATIONS DENIED
0
$0
32
$100,261
68
$161,562
24
$102,618
0
$0
3
$129,527
28
$45,053
APPLICATIONS WITHDRAWN
0
$0
26
$212,400
23
$187,493
4
$92,792
0
$0
1
$9,500
5
$18,678
FILES CLOSED FOR INCOMPLETENESS
1
$31,660
2
$180,440
5
$241,060
5
$131,530
0
$0
0
$0
0
$0
Aggregated Statistics For Year 2006 (Based on 2 partial tracts)
A) FHA, FSA/RHS & VA Home Purchase Loans
B) Conventional Home Purchase Loans
C) Refinancings
D) Home Improvement Loans
E) Loans on Dwellings For 5+ Families
F) Non-occupant Loans on < 5 Family Dwellings (A B C & D)
G) Loans On Manufactured Home Dwelling (A B C & D)
Number
Average Value
Number
Average Value
Number
Average Value
Number
Average Value
Number
Average Value
Number
Average Value
Number
Average Value
LOANS ORIGINATED
2
$116,730
192
$159,393
108
$127,130
35
$53,340
1
$326,060
17
$162,749
12
$26,248
APPLICATIONS APPROVED, NOT ACCEPTED
0
$0
13
$142,208
20
$124,170
2
$72,810
0
$0
2
$55,400
7
$42,283
APPLICATIONS DENIED
2
$100,905
27
$108,656
53
$130,656
32
$82,528
1
$383,830
2
$94,570
25
$51,283
APPLICATIONS WITHDRAWN
2
$116,335
25
$123,902
23
$180,887
2
$29,280
0
$0
3
$102,883
2
$84,680
FILES CLOSED FOR INCOMPLETENESS
0
$0
3
$149,840
4
$148,388
4
$102,090
0
$0
0
$0
0
$0
Aggregated Statistics For Year 2005 (Based on 2 partial tracts)
A) FHA, FSA/RHS & VA Home Purchase Loans
B) Conventional Home Purchase Loans
C) Refinancings
D) Home Improvement Loans
E) Loans on Dwellings For 5+ Families
F) Non-occupant Loans on < 5 Family Dwellings (A B C & D)
G) Loans On Manufactured Home Dwelling (A B C & D)
Number
Average Value
Number
Average Value
Number
Average Value
Number
Average Value
Number
Average Value
Number
Average Value
Number
Average Value
LOANS ORIGINATED
6
$154,455
195
$172,002
146
$134,018
32
$59,058
1
$593,550
18
$143,068
26
$44,714
APPLICATIONS APPROVED, NOT ACCEPTED
0
$0
21
$134,651
19
$121,584
3
$79,403
0
$0
2
$86,265
11
$42,448
APPLICATIONS DENIED
4
$57,772
56
$102,868
81
$118,407
25
$54,986
0
$0
4
$158,478
38
$45,776
APPLICATIONS WITHDRAWN
0
$0
25
$154,703
32
$111,563
6
$96,418
0
$0
4
$129,790
8
$59,355
FILES CLOSED FOR INCOMPLETENESS
0
$0
3
$152,477
6
$122,140
1
$43,530
0
$0
0
$0
1
$98,130
Aggregated Statistics For Year 2004 (Based on 2 partial tracts)
A) FHA, FSA/RHS & VA Home Purchase Loans
B) Conventional Home Purchase Loans
C) Refinancings
D) Home Improvement Loans
F) Non-occupant Loans on < 5 Family Dwellings (A B C & D)
G) Loans On Manufactured Home Dwelling (A B C & D)
Detailed PMIC statistics for the following Tracts:0118.01
2003 - 2018 National Fire Incident Reporting System (NFIRS) incidents
Based on the data from the years 2003 - 2018 the average number of fires per year is 15. The highest number of fire incidents - 27 took place in 2011, and the least - 2 in 2016. The data has a decreasing trend.
When looking into fire subcategories, the most incidents belonged to: Structure Fires (50.6%), and Outside Fires (21.8%).
Fire incident types reported to NFIRS in Zip Code 26542


 Nearest zip codes: 26547, 26520, 26537, 26508, 26374, 26519.


 Based on the data from the years 2003 - 2018 the average number of fires per year is 15. The highest number of fire incidents - 27 took place in 2011, and the least - 2 in 2016. The data has a decreasing trend.
 When looking into fire subcategories, the most incidents belonged to: Structure Fires (50.6%), and Outside Fires (21.8%).