Estimated zip code population in 2022: 887 Zip code population in 2010: 929 Zip code population in 2000: 897
Houses and condos: 555 Renter-occupied apartments: 57
% of renters here:
18%
State:
26%
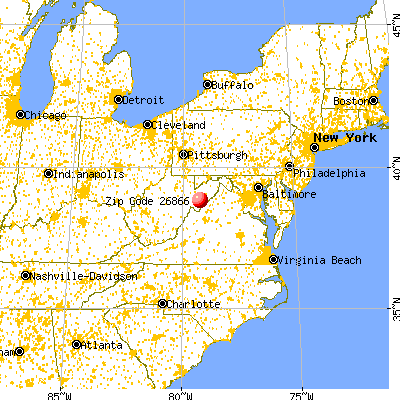
March 2022 cost of living index in zip code 26866: 84.6 (less than average, U.S. average is 100)
Land area: 79.8 sq. mi. Water area: 0.3 sq. mi.
Population density: 11 people per square mile
(very low).
OSM Map
General Map
Google Map
MSN Map
OSM Map
General Map
Google Map
MSN Map
OSM Map
General Map
Google Map
MSN Map
OSM Map
General Map
Google Map
MSN Map
Please wait while loading the map...
Real estate property taxes paid for housing units in 2022:
This zip code:
0.3% ($546)
West Virginia:
0.5% ($821)
Median real estate property taxes paid for housing units with mortgages in 2022: $676 (0.3%) Median real estate property taxes paid for housing units with no mortgage in 2022: $499 (0.3%)
Business Search- 14 Million verified businesses
Males: 431
(48.7%)
Females: 455
(51.3%)
For population 25 years and over in 26866:
High school or higher: 83.4%
Bachelor's degree or higher: 20.8%
Graduate or professional degree: 9.9%
Mean travel time to work (commute): 28.2 minutes
For population 15 years and over in 26866:
Never married: 22.2%
Now married: 61.5%
Separated: 0.0%
Widowed: 10.2%
Divorced: 6.1%
Zip code 26866 compared to state average:
Unemployed percentage significantly below state average.
Black race population percentage below state average.
Hispanic race population percentage significantly below state average.
Foreign-born population percentage significantly below state average.
Length of stay since moving in significantly above state average.
Number of rooms per house above state average.
Number of college students significantly below state average.
Estimated median house/condo value in 2022: $215,949
26866:
$215,949
West Virginia:
$155,100
According to our research of West Virginia and other state lists, there were 3 registered sex offenders living in 26866 zip code as of June 08, 2024. The ratio of all residents to sex offenders in zip code 26866 is 256 to 1.
Median resident age:
This zip code:
43.9 years
West Virginia median age:
42.9 years
Average household size:
This zip code:
2.8 people
West Virginia:
2.3 people
Averages for the 2020 tax year for zip code 26866, filed in 2021:
Average Adjusted Gross Income (AGI) in 2020: $47,582 (Individual Income Tax Returns)
Here:
$47,582
State:
$56,292
Salary/wage: $44,307 (reported on 73.7% of returns)
Here:
$44,307
State:
$49,093
(% of AGI for various income ranges: 1203.8% for AGIs below $25k, 3548.6% for AGIs $25k-50k, 6240.0% for AGIs $50k-75k, 11560.0% for AGIs $75k-100k, 11756.7% for AGIs $100k-200k)
Taxable interest for individuals: $585 (reported on 34.2% of returns)
This zip code:
$585
West Virginia:
$1,141
(% of AGI for various income ranges: 15.0% for AGIs below $25k, 12.9% for AGIs $25k-50k, 94.0% for AGIs $50k-75k, 26.7% for AGIs $100k-200k)
Ordinary dividends: $4,040 (reported on 13.2% of returns)
Here:
$4,040
State:
$5,456
(% of AGI for various income ranges: 62.9% for AGIs $25k-50k, 790.0% for AGIs $75k-100k)
Net capital gain/loss in AGI: +$4,740 (reported on 13.2% of returns)
Here:
+$4,740
State:
+$11,656
(% of AGI for various income ranges: 115.7% for AGIs $25k-50k, 780.0% for AGIs $75k-100k)
Profit/loss from business: +$2,333 (reported on 7.9% of returns)
Here:
+$2,333
State:
+$12,084
(% of AGI for various income ranges: 87.5% for AGIs below $25k)
Taxable individual retirement arrangement distribution: $7,800 (reported on 5.3% of returns)
26866:
$7,800
West Virginia:
$15,311
(% of AGI for various income ranges: 195.0% for AGIs below $25k)
Earned income credit: $1,880 (reported on 13.2% of returns)
Here:
$1,880
State:
$2,258
(% of AGI for various income ranges: 65.0% for AGIs below $25k, 60.0% for AGIs $25k-50k)
Percentage of individuals using paid preparers for their 2020 taxes: 92.1%
Here:
92%
State:
93%
(% for various income ranges: 92.3% for AGIs below $25k, 90.0% for AGIs $25k-50k, 100.0% for AGIs $50k-75k, 75.0% for AGIs $75k-100k, 100.0% for AGIs $100k-200k)
Averages for the 2012 tax year for zip code 26866, filed in 2013:
Average Adjusted Gross Income (AGI) in 2012: $39,456 (Individual Income Tax Returns)
Here:
$39,456
State:
$48,628
Salary/wage: $37,700 (reported on 80.6% of returns)
Here:
$37,700
State:
$42,328
(% of AGI for various income ranges: 66.9% for AGIs below $25k, 71.5% for AGIs $25k-50k, 83.2% for AGIs $50k-75k, 79.6% for AGIs $75k-100k)
Taxable interest for individuals: $685 (reported on 36.1% of returns)
This zip code:
$685
West Virginia:
$1,211
(% of AGI for various income ranges: 0.8% for AGIs below $25k, 0.4% for AGIs $25k-50k, 0.6% for AGIs $50k-75k, 0.7% for AGIs $75k-100k)
Ordinary dividends: $917 (reported on 16.7% of returns)
Here:
$917
State:
$4,262
Net capital gain/loss in AGI: +$833 (reported on 8.3% of returns)
Here:
+$833
State:
+$8,875
Profit/loss from business: +$5,225 (reported on 11.1% of returns)
Here:
+$5,225
State:
+$13,636
Taxable individual retirement arrangement distribution: $3,350 (reported on 5.6% of returns)
26866:
$3,350
West Virginia:
$11,787
Total itemized deductions: $15,800 (25% of AGI, reported on 19.4% of returns)
Here:
$15,800
State:
$21,148
Here:
24.6% of AGI
State:
18.1% of AGI
(% of AGI for various income ranges: 16.9% for AGIs below $25k, 9.6% for AGIs $50k-75k, 8.9% for AGIs $75k-100k)
Charity contributions: $2,075 (reported on 11.1% of returns)
Here:
$2,075
State:
$4,508
Taxes paid: $3,829 (reported on 19.4% of returns)
26866:
$3,829
State:
$8,103
(% of AGI for various income ranges: 2.4% for AGIs below $25k, 2.0% for AGIs $50k-75k, 3.1% for AGIs $75k-100k)
Earned income credit: $2,283 (reported on 16.7% of returns)
Here:
$2,283
State:
$2,140
(% of AGI for various income ranges: 5.3% for AGIs below $25k, 1.2% for AGIs $25k-50k)
Percentage of individuals using paid preparers for their 2012 taxes: 69.4%
Here:
69%
State:
49%
(% for various income ranges: 64.3% for AGIs below $25k, 70.0% for AGIs $25k-50k, 71.4% for AGIs $50k-75k, 80.0% for AGIs $75k-100k)
Averages for the 2004 tax year for zip code 26866, filed in 2005:
Average Adjusted Gross Income (AGI) in 2004: $30,614 (Individual Income Tax Returns)
Here:
$30,614
State:
$37,498
Salary/wage: $28,796 (reported on 84.1% of returns)
Here:
$28,796
State:
$33,645
(% of AGI for various income ranges: 104.6% for AGIs below $10k, 85.9% for AGIs $10k-25k, 80.9% for AGIs $25k-50k, 82.1% for AGIs $50k-75k, 62.6% for AGIs $75k-100k)
Taxable interest for individuals: $1,119 (reported on 42.4% of returns)
This zip code:
$1,119
West Virginia:
$1,465
(% of AGI for various income ranges: 8.2% for AGIs below $10k, 4.5% for AGIs $10k-25k, 1.1% for AGIs $25k-50k, 0.5% for AGIs $50k-75k, 0.5% for AGIs $75k-100k)
Taxable dividends: $732 (reported on 14.1% of returns)
Here:
$732
State:
$2,913
(% of AGI for various income ranges: 0.3% for AGIs $10k-25k, 0.3% for AGIs $25k-50k, 0.3% for AGIs $50k-75k, 0.5% for AGIs $75k-100k)
Net capital gain/loss: +$4,548 (reported on 10.6% of returns)
Here:
+$4,548
State:
+$6,331
Profit/loss from business: +$3,067 (reported on 11.4% of returns)
Here:
+$3,067
State:
+$11,074
Profit/loss from farming: +$2,167 (reported on 12.1% of returns)
Here:
+$2,167
State:
-$4,870
(% of AGI for various income ranges: 18.5% for AGIs below $10k, -1.5% for AGIs $10k-25k, 2.8% for AGIs $25k-50k, -1.6% for AGIs $50k-75k)
Total itemized deductions: $13,067 (21% of AGI, reported on 11.4% of returns)
Here:
$13,067
State:
$16,976
Here:
21.2% of AGI
State:
19.0% of AGI
Charity contributions deductions: $2,139 (4% of AGI, reported on 9.1% of returns)
Here:
$2,139
State:
$3,529
Here:
3.8% of AGI
State:
3.7% of AGI
Total tax: $3,245 (reported on 77.3% of returns)
26866:
$3,245
State:
$5,372
(% of AGI for various income ranges: 7.1% for AGIs below $10k, 4.3% for AGIs $10k-25k, 7.3% for AGIs $25k-50k, 8.4% for AGIs $50k-75k, 13.1% for AGIs $75k-100k)
Earned income credit: $1,230 (reported on 15.4% of returns)
Here:
$1,230
State:
$1,662
Percentage of individuals using paid preparers for their 2004 taxes: 65.4%
Here:
65%
State:
55%
(% for various income ranges: 61.9% for AGIs below $10k, 60.6% for AGIs $10k-25k, 70.3% for AGIs $25k-50k, 63.5% for AGIs $50k-75k, 78.3% for AGIs $75k-100k)
Likely homosexual households (counted as self-reported same-sex unmarried-partner households)
Lesbian couples: 0.0% of all households
Gay men: 1.2% of all households
Household received Food Stamps/SNAP in the past 12 months: 14 Household did not receive Food Stamps/SNAP in the past 12 months: 298
Women who did not have a birth in the past 12 months: 132 (50 now married, 81 unmarried)
Housing units in zip code 26866 with a mortgage: 79 (4 second mortgage, 4 both second mortgage and home equity loan) Median monthly owner costs for units with a mortgage: $1,352 Median monthly owner costs for units without a mortgage: $308
Residents with income below the poverty level in 2022:
This zip code:
16.5%
Whole state:
17.9%
Residents with income below 50% of the poverty level in 2022:
This zip code:
7.0%
Whole state:
9.7%
Median number of rooms in houses and condos:
Here:
7.7
State:
6.5
Median number of rooms in apartments:
Here:
6.9
State:
4.7
Notable locations in this zip code not listed on our city pages
Notable locations in zip code 26866: Smoke Hole Campground (A), South Fork Volunteer Fire Department (B), Upper Tract Volunteer Fire Department Regional Training Center (C). Display/hide their locations on the map
Churches in zip code 26866 include: Smoke Hole Church (A), Wilson Church (B), Trinity Church (C), South Mill Creek Church (D), Saint Georges Church (E), Mount Horeb Church (F), Mount Hope Church (G), Laurel Hill Church (H). Display/hide their locations on the map
Streams, rivers, and creeks: Johnson Run (A), Hayes Gap Run (B), Dry Run (C), Deer Run (D), Conrad Gap Run (E), Brushy Run (F), Briggs Run (G), Stony Creek (H), Shaver Run (I). Display/hide their locations on the map
Size of family households: 161 2-persons, 5 3-persons, 34 4-persons, 47 5-persons
Size of nonfamily households: 47 1-person, 18 2-persons
172 married couples with children.
70 single-parent households (70 women).
99.4% of residents of 26866 zip code speak English at home.
0.3% of residents speak Spanish at home (100% very well).
Foreign born population: 0 (0.0%)
:
0.0%
Whole state:
1.8%
72%German
18%English
6%Irish
5%American
1%Polish
Year of entry for the foreign-born population
02010 or later
02000 to 2009
01990 to 1999
5Before 1990
Facilities with environmental interests located in this zip code:
KIMBLE'S LAWN & GARDEN EQUIPMENT (RT 220 S AND REEDS CREEK RD in UPPER TRACT, WV)
Conditionally Exempt Small Quantity Generators, less than 100 kg/month of hazardous waste (Resource Conservation and Recovery Act (tracking hazardous waste)) - notification Organizations: MARY R. KIMBLE (CONTACT/OWNER)
Housing units lacking complete plumbing facilities: 4.5% Housing units lacking complete kitchen facilities: 3.1%
46.0%Wood
32.6%Electricity
11.8%Bottled, tank, or LP gas
6.2%Fuel oil, kerosene, etc.
4.2%Other fuel
Population in 1990: 1,161.
Place of birth for U.S.-born residents:
This state: 462
Northeast: 24
Midwest: 15
South: 386
West: 5
80% of the 26866 zip code residents lived in the same house 5 years ago. Out of people who lived in different houses, 52% lived in this county. Out of people who lived in different counties, 50% lived in West Virginia.
98% of the 26866 zip code residents lived in the same house 1 year ago. Out of people who lived in different houses, 100% moved from this county.
Private vs. public school enrollment:
Students in private schools in grades 1 to 8 (elementary and middle school):
Here:
0.0%
West Virginia:
12.2%
Students in private schools in grades 9 to 12 (high school):
Here:
0.0%
West Virginia:
8.8%
Occupation by median earnings in the past 12 months ($)
47,695Community and social service occupations
47,643Material moving occupations
38,367Production occupations
31,339Sales and related occupations
27,459Management occupations
19,990Healthcare support occupations
Top industries in this zip code by the number of employees in 2005:
Health Care and Social Assistance: Offices of Dentists (10-19 employees: 1 establishment, 5-9 employees: 1 establishment)
Administrative and Support and Waste Management and Remediation Services: Landscaping Services (1-4: 1)
Construction: Drywall and Insulation Contractors (1-4: 1)
Construction: Plumbing, Heating, and Air-Conditioning Contractors (1-4: 1)
Construction: Masonry Contractors (1-4: 1)
Fatal accident statistics in 2013:
Fatal accident count: 2
Vehicles involved in fatal accidents: 2
Fatal accidents caused by drunken drivers: 2
Fatalities: 2
Persons involved in fatal accidents: 4
Pedestrians involved in fatal accidents: 0
Fatal accident statistics in 2012:
Fatal accident count: 1
Vehicles involved in fatal accidents: 2
Fatal accidents caused by drunken drivers: 0
Fatalities: 1
Persons involved in fatal accidents: 2
Pedestrians involved in fatal accidents: 0
2003 - 2018 National Fire Incident Reporting System (NFIRS) incidents
Based on the data from the years 2003 - 2018 the average number of fires per year is 15. The highest number of reported fires - 27 took place in 2007, and the least - 3 in 2004. The data has an increasing trend.
When looking into fire subcategories, the most reports belonged to: Outside Fires (46.6%), and Structure Fires (44.5%).
Fire incident types reported to NFIRS in Zip Code 26866


+$2,167
-$4,870
(% of AGI for various income ranges: 18.5% for AGIs below $10k, -1.5% for AGIs $10k-25k, 2.8% for AGIs $25k-50k, -1.6% for AGIs $50k-75k) Nearest zip codes: 26855, 26807, 26802, 26847, 26884, 22820.


 Based on the data from the years 2003 - 2018 the average number of fires per year is 15. The highest number of reported fires - 27 took place in 2007, and the least - 3 in 2004. The data has an increasing trend.
 When looking into fire subcategories, the most reports belonged to: Outside Fires (46.6%), and Structure Fires (44.5%).