Estimated zip code population in 2022: 3,465 Zip code population in 2010: 4,032 Zip code population in 2000: 4,523
Houses and condos: 1,837 Renter-occupied apartments: 301
% of renters here:
17%
State:
33%
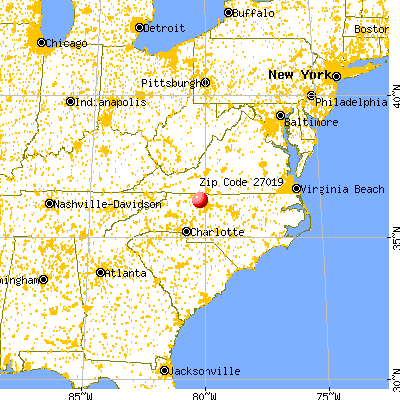
March 2022 cost of living index in zip code 27019: 80.5 (low, U.S. average is 100)
Land area: 35.1 sq. mi. Water area: 0.3 sq. mi.
Population density: 99 people per square mile
(very low).
OSM Map
General Map
Google Map
MSN Map
OSM Map
General Map
Google Map
MSN Map
OSM Map
General Map
Google Map
MSN Map
OSM Map
General Map
Google Map
MSN Map
Please wait while loading the map...
Real estate property taxes paid for housing units in 2022:
This zip code:
0.5% ($1,101)
North Carolina:
0.6% ($1,769)
Median real estate property taxes paid for housing units with mortgages in 2022: $1,360 (0.6%) Median real estate property taxes paid for housing units with no mortgage in 2022: $954 (0.5%)
Averages for the 2020 tax year for zip code 27019, filed in 2021:
Average Adjusted Gross Income (AGI) in 2020: $55,922 (Individual Income Tax Returns)
Here:
$55,922
State:
$70,020
Salary/wage: $49,666 (reported on 76.3% of returns)
Here:
$49,666
State:
$58,387
(% of AGI for various income ranges: 1115.6% for AGIs below $25k, 3404.9% for AGIs $25k-50k, 6373.3% for AGIs $50k-75k, 9941.7% for AGIs $75k-100k, 16203.8% for AGIs $100k-200k)
Taxable interest for individuals: $1,194 (reported on 34.9% of returns)
This zip code:
$1,194
North Carolina:
$1,479
(% of AGI for various income ranges: 20.5% for AGIs below $25k, 26.5% for AGIs $25k-50k, 44.3% for AGIs $50k-75k, 45.8% for AGIs $75k-100k, 116.2% for AGIs $100k-200k)
Ordinary dividends: $5,233 (reported on 17.7% of returns)
Here:
$5,233
State:
$7,888
(% of AGI for various income ranges: 25.1% for AGIs below $25k, 40.3% for AGIs $25k-50k, 85.7% for AGIs $50k-75k, 212.5% for AGIs $75k-100k, 165.4% for AGIs $100k-200k)
Net capital gain/loss in AGI: +$10,792 (reported on 13.4% of returns)
Here:
+$10,792
State:
+$23,652
(% of AGI for various income ranges: 1.9% for AGIs below $25k, 22.4% for AGIs $25k-50k, 110.5% for AGIs $50k-75k, 146.7% for AGIs $75k-100k, 422.3% for AGIs $100k-200k)
Profit/loss from business: +$8,277 (reported on 14.0% of returns)
Here:
+$8,277
State:
+$11,710
(% of AGI for various income ranges: 105.3% for AGIs below $25k, 137.3% for AGIs $25k-50k, 60.5% for AGIs $50k-75k, 181.7% for AGIs $75k-100k, 650.8% for AGIs $100k-200k)
Taxable individual retirement arrangement distribution: $16,331 (reported on 14.0% of returns)
27019:
$16,331
North Carolina:
$20,247
(% of AGI for various income ranges: 94.2% for AGIs below $25k, 174.3% for AGIs $25k-50k, 283.8% for AGIs $50k-75k, 722.5% for AGIs $75k-100k, 1333.1% for AGIs $100k-200k)
Total itemized deductions: $31,200 (reported on 3.8% of returns)
Here:
$31,200
State:
$34,549
(% of AGI for various income ranges: 539.0% for AGIs $50k-75k, 809.2% for AGIs $100k-200k)
Charity contributions: $11,150 (reported on 3.2% of returns)
Here:
$11,150
State:
$13,360
(% of AGI for various income ranges: 137.6% for AGIs $50k-75k, 292.3% for AGIs $100k-200k)
Taxes paid: $5,929 (reported on 3.8% of returns)
27019:
$5,929
State:
$7,586
(% of AGI for various income ranges: 77.1% for AGIs $50k-75k, 194.6% for AGIs $100k-200k)
Earned income credit: $2,068 (reported on 15.1% of returns)
Here:
$2,068
State:
$2,337
(% of AGI for various income ranges: 79.1% for AGIs below $25k, 64.6% for AGIs $25k-50k)
Percentage of individuals using paid preparers for their 2020 taxes: 94.1%
Here:
94%
State:
93%
(% for various income ranges: 91.9% for AGIs below $25k, 93.8% for AGIs $25k-50k, 96.7% for AGIs $50k-75k, 95.0% for AGIs $75k-100k, 95.5% for AGIs $100k-200k, 100.0% for AGIs over 200k)
Averages for the 2012 tax year for zip code 27019, filed in 2013:
Average Adjusted Gross Income (AGI) in 2012: $46,469 (Individual Income Tax Returns)
Here:
$46,469
State:
$54,937
Salary/wage: $41,246 (reported on 81.7% of returns)
Here:
$41,246
State:
$46,336
(% of AGI for various income ranges: 68.1% for AGIs below $25k, 77.6% for AGIs $25k-50k, 70.5% for AGIs $50k-75k, 74.4% for AGIs $75k-100k, 70.8% for AGIs $100k-200k)
Taxable interest for individuals: $1,001 (reported on 38.3% of returns)
This zip code:
$1,001
North Carolina:
$1,298
(% of AGI for various income ranges: 1.3% for AGIs below $25k, 0.6% for AGIs $25k-50k, 0.8% for AGIs $50k-75k, 0.2% for AGIs $75k-100k, 1.2% for AGIs $100k-200k)
Ordinary dividends: $2,294 (reported on 18.9% of returns)
Here:
$2,294
State:
$6,213
(% of AGI for various income ranges: 1.0% for AGIs below $25k, 0.6% for AGIs $25k-50k, 0.9% for AGIs $50k-75k, 0.6% for AGIs $75k-100k, 1.4% for AGIs $100k-200k)
Net capital gain/loss in AGI: +$3,586 (reported on 12.2% of returns)
Here:
+$3,586
State:
+$12,740
(% of AGI for various income ranges: 0.2% for AGIs $50k-75k, 0.2% for AGIs $75k-100k, 2.9% for AGIs $100k-200k)
Profit/loss from business: +$5,964 (reported on 15.6% of returns)
Here:
+$5,964
State:
+$10,311
(% of AGI for various income ranges: 9.5% for AGIs below $25k, 0.8% for AGIs $25k-50k, 1.9% for AGIs $50k-75k, 1.0% for AGIs $75k-100k, 1.0% for AGIs $100k-200k)
Taxable individual retirement arrangement distribution: $12,322 (reported on 12.8% of returns)
27019:
$12,322
North Carolina:
$15,575
(% of AGI for various income ranges: 4.5% for AGIs below $25k, 2.8% for AGIs $25k-50k, 4.0% for AGIs $50k-75k, 4.1% for AGIs $75k-100k, 2.5% for AGIs $100k-200k)
Total itemized deductions: $17,395 (22% of AGI, reported on 30.6% of returns)
Here:
$17,395
State:
$23,438
Here:
22.2% of AGI
State:
21.5% of AGI
(% of AGI for various income ranges: 9.5% for AGIs below $25k, 9.1% for AGIs $25k-50k, 10.9% for AGIs $50k-75k, 12.1% for AGIs $75k-100k, 13.6% for AGIs $100k-200k)
Charity contributions: $3,507 (reported on 25.0% of returns)
Here:
$3,507
State:
$4,687
(% of AGI for various income ranges: 0.8% for AGIs below $25k, 1.0% for AGIs $25k-50k, 1.8% for AGIs $50k-75k, 2.0% for AGIs $75k-100k, 2.8% for AGIs $100k-200k)
Taxes paid: $6,045 (reported on 30.6% of returns)
27019:
$6,045
State:
$8,823
(% of AGI for various income ranges: 1.3% for AGIs below $25k, 2.3% for AGIs $25k-50k, 3.3% for AGIs $50k-75k, 3.9% for AGIs $75k-100k, 6.5% for AGIs $100k-200k)
Earned income credit: $2,152 (reported on 17.2% of returns)
Here:
$2,152
State:
$2,376
(% of AGI for various income ranges: 6.1% for AGIs below $25k, 1.0% for AGIs $25k-50k)
Percentage of individuals using paid preparers for their 2012 taxes: 62.8%
Here:
63%
State:
53%
(% for various income ranges: 58.8% for AGIs below $25k, 63.0% for AGIs $25k-50k, 63.3% for AGIs $50k-75k, 66.7% for AGIs $75k-100k, 72.2% for AGIs $100k-200k)
Averages for the 2004 tax year for zip code 27019, filed in 2005:
Average Adjusted Gross Income (AGI) in 2004: $39,616 (Individual Income Tax Returns)
Here:
$39,616
State:
$45,376
Salary/wage: $37,000 (reported on 86.2% of returns)
Here:
$37,000
State:
$39,442
(% of AGI for various income ranges: 103.7% for AGIs below $10k, 72.3% for AGIs $10k-25k, 79.8% for AGIs $25k-50k, 80.8% for AGIs $50k-75k, 85.2% for AGIs $75k-100k, 77.8% for AGIs over 100k)
Taxable interest for individuals: $1,113 (reported on 43.9% of returns)
This zip code:
$1,113
North Carolina:
$1,515
(% of AGI for various income ranges: 4.6% for AGIs below $10k, 2.5% for AGIs $10k-25k, 1.1% for AGIs $25k-50k, 1.0% for AGIs $50k-75k, 0.7% for AGIs $75k-100k, 1.4% for AGIs over 100k)
Taxable dividends: $1,061 (reported on 23.3% of returns)
Here:
$1,061
State:
$4,016
(% of AGI for various income ranges: 1.7% for AGIs below $10k, 1.1% for AGIs $10k-25k, 0.5% for AGIs $25k-50k, 0.3% for AGIs $50k-75k, 0.7% for AGIs $75k-100k, 0.8% for AGIs over 100k)
Net capital gain/loss: +$1,673 (reported on 14.7% of returns)
Here:
+$1,673
State:
+$11,152
(% of AGI for various income ranges: -0.9% for AGIs below $10k, 0.5% for AGIs $10k-25k, -0.1% for AGIs $25k-50k, 0.0% for AGIs $50k-75k, 0.5% for AGIs $75k-100k, 2.9% for AGIs over 100k)
Profit/loss from business: +$6,108 (reported on 15.4% of returns)
Here:
+$6,108
State:
+$9,490
(% of AGI for various income ranges: 6.4% for AGIs below $10k, 6.8% for AGIs $10k-25k, 2.1% for AGIs $25k-50k, 3.3% for AGIs $50k-75k, 0.5% for AGIs $75k-100k, 0.4% for AGIs over 100k)
IRA payment deduction: $2,594 (reported on 1.8% of returns)
27019:
$2,594
North Carolina:
$2,967
Total itemized deductions: $14,927 (23% of AGI, reported on 34.1% of returns)
Here:
$14,927
State:
$19,464
Here:
22.5% of AGI
State:
22.7% of AGI
(% of AGI for various income ranges: 11.3% for AGIs below $10k, 10.1% for AGIs $10k-25k, 11.0% for AGIs $25k-50k, 13.2% for AGIs $50k-75k, 14.7% for AGIs $75k-100k, 14.7% for AGIs over 100k)
Charity contributions deductions: $3,069 (4% of AGI, reported on 29.6% of returns)
Here:
$3,069
State:
$4,035
Here:
4.5% of AGI
State:
4.5% of AGI
(% of AGI for various income ranges: 1.5% for AGIs $10k-25k, 1.9% for AGIs $25k-50k, 2.3% for AGIs $50k-75k, 3.0% for AGIs $75k-100k, 2.7% for AGIs over 100k)
Total tax: $4,733 (reported on 75.7% of returns)
27019:
$4,733
State:
$7,257
(% of AGI for various income ranges: 3.1% for AGIs below $10k, 4.0% for AGIs $10k-25k, 6.7% for AGIs $25k-50k, 8.3% for AGIs $50k-75k, 10.3% for AGIs $75k-100k, 15.7% for AGIs over 100k)
Earned income credit: $1,704 (reported on 15.7% of returns)
Here:
$1,704
State:
$1,851
Percentage of individuals using paid preparers for their 2004 taxes: 65.3%
Here:
65%
State:
62%
(% for various income ranges: 56.9% for AGIs below $10k, 64.8% for AGIs $10k-25k, 67.4% for AGIs $25k-50k, 70.2% for AGIs $50k-75k, 62.7% for AGIs $75k-100k, 73.4% for AGIs over 100k)
Household received Food Stamps/SNAP in the past 12 months: 175 Household did not receive Food Stamps/SNAP in the past 12 months: 1,563
Women who had a birth in the past 12 months: 47 (49 now married, 0 unmarried) Women who did not have a birth in the past 12 months: 345 (192 now married, 153 unmarried)
Housing units in zip code 27019 with a mortgage: 603 (157 second mortgage, 147 both second mortgage and home equity loan) Median monthly owner costs for units with a mortgage: $1,377 Median monthly owner costs for units without a mortgage: $311
Residents with income below the poverty level in 2022:
This zip code:
16.2%
Whole state:
12.8%
Residents with income below 50% of the poverty level in 2022:
This zip code:
10.8%
Whole state:
6.8%
Median number of rooms in houses and condos:
Here:
6.1
State:
6.4
Median number of rooms in apartments:
Here:
4.7
State:
4.4
Notable locations in this zip code not listed on our city pages
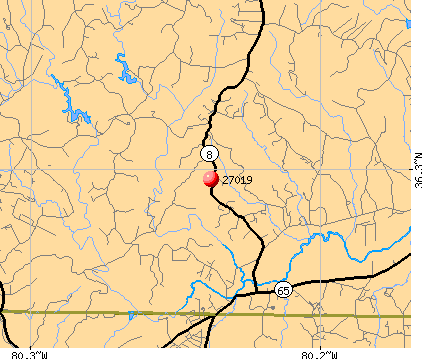
Churches in zip code 27019 include: Leak Memorial Church (A), Baux Mountain Church (B), Union Church (C), Saint Philips Episcopal Church (D), Germantown Baptist Church (E), Germanton United Methodist Church (F), Palmyra United Methodist Church (G), Peniel Pentecostal Holiness Church (H), Corinth Church of Christ (I). Display/hide their locations on the map
Creeks: Buffalo Creek (A), Red Bank Creek (B), Watts Creek (C), Voss Creek (D), Neatman Creek (E), Martin Creek (F). Display/hide their locations on the map
In group quarters: 16 (-1 institutionalized population)
Size of family households: 856 2-persons, 105 3-persons, 179 4-persons, 16 5-persons, 12 7-or-more-persons
Size of nonfamily households: 539 1-person, 38 2-persons
242 married couples with children.
84 single-parent households (74 men, 10 women).
98.8% of residents of 27019 zip code speak English at home.
1.6% of residents speak Spanish at home (100% very well).
Foreign born population: 46 (1.3%) (100.0% of them are naturalized citizens)
This zip code:
1.3%
Whole state:
8.6%
120%Haiti
29%American
23%English
13%German
5%Irish
4%Scottish
3%Jamaican
2%Czech
Year of entry for the foreign-born population
132010 or later
412000 to 2009
01990 to 1999
0Before 1990
Facilities with environmental interests located in this zip code:
ARZELL TUTTLE (3496 NC 8 HWY 65 in GERMANTON, NC)
STATE MASTER (North Carolina facility info) - -3M05FMYG00MA5WP48U66091VBX, WASTEWATER PROGRAM, WASTEWATER FACILITY National Pollutant Discharge Elimination System NON-MAJOR (Tracking pollutant discharge elimination systems) - permit Business SIC classification: NONCLASSIFIABLE ESTABLISHMENTS Alternative names: ARZELL TUTTLE TUTTLE'S, TUTTLE'S
Housing units lacking complete plumbing facilities: 1.4% Housing units lacking complete kitchen facilities: 1.4%
81.4%Electricity
6.4%Bottled, tank, or LP gas
5.6%Fuel oil, kerosene, etc.
3.2%Wood
2.0%Utility gas
1.6%Other fuel
Population in 1990: 4,428. Population change in the 1990s: +95 (+2.1%).
Place of birth for U.S.-born residents:
This state: 2,588
Northeast: 251
Midwest: 116
South: 338
West: 74
65% of the 27019 zip code residents lived in the same house 5 years ago. Out of people who lived in different houses, 56% lived in this county. Out of people who lived in different counties, 50% lived in North Carolina.
96% of the 27019 zip code residents lived in the same house 1 year ago. Out of people who lived in different houses, 80% moved from this county. Out of people who lived in different houses, 30% moved from different state.
Private vs. public school enrollment:
Students in private schools in grades 1 to 8 (elementary and middle school):
Here:
0.0%
North Carolina:
13.8%
Students in private schools in grades 9 to 12 (high school):
Here:
0.0%
North Carolina:
11.9%
Students in private undergraduate colleges: 12
Here:
29.4%
North Carolina:
19.3%
Occupation by median earnings in the past 12 months ($)
66,748Construction and extraction occupations
60,862Production occupations
60,686Installation, maintenance, and repair occupations
58,092Management occupations
52,459Education, training, and library occupations
46,420Office and administrative support occupations
Top industries in this zip code by the number of employees in 2005:
Administrative and Support and Waste Management and Remediation Services: Landscaping Services (10-19 employees: 1 establishment, 1-4 employees: 2 establishments)
Health Care and Social Assistance: Child Day Care Services (10-19: 1)
Arts, Entertainment, and Recreation: Golf Courses and Country Clubs (5-9: 1)
Construction: Plumbing, Heating, and Air-Conditioning Contractors (1-4: 3)
Construction: New Single-Family Housing Construction (except Operative Builders) (1-4: 3)
Construction: Site Preparation Contractors (1-4: 2)
Construction: Framing Contractors (1-4: 2)
Other Services (except Public Administration): Religious Organizations (1-4: 2)
Wholesale Trade: Motor Vehicle Supplies and New Parts Merchant Wholesalers (1-4: 1)
People in group quarters in 2010:
30 people in group homes for juveniles (non-correctional)
People in group quarters in 2000:
34 people in homes for the mentally retarded
Fatal accident statistics in 2014:
Fatal accident count: 1
Vehicles involved in fatal accidents: 1
Fatal accidents caused by drunken drivers: 1
Fatalities: 1
Persons involved in fatal accidents: 1
Pedestrians involved in fatal accidents: 0
Fatal accident statistics in 2013:
Fatal accident count: 1
Vehicles involved in fatal accidents: 1
Fatal accidents caused by drunken drivers: 1
Fatalities: 1
Persons involved in fatal accidents: 1
Pedestrians involved in fatal accidents: 0
Home Mortgage Disclosure Act Aggregated Statistics For Year 2009 (Based on 8 partial tracts)
A) FHA, FSA/RHS & VA Home Purchase Loans
B) Conventional Home Purchase Loans
C) Refinancings
D) Home Improvement Loans
E) Loans on Dwellings For 5+ Families
F) Non-occupant Loans on < 5 Family Dwellings (A B C & D)
G) Loans On Manufactured Home Dwelling (A B C & D)
Number
Average Value
Number
Average Value
Number
Average Value
Number
Average Value
Number
Average Value
Number
Average Value
Number
Average Value
LOANS ORIGINATED
42
$118,567
37
$126,503
149
$127,591
10
$49,595
1
$128,380
16
$81,563
13
$70,265
APPLICATIONS APPROVED, NOT ACCEPTED
1
$81,570
0
$0
10
$133,465
1
$37,530
0
$0
0
$0
0
$0
APPLICATIONS DENIED
10
$104,621
10
$87,806
83
$123,433
16
$31,088
0
$0
5
$62,832
16
$55,097
APPLICATIONS WITHDRAWN
9
$109,990
5
$205,240
55
$133,292
0
$0
0
$0
4
$81,960
3
$80,440
FILES CLOSED FOR INCOMPLETENESS
6
$124,178
0
$0
18
$138,907
2
$124,870
0
$0
1
$66,310
2
$51,315
Aggregated Statistics For Year 2008 (Based on 8 partial tracts)
A) FHA, FSA/RHS & VA Home Purchase Loans
B) Conventional Home Purchase Loans
C) Refinancings
D) Home Improvement Loans
E) Loans on Dwellings For 5+ Families
F) Non-occupant Loans on < 5 Family Dwellings (A B C & D)
G) Loans On Manufactured Home Dwelling (A B C & D)
Number
Average Value
Number
Average Value
Number
Average Value
Number
Average Value
Number
Average Value
Number
Average Value
Number
Average Value
LOANS ORIGINATED
55
$123,019
59
$111,651
153
$112,301
27
$54,193
1
$52,570
28
$77,775
27
$86,200
APPLICATIONS APPROVED, NOT ACCEPTED
0
$0
3
$71,947
31
$106,985
3
$19,420
0
$0
2
$71,675
4
$104,305
APPLICATIONS DENIED
14
$112,828
23
$99,168
140
$113,120
29
$45,732
0
$0
8
$100,420
17
$76,259
APPLICATIONS WITHDRAWN
4
$107,400
11
$123,193
49
$115,195
6
$39,912
0
$0
4
$93,882
5
$93,106
FILES CLOSED FOR INCOMPLETENESS
1
$231,460
4
$87,665
5
$126,080
1
$40,280
0
$0
1
$32,870
1
$52,310
Aggregated Statistics For Year 2007 (Based on 8 partial tracts)
A) FHA, FSA/RHS & VA Home Purchase Loans
B) Conventional Home Purchase Loans
C) Refinancings
D) Home Improvement Loans
F) Non-occupant Loans on < 5 Family Dwellings (A B C & D)
G) Loans On Manufactured Home Dwelling (A B C & D)
Number
Average Value
Number
Average Value
Number
Average Value
Number
Average Value
Number
Average Value
Number
Average Value
LOANS ORIGINATED
24
$109,326
109
$110,031
169
$104,843
33
$43,331
35
$108,797
33
$76,732
APPLICATIONS APPROVED, NOT ACCEPTED
0
$0
20
$99,338
39
$97,260
8
$40,095
3
$62,543
6
$86,030
APPLICATIONS DENIED
8
$93,538
53
$102,283
169
$111,972
34
$44,667
19
$78,852
34
$84,094
APPLICATIONS WITHDRAWN
2
$133,485
12
$122,408
75
$112,885
13
$77,337
4
$70,148
6
$55,145
FILES CLOSED FOR INCOMPLETENESS
2
$150,985
6
$126,775
12
$110,771
0
$0
0
$0
0
$0
Aggregated Statistics For Year 2006 (Based on 8 partial tracts)
A) FHA, FSA/RHS & VA Home Purchase Loans
B) Conventional Home Purchase Loans
C) Refinancings
D) Home Improvement Loans
E) Loans on Dwellings For 5+ Families
F) Non-occupant Loans on < 5 Family Dwellings (A B C & D)
G) Loans On Manufactured Home Dwelling (A B C & D)
Number
Average Value
Number
Average Value
Number
Average Value
Number
Average Value
Number
Average Value
Number
Average Value
Number
Average Value
LOANS ORIGINATED
21
$109,727
141
$92,285
176
$97,728
31
$52,318
2
$11,030,615
38
$70,788
31
$68,832
APPLICATIONS APPROVED, NOT ACCEPTED
0
$0
28
$90,284
37
$75,197
8
$57,175
0
$0
5
$117,452
12
$58,784
APPLICATIONS DENIED
3
$142,193
50
$93,888
203
$104,084
33
$51,415
0
$0
15
$78,435
34
$72,028
APPLICATIONS WITHDRAWN
2
$154,230
19
$88,783
86
$115,222
4
$60,578
0
$0
5
$69,718
7
$94,299
FILES CLOSED FOR INCOMPLETENESS
0
$0
9
$100,867
27
$128,449
0
$0
0
$0
2
$78,770
1
$89,800
Aggregated Statistics For Year 2005 (Based on 8 partial tracts)
A) FHA, FSA/RHS & VA Home Purchase Loans
B) Conventional Home Purchase Loans
C) Refinancings
D) Home Improvement Loans
F) Non-occupant Loans on < 5 Family Dwellings (A B C & D)
G) Loans On Manufactured Home Dwelling (A B C & D)
Number
Average Value
Number
Average Value
Number
Average Value
Number
Average Value
Number
Average Value
Number
Average Value
LOANS ORIGINATED
38
$101,019
131
$110,052
211
$93,954
31
$45,826
36
$72,348
36
$80,063
APPLICATIONS APPROVED, NOT ACCEPTED
1
$157,110
18
$71,588
51
$86,582
11
$26,933
1
$79,080
10
$68,912
APPLICATIONS DENIED
7
$105,376
52
$100,299
248
$98,635
38
$46,856
12
$74,008
59
$78,765
APPLICATIONS WITHDRAWN
5
$120,156
30
$99,601
106
$114,833
9
$102,784
3
$68,893
15
$88,638
FILES CLOSED FOR INCOMPLETENESS
0
$0
2
$176,805
22
$114,144
2
$99,020
0
$0
1
$45,890
Aggregated Statistics For Year 2004 (Based on 8 partial tracts)
A) FHA, FSA/RHS & VA Home Purchase Loans
B) Conventional Home Purchase Loans
C) Refinancings
D) Home Improvement Loans
E) Loans on Dwellings For 5+ Families
F) Non-occupant Loans on < 5 Family Dwellings (A B C & D)
G) Loans On Manufactured Home Dwelling (A B C & D)
Number
Average Value
Number
Average Value
Number
Average Value
Number
Average Value
Number
Average Value
Number
Average Value
Number
Average Value
LOANS ORIGINATED
26
$97,377
134
$108,732
221
$97,814
27
$44,417
1
$10,615,500
33
$68,128
28
$65,806
APPLICATIONS APPROVED, NOT ACCEPTED
7
$95,873
26
$81,318
42
$117,324
2
$36,825
0
$0
2
$88,765
18
$76,407
APPLICATIONS DENIED
7
$103,009
56
$89,556
221
$90,035
37
$44,470
0
$0
11
$75,914
61
$73,949
APPLICATIONS WITHDRAWN
4
$122,005
21
$93,682
95
$100,430
3
$99,630
0
$0
7
$88,827
10
$82,115
FILES CLOSED FOR INCOMPLETENESS
2
$125,120
5
$64,852
18
$102,394
1
$93,140
0
$0
1
$79,870
0
$0
Aggregated Statistics For Year 2003 (Based on 8 partial tracts)
A) FHA, FSA/RHS & VA Home Purchase Loans
B) Conventional Home Purchase Loans
C) Refinancings
D) Home Improvement Loans
E) Loans on Dwellings For 5+ Families
F) Non-occupant Loans on < 5 Family Dwellings (A B C & D)
Number
Average Value
Number
Average Value
Number
Average Value
Number
Average Value
Number
Average Value
Number
Average Value
LOANS ORIGINATED
23
$101,883
94
$93,490
448
$101,373
18
$29,334
1
$92,210
39
$64,801
APPLICATIONS APPROVED, NOT ACCEPTED
0
$0
16
$79,443
71
$99,550
4
$18,650
0
$0
5
$85,172
APPLICATIONS DENIED
5
$100,660
55
$74,676
192
$96,840
20
$27,826
0
$0
11
$62,306
APPLICATIONS WITHDRAWN
3
$84,587
14
$105,475
75
$97,759
1
$49,110
0
$0
3
$81,163
FILES CLOSED FOR INCOMPLETENESS
0
$0
4
$47,662
16
$95,580
0
$0
0
$0
1
$64,700
Aggregated Statistics For Year 2002 (Based on 8 partial tracts)
A) FHA, FSA/RHS & VA Home Purchase Loans
B) Conventional Home Purchase Loans
C) Refinancings
D) Home Improvement Loans
F) Non-occupant Loans on < 5 Family Dwellings (A B C & D)
Number
Average Value
Number
Average Value
Number
Average Value
Number
Average Value
Number
Average Value
LOANS ORIGINATED
24
$84,011
90
$96,319
244
$98,838
15
$17,030
23
$58,614
APPLICATIONS APPROVED, NOT ACCEPTED
1
$84,920
22
$93,198
55
$84,038
6
$29,097
1
$10,110
APPLICATIONS DENIED
3
$120,287
58
$56,133
130
$91,391
16
$23,614
7
$63,944
APPLICATIONS WITHDRAWN
1
$109,120
4
$138,055
77
$96,775
3
$14,133
3
$62,927
FILES CLOSED FOR INCOMPLETENESS
1
$103,120
2
$113,735
12
$83,723
1
$30,330
0
$0
Aggregated Statistics For Year 2001 (Based on 8 partial tracts)
A) FHA, FSA/RHS & VA Home Purchase Loans
B) Conventional Home Purchase Loans
C) Refinancings
D) Home Improvement Loans
F) Non-occupant Loans on < 5 Family Dwellings (A B C & D)
Number
Average Value
Number
Average Value
Number
Average Value
Number
Average Value
Number
Average Value
LOANS ORIGINATED
37
$93,161
123
$80,120
263
$85,915
19
$14,208
22
$48,269
APPLICATIONS APPROVED, NOT ACCEPTED
1
$107,770
31
$52,416
57
$78,004
4
$13,585
2
$90,275
APPLICATIONS DENIED
4
$67,855
76
$56,611
148
$77,610
32
$13,649
2
$60,070
APPLICATIONS WITHDRAWN
2
$111,110
15
$75,385
64
$84,757
3
$2,417
2
$82,495
FILES CLOSED FOR INCOMPLETENESS
1
$103,120
0
$0
7
$91,237
0
$0
0
$0
Aggregated Statistics For Year 2000 (Based on 8 partial tracts)
A) FHA, FSA/RHS & VA Home Purchase Loans
B) Conventional Home Purchase Loans
C) Refinancings
D) Home Improvement Loans
F) Non-occupant Loans on < 5 Family Dwellings (A B C & D)
Number
Average Value
Number
Average Value
Number
Average Value
Number
Average Value
Number
Average Value
LOANS ORIGINATED
35
$88,857
127
$80,329
123
$75,960
12
$14,833
21
$54,483
APPLICATIONS APPROVED, NOT ACCEPTED
13
$47,552
49
$60,885
42
$72,811
5
$14,552
5
$28,544
APPLICATIONS DENIED
17
$54,125
129
$56,072
118
$74,413
29
$12,380
7
$80,597
APPLICATIONS WITHDRAWN
1
$100,660
18
$75,359
67
$80,244
3
$56,297
3
$80,473
FILES CLOSED FOR INCOMPLETENESS
0
$0
3
$93,767
16
$91,409
0
$0
0
$0
Aggregated Statistics For Year 1999 (Based on 4 partial tracts)
A) FHA, FSA/RHS & VA Home Purchase Loans
B) Conventional Home Purchase Loans
C) Refinancings
D) Home Improvement Loans
F) Non-occupant Loans on < 5 Family Dwellings (A B C & D)
2002 - 2018 National Fire Incident Reporting System (NFIRS) incidents
According to the data from the years 2002 - 2018 the average number of fire incidents per year is 27. The highest number of fires - 42 took place in 2014, and the least - 10 in 2003. The data has a growing trend.
When looking into fire subcategories, the most incidents belonged to: Structure Fires (44.9%), and Outside Fires (33.1%).
Fire incident types reported to NFIRS in Zip Code 27019


 Nearest zip codes: 27045, 27052, 27021, 27105, 27051, 27109.


 According to the data from the years 2002 - 2018 the average number of fire incidents per year is 27. The highest number of fires - 42 took place in 2014, and the least - 10 in 2003. The data has a growing trend.
 When looking into fire subcategories, the most incidents belonged to: Structure Fires (44.9%), and Outside Fires (33.1%).