Estimated zip code population in 2022: 2,292 Zip code population in 2010: 2,733 Zip code population in 2000: 2,536
Houses and condos: 1,387 Renter-occupied apartments: 126
% of renters here:
12%
State:
33%
March 2022 cost of living index in zip code 27024: 79.5 (low, U.S. average is 100)
Land area: 44.1 sq. mi. Water area: 0.2 sq. mi.
Population density: 52 people per square mile
(very low).
OSM Map
General Map
Google Map
MSN Map
OSM Map
General Map
Google Map
MSN Map
OSM Map
General Map
Google Map
MSN Map
OSM Map
General Map
Google Map
MSN Map
Please wait while loading the map...
Real estate property taxes paid for housing units in 2022:
This zip code:
0.5% ($1,127)
North Carolina:
0.6% ($1,769)
Median real estate property taxes paid for housing units with mortgages in 2022: $1,244 (0.4%) Median real estate property taxes paid for housing units with no mortgage in 2022: $1,014 (0.5%)
Business Search- 14 Million verified businesses
Males: 1,247
(54.4%)
Females: 1,043
(45.6%)
For population 25 years and over in 27024:
High school or higher: 71.6%
Bachelor's degree or higher: 18.2%
Graduate or professional degree: 7.7%
Unemployed: 2.7%
Mean travel time to work (commute): 32.4 minutes
For population 15 years and over in 27024:
Never married: 24.3%
Now married: 59.1%
Separated: 1.6%
Widowed: 5.7%
Divorced: 9.3%
Zip code 27024 compared to state average:
Black race population percentage significantly below state average.
Hispanic race population percentage below state average.
Median age significantly above state average.
Foreign-born population percentage significantly below state average.
Renting percentage significantly below state average.
Length of stay since moving in significantly above state average.
Percentage of population with a bachelor's degree or higher below state average.
Estimated median house/condo value in 2022: $209,524
27024:
$209,524
North Carolina:
$280,600
According to our research of North Carolina and other state lists, there were 5 registered sex offenders living in 27024 zip code as of May 28, 2024. The ratio of all residents to sex offenders in zip code 27024 is 562 to 1. The ratio of registered sex offenders to all residents in this zip code is near the state average.
Median resident age:
This zip code:
54.5 years
North Carolina median age:
39.2 years
Average household size:
This zip code:
2.1 people
North Carolina:
2.4 people
Averages for the 2020 tax year for zip code 27024, filed in 2021:
Average Adjusted Gross Income (AGI) in 2020: $48,126 (Individual Income Tax Returns)
Here:
$48,126
State:
$70,020
Salary/wage: $43,718 (reported on 81.7% of returns)
Here:
$43,718
State:
$58,387
(% of AGI for various income ranges: 1229.3% for AGIs below $25k, 3636.5% for AGIs $25k-50k, 6283.0% for AGIs $50k-75k, 9935.7% for AGIs $75k-100k, 23986.0% for AGIs $100k-200k)
Taxable interest for individuals: $604 (reported on 26.9% of returns)
This zip code:
$604
North Carolina:
$1,479
(% of AGI for various income ranges: 11.0% for AGIs below $25k, 4.3% for AGIs $25k-50k, 28.0% for AGIs $50k-75k, 42.9% for AGIs $75k-100k, 138.0% for AGIs $100k-200k)
Ordinary dividends: $1,467 (reported on 11.5% of returns)
Here:
$1,467
State:
$7,888
(% of AGI for various income ranges: 8.6% for AGIs below $25k, 17.0% for AGIs $25k-50k, 20.0% for AGIs $50k-75k, 31.4% for AGIs $75k-100k, 140.0% for AGIs $100k-200k)
Net capital gain/loss in AGI: +$3,120 (reported on 9.6% of returns)
Here:
+$3,120
State:
+$23,652
(% of AGI for various income ranges: 47.8% for AGIs $25k-50k, 26.0% for AGIs $50k-75k, 376.0% for AGIs $100k-200k)
Profit/loss from business: +$6,462 (reported on 15.4% of returns)
Here:
+$6,462
State:
+$11,710
(% of AGI for various income ranges: 162.4% for AGIs below $25k, 161.7% for AGIs $25k-50k, 52.0% for AGIs $50k-75k, 198.6% for AGIs $75k-100k)
Taxable individual retirement arrangement distribution: $13,914 (reported on 6.7% of returns)
27024:
$13,914
North Carolina:
$20,247
(% of AGI for various income ranges: 207.0% for AGIs $25k-50k, 711.4% for AGIs $75k-100k)
Earned income credit: $2,154 (reported on 23.1% of returns)
Here:
$2,154
State:
$2,337
(% of AGI for various income ranges: 119.0% for AGIs below $25k, 74.8% for AGIs $25k-50k)
Percentage of individuals using paid preparers for their 2020 taxes: 92.3%
Here:
92%
State:
93%
(% for various income ranges: 90.5% for AGIs below $25k, 96.3% for AGIs $25k-50k, 92.9% for AGIs $50k-75k, 90.0% for AGIs $75k-100k, 90.9% for AGIs $100k-200k)
Averages for the 2012 tax year for zip code 27024, filed in 2013:
Average Adjusted Gross Income (AGI) in 2012: $35,620 (Individual Income Tax Returns)
Here:
$35,620
State:
$54,937
Salary/wage: $33,886 (reported on 82.7% of returns)
Here:
$33,886
State:
$46,336
(% of AGI for various income ranges: 71.5% for AGIs below $25k, 81.4% for AGIs $25k-50k, 82.9% for AGIs $50k-75k, 76.7% for AGIs $75k-100k, 76.9% for AGIs $100k-200k)
Taxable interest for individuals: $564 (reported on 28.6% of returns)
This zip code:
$564
North Carolina:
$1,298
(% of AGI for various income ranges: 1.0% for AGIs below $25k, 0.2% for AGIs $25k-50k, 0.4% for AGIs $50k-75k, 0.5% for AGIs $75k-100k, 0.4% for AGIs $100k-200k)
Ordinary dividends: $740 (reported on 10.2% of returns)
Here:
$740
State:
$6,213
(% of AGI for various income ranges: 0.5% for AGIs below $25k, 0.4% for AGIs $25k-50k, 0.3% for AGIs $75k-100k)
Net capital gain/loss in AGI: +$467 (reported on 6.1% of returns)
Here:
+$467
State:
+$12,740
Profit/loss from business: +$6,233 (reported on 18.4% of returns)
Here:
+$6,233
State:
+$10,311
(% of AGI for various income ranges: 9.7% for AGIs below $25k, 4.1% for AGIs $25k-50k, 1.1% for AGIs $50k-75k, 1.9% for AGIs $75k-100k)
Taxable individual retirement arrangement distribution: $8,843 (reported on 7.1% of returns)
27024:
$8,843
North Carolina:
$15,575
(% of AGI for various income ranges: 3.1% for AGIs below $25k, 2.0% for AGIs $25k-50k, 3.0% for AGIs $50k-75k)
Total itemized deductions: $18,959 (25% of AGI, reported on 17.3% of returns)
Here:
$18,959
State:
$23,438
Here:
25.1% of AGI
State:
21.5% of AGI
(% of AGI for various income ranges: 10.6% for AGIs $25k-50k, 8.8% for AGIs $50k-75k, 11.3% for AGIs $75k-100k, 14.3% for AGIs $100k-200k)
Charity contributions: $2,769 (reported on 13.3% of returns)
Here:
$2,769
State:
$4,687
(% of AGI for various income ranges: 0.8% for AGIs $25k-50k, 1.1% for AGIs $50k-75k, 1.7% for AGIs $75k-100k, 1.6% for AGIs $100k-200k)
Taxes paid: $5,665 (reported on 17.3% of returns)
27024:
$5,665
State:
$8,823
(% of AGI for various income ranges: 1.8% for AGIs $25k-50k, 2.4% for AGIs $50k-75k, 4.0% for AGIs $75k-100k, 6.1% for AGIs $100k-200k)
Earned income credit: $2,028 (reported on 29.6% of returns)
Here:
$2,028
State:
$2,376
(% of AGI for various income ranges: 7.7% for AGIs below $25k, 1.6% for AGIs $25k-50k)
Percentage of individuals using paid preparers for their 2012 taxes: 62.2%
Here:
62%
State:
53%
(% for various income ranges: 59.6% for AGIs below $25k, 65.4% for AGIs $25k-50k, 64.3% for AGIs $50k-75k, 66.7% for AGIs $75k-100k, 60.0% for AGIs $100k-200k)
Averages for the 2004 tax year for zip code 27024, filed in 2005:
Average Adjusted Gross Income (AGI) in 2004: $29,888 (Individual Income Tax Returns)
Here:
$29,888
State:
$45,376
Salary/wage: $28,509 (reported on 86.5% of returns)
Here:
$28,509
State:
$39,442
(% of AGI for various income ranges: 122.3% for AGIs below $10k, 77.6% for AGIs $10k-25k, 87.3% for AGIs $25k-50k, 83.0% for AGIs $50k-75k, 83.9% for AGIs $75k-100k, 63.8% for AGIs over 100k)
Taxable interest for individuals: $583 (reported on 34.7% of returns)
This zip code:
$583
North Carolina:
$1,515
(% of AGI for various income ranges: 3.8% for AGIs below $10k, 1.0% for AGIs $10k-25k, 0.6% for AGIs $25k-50k, 0.5% for AGIs $50k-75k, 0.2% for AGIs $75k-100k, 0.5% for AGIs over 100k)
Taxable dividends: $982 (reported on 11.3% of returns)
Here:
$982
State:
$4,016
(% of AGI for various income ranges: 1.4% for AGIs below $10k, 0.1% for AGIs $10k-25k, 0.4% for AGIs $25k-50k, 0.5% for AGIs $50k-75k, 0.5% for AGIs $75k-100k)
Net capital gain/loss: +$1,742 (reported on 9.7% of returns)
Here:
+$1,742
State:
+$11,152
(% of AGI for various income ranges: 0.7% for AGIs $10k-25k, 0.9% for AGIs $25k-50k, 0.4% for AGIs $50k-75k, 0.1% for AGIs $75k-100k)
Profit/loss from business: +$6,725 (reported on 19.9% of returns)
Here:
+$6,725
State:
+$9,490
(% of AGI for various income ranges: 18.8% for AGIs below $10k, 11.2% for AGIs $10k-25k, 3.4% for AGIs $25k-50k, 3.6% for AGIs $50k-75k)
IRA payment deduction: $3,125 (reported on 2.4% of returns)
27024:
$3,125
North Carolina:
$2,967
Total itemized deductions: $15,351 (27% of AGI, reported on 20.4% of returns)
Here:
$15,351
State:
$19,464
Here:
27.0% of AGI
State:
22.7% of AGI
(% of AGI for various income ranges: 7.7% for AGIs $10k-25k, 8.1% for AGIs $25k-50k, 11.0% for AGIs $50k-75k, 19.1% for AGIs $75k-100k, 15.9% for AGIs over 100k)
Charity contributions deductions: $2,536 (5% of AGI, reported on 15.3% of returns)
Here:
$2,536
State:
$4,035
Here:
4.5% of AGI
State:
4.5% of AGI
(% of AGI for various income ranges: 1.0% for AGIs $10k-25k, 0.8% for AGIs $25k-50k, 2.0% for AGIs $50k-75k, 2.4% for AGIs $75k-100k, 1.0% for AGIs over 100k)
Total tax: $3,184 (reported on 71.7% of returns)
27024:
$3,184
State:
$7,257
(% of AGI for various income ranges: 5.4% for AGIs below $10k, 4.1% for AGIs $10k-25k, 5.8% for AGIs $25k-50k, 8.5% for AGIs $50k-75k, 10.2% for AGIs $75k-100k, 15.8% for AGIs over 100k)
Earned income credit: $1,857 (reported on 25.7% of returns)
Here:
$1,857
State:
$1,851
Percentage of individuals using paid preparers for their 2004 taxes: 74.1%
Here:
74%
State:
62%
(% for various income ranges: 71.9% for AGIs below $10k, 74.2% for AGIs $10k-25k, 74.6% for AGIs $25k-50k, 75.6% for AGIs $50k-75k, 77.8% for AGIs $75k-100k, 72.7% for AGIs over 100k)
Likely homosexual households (counted as self-reported same-sex unmarried-partner households)
Lesbian couples: 1.7% of all households
Gay men: 0.0% of all households
Household received Food Stamps/SNAP in the past 12 months: 200 Household did not receive Food Stamps/SNAP in the past 12 months: 894
Women who did not have a birth in the past 12 months: 440 (214 now married, 226 unmarried)
Housing units in zip code 27024 with a mortgage: 384 (69 second mortgage, 72 both second mortgage and home equity loan) Median monthly owner costs for units with a mortgage: $1,221 Median monthly owner costs for units without a mortgage: $373
Residents with income below the poverty level in 2022:
This zip code:
20.2%
Whole state:
12.8%
Residents with income below 50% of the poverty level in 2022:
This zip code:
19.2%
Whole state:
6.8%
Median number of rooms in houses and condos:
Here:
6.0
State:
6.4
Median number of rooms in apartments:
Here:
5.4
State:
4.4
Notable locations in this zip code not listed on our city pages
Churches in zip code 27024 include: Ivy Green Baptist Church (A), Liberty Church (B), Mountain View Baptist Church (C), Mount Vernon Church (D), Mount View Church (E), Roaring Gap Baptist Church (F), Round Peak Church (G), Fisher Gap Primitive Baptist Church (H). Display/hide their locations on the map
Streams, rivers, and creeks: Roaring Fork (A), Ramey Creek (B), Camp Branch (C), Camp Creek (D), Williams Creek (E), Gully Creek (F). Display/hide their locations on the map
In group quarters: 20 (-1 institutionalized population)
Size of family households: 559 2-persons, 127 3-persons, 69 4-persons, 36 5-persons
Size of nonfamily households: 261 1-person, 24 2-persons, 15 5-persons
167 married couples with children.
76 single-parent households (7 men, 69 women).
98.0% of residents of 27024 zip code speak English at home.
0.4% of residents speak Spanish at home (100% well).
1.9% of residents speak other Indo-European language at home (52% very well, 48% well).
Foreign born population: 6 (0.3%) (100.0% of them are naturalized citizens)
This zip code:
0.3%
Whole state:
8.6%
100%France
30%American
18%English
8%French
6%Irish
4%German
4%Polish
1%Italian
Year of entry for the foreign-born population
02010 or later
02000 to 2009
171990 to 1999
14Before 1990
Facilities with environmental interests located in this zip code:
CEDAR RIDGE ELEMENTARY (734 FLIPPIN ROAD in LOWGAP, NC)
(National Center for Education Statistics) - STATE ID-302 Organizations: SURRY COUNTY SCHOOLS (SCHOOL DISTRICT)
Housing units lacking complete plumbing facilities: 2.0% Housing units lacking complete kitchen facilities: 6.2%
61.0%Electricity
13.3%Bottled, tank, or LP gas
9.5%Utility gas
8.7%Wood
7.7%Fuel oil, kerosene, etc.
Population in 1990: 5,065.
Place of birth for U.S.-born residents:
This state: 1,758
Northeast: 145
Midwest: 91
South: 233
63% of the 27024 zip code residents lived in the same house 5 years ago. Out of people who lived in different houses, 68% lived in this county. Out of people who lived in different counties, 50% lived in North Carolina.
98% of the 27024 zip code residents lived in the same house 1 year ago. Out of people who lived in different houses, 96% moved from this county. Out of people who lived in different houses, 22% moved from different county within same state.
Private vs. public school enrollment:
Students in private schools in grades 1 to 8 (elementary and middle school): 28
Here:
29.8%
North Carolina:
13.8%
Students in private schools in grades 9 to 12 (high school):
Here:
0.0%
North Carolina:
11.9%
Students in private undergraduate colleges: 28
Here:
32.0%
North Carolina:
19.3%
Occupation by median earnings in the past 12 months ($)
153,818Production occupations
92,773Health diagnosing and treating practitioners and other technical occupations
55,886Education, training, and library occupations
51,284Management occupations
50,191Office and administrative support occupations
47,162Installation, maintenance, and repair occupations
Top industries in this zip code by the number of employees in 2005:
Construction: Industrial Building Construction (20-49 employees: 1 establishment)
Health Care and Social Assistance: Other Residential Care Facilities (20-49: 1)
Construction: Other Foundation, Structure, and Building Exterior Contractors (5-9: 1)
Construction: New Single-Family Housing Construction (except Operative Builders) (1-4: 2)
60 people in group homes for juveniles (non-correctional)
4 people in workers' group living quarters and job corps centers
People in group quarters in 2000:
61 people in training schools for juvenile delinquents
2 people in other noninstitutional group quarters
Fatal accident statistics in 2014:
Fatal accident count: 1
Vehicles involved in fatal accidents: 1
Fatal accidents caused by drunken drivers: 1
Fatalities: 1
Persons involved in fatal accidents: 2
Pedestrians involved in fatal accidents: 0
2002 - 2018 National Fire Incident Reporting System (NFIRS) incidents
Based on the data from the years 2002 - 2018 the average number of fires per year is 16. The highest number of reported fires - 38 took place in 2011, and the least - 0 in 2003. The data has a growing trend.
When looking into fire subcategories, the most incidents belonged to: Structure Fires (49.3%), and Outside Fires (33.9%).
Fire incident types reported to NFIRS in Zip Code 27024

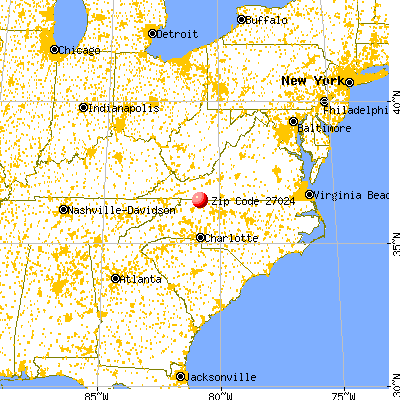


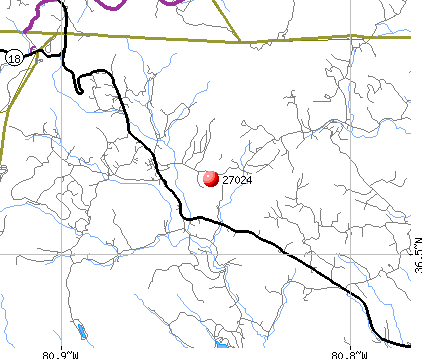 Nearest zip codes: 24351, 28623, 28683, 24333, 27017, 28627.


 Based on the data from the years 2002 - 2018 the average number of fires per year is 16. The highest number of reported fires - 38 took place in 2011, and the least - 0 in 2003. The data has a growing trend.
 When looking into fire subcategories, the most incidents belonged to: Structure Fires (49.3%), and Outside Fires (33.9%).