Estimated zip code population in 2022: 13,840 Zip code population in 2010: 11,735 Zip code population in 2000: 8,008
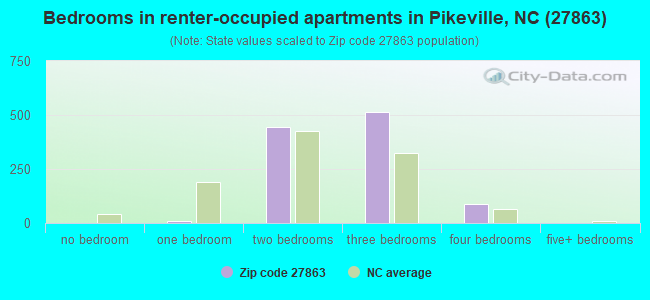
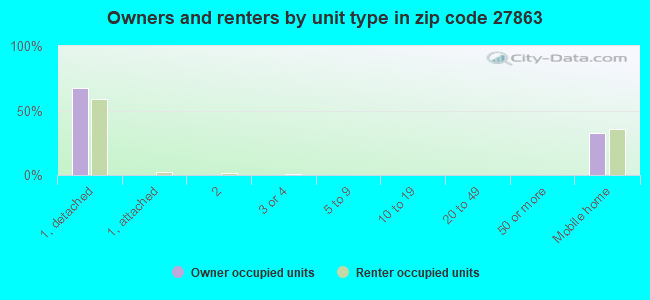
Houses and condos: 5,315 Renter-occupied apartments: 1,060
% of renters here:
21%
State:
33%
March 2022 cost of living index in zip code 27863: 79.4 (low, U.S. average is 100)
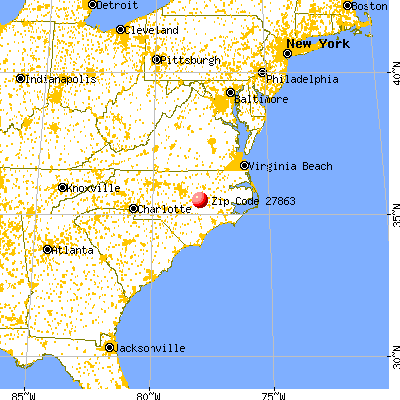
Land area: 67.6 sq. mi. Water area: 0.2 sq. mi.
Population density: 205 people per square mile
(very low).
OSM Map
General Map
Google Map
MSN Map
OSM Map
General Map
Google Map
MSN Map
OSM Map
General Map
Google Map
MSN Map
OSM Map
General Map
Google Map
MSN Map
Please wait while loading the map...
Real estate property taxes paid for housing units in 2022:
This zip code:
0.6% ($1,048)
North Carolina:
0.6% ($1,769)
Median real estate property taxes paid for housing units with mortgages in 2022: $1,147 (0.6%) Median real estate property taxes paid for housing units with no mortgage in 2022: $758 (0.6%)
Estimated median house/condo value in 2022: $182,288
27863:
$182,288
North Carolina:
$280,600
According to our research of North Carolina and other state lists, there were 21 registered sex offenders living in 27863 zip code as of May 28, 2024. The ratio of all residents to sex offenders in zip code 27863 is 580 to 1. The ratio of registered sex offenders to all residents in this zip code is near the state average.
Median resident age:
This zip code:
36.1 years
North Carolina median age:
39.2 years
Average household size:
This zip code:
2.7 people
North Carolina:
2.4 people
Averages for the 2020 tax year for zip code 27863, filed in 2021:
Average Adjusted Gross Income (AGI) in 2020: $52,383 (Individual Income Tax Returns)
Here:
$52,383
State:
$70,020
Salary/wage: $47,589 (reported on 86.3% of returns)
Here:
$47,589
State:
$58,387
(% of AGI for various income ranges: 1245.9% for AGIs below $25k, 3784.9% for AGIs $25k-50k, 6740.3% for AGIs $50k-75k, 10072.1% for AGIs $75k-100k, 18901.0% for AGIs $100k-200k, 44620.0% for AGIs over 200k)
Taxable interest for individuals: $637 (reported on 23.5% of returns)
This zip code:
$637
North Carolina:
$1,479
(% of AGI for various income ranges: 7.5% for AGIs below $25k, 9.0% for AGIs $25k-50k, 18.9% for AGIs $50k-75k, 31.9% for AGIs $75k-100k, 63.1% for AGIs $100k-200k, 506.7% for AGIs over 200k)
Ordinary dividends: $2,165 (reported on 8.7% of returns)
Here:
$2,165
State:
$7,888
(% of AGI for various income ranges: 5.6% for AGIs below $25k, 8.7% for AGIs $25k-50k, 22.7% for AGIs $50k-75k, 47.9% for AGIs $75k-100k, 86.9% for AGIs $100k-200k, 750.0% for AGIs over 200k)
Net capital gain/loss in AGI: +$6,696 (reported on 8.3% of returns)
Here:
+$6,696
State:
+$23,652
(% of AGI for various income ranges: 9.9% for AGIs below $25k, 17.7% for AGIs $25k-50k, 32.1% for AGIs $50k-75k, 80.0% for AGIs $75k-100k, 282.1% for AGIs $100k-200k, 4333.3% for AGIs over 200k)
Profit/loss from business: +$6,361 (reported on 14.0% of returns)
Here:
+$6,361
State:
+$11,710
(% of AGI for various income ranges: 97.5% for AGIs below $25k, 99.8% for AGIs $25k-50k, 137.9% for AGIs $50k-75k, 136.2% for AGIs $75k-100k, 256.9% for AGIs $100k-200k)
Taxable individual retirement arrangement distribution: $11,119 (reported on 6.2% of returns)
27863:
$11,119
North Carolina:
$20,247
(% of AGI for various income ranges: 36.8% for AGIs below $25k, 40.0% for AGIs $25k-50k, 97.0% for AGIs $50k-75k, 242.6% for AGIs $75k-100k, 339.2% for AGIs $100k-200k)
Total itemized deductions: $27,316 (reported on 4.2% of returns)
Here:
$27,316
State:
$34,549
(% of AGI for various income ranges: 103.0% for AGIs $25k-50k, 123.0% for AGIs $50k-75k, 281.0% for AGIs $75k-100k, 594.6% for AGIs $100k-200k, 3660.0% for AGIs over 200k)
Charity contributions: $9,765 (reported on 3.3% of returns)
Here:
$9,765
State:
$13,360
(% of AGI for various income ranges: 18.0% for AGIs $25k-50k, 25.5% for AGIs $50k-75k, 84.5% for AGIs $75k-100k, 210.5% for AGIs $100k-200k, 1196.7% for AGIs over 200k)
Taxes paid: $5,692 (reported on 4.2% of returns)
27863:
$5,692
State:
$7,586
(% of AGI for various income ranges: 11.7% for AGIs $25k-50k, 23.9% for AGIs $50k-75k, 53.3% for AGIs $75k-100k, 159.0% for AGIs $100k-200k, 850.0% for AGIs over 200k)
Earned income credit: $2,392 (reported on 19.4% of returns)
Here:
$2,392
State:
$2,337
(% of AGI for various income ranges: 109.9% for AGIs below $25k, 83.3% for AGIs $25k-50k, 2.1% for AGIs $50k-75k)
Percentage of individuals using paid preparers for their 2020 taxes: 92.7%
Here:
93%
State:
93%
(% for various income ranges: 91.4% for AGIs below $25k, 93.3% for AGIs $25k-50k, 92.8% for AGIs $50k-75k, 93.4% for AGIs $75k-100k, 94.4% for AGIs $100k-200k, 88.9% for AGIs over 200k)
Averages for the 2012 tax year for zip code 27863, filed in 2013:
Average Adjusted Gross Income (AGI) in 2012: $43,908 (Individual Income Tax Returns)
Here:
$43,908
State:
$54,937
Salary/wage: $39,222 (reported on 88.5% of returns)
Here:
$39,222
State:
$46,336
(% of AGI for various income ranges: 77.9% for AGIs below $25k, 84.6% for AGIs $25k-50k, 83.3% for AGIs $50k-75k, 82.3% for AGIs $75k-100k, 81.7% for AGIs $100k-200k, 34.4% for AGIs over 200k)
Taxable interest for individuals: $740 (reported on 27.9% of returns)
This zip code:
$740
North Carolina:
$1,298
(% of AGI for various income ranges: 0.8% for AGIs below $25k, 0.4% for AGIs $25k-50k, 0.4% for AGIs $50k-75k, 0.3% for AGIs $75k-100k, 0.4% for AGIs $100k-200k, 1.1% for AGIs over 200k)
Ordinary dividends: $1,638 (reported on 9.4% of returns)
Here:
$1,638
State:
$6,213
(% of AGI for various income ranges: 0.4% for AGIs below $25k, 0.3% for AGIs $25k-50k, 0.2% for AGIs $50k-75k, 0.2% for AGIs $75k-100k, 0.6% for AGIs $100k-200k, 0.6% for AGIs over 200k)
Net capital gain/loss in AGI: +$3,155 (reported on 8.6% of returns)
Here:
+$3,155
State:
+$12,740
(% of AGI for various income ranges: 0.1% for AGIs $25k-50k, 0.3% for AGIs $50k-75k, 0.3% for AGIs $75k-100k, 0.7% for AGIs $100k-200k, 4.9% for AGIs over 200k)
Profit/loss from business: +$7,610 (reported on 13.1% of returns)
Here:
+$7,610
State:
+$10,311
(% of AGI for various income ranges: 5.5% for AGIs below $25k, 2.8% for AGIs $25k-50k, 1.7% for AGIs $50k-75k, 1.7% for AGIs $75k-100k, 1.6% for AGIs $100k-200k)
Taxable individual retirement arrangement distribution: $8,750 (reported on 6.2% of returns)
27863:
$8,750
North Carolina:
$15,575
(% of AGI for various income ranges: 1.8% for AGIs below $25k, 1.2% for AGIs $25k-50k, 1.0% for AGIs $50k-75k, 1.1% for AGIs $75k-100k, 1.9% for AGIs $100k-200k)
Total itemized deductions: $18,080 (23% of AGI, reported on 29.2% of returns)
Here:
$18,080
State:
$23,438
Here:
22.9% of AGI
State:
21.5% of AGI
(% of AGI for various income ranges: 6.6% for AGIs below $25k, 9.5% for AGIs $25k-50k, 12.5% for AGIs $50k-75k, 14.7% for AGIs $75k-100k, 16.8% for AGIs $100k-200k, 9.5% for AGIs over 200k)
Charity contributions: $4,192 (reported on 23.8% of returns)
Here:
$4,192
State:
$4,687
(% of AGI for various income ranges: 0.9% for AGIs below $25k, 1.7% for AGIs $25k-50k, 2.3% for AGIs $50k-75k, 2.7% for AGIs $75k-100k, 3.5% for AGIs $100k-200k, 2.1% for AGIs over 200k)
Taxes paid: $5,655 (reported on 29.2% of returns)
27863:
$5,655
State:
$8,823
(% of AGI for various income ranges: 1.0% for AGIs below $25k, 2.0% for AGIs $25k-50k, 3.5% for AGIs $50k-75k, 4.8% for AGIs $75k-100k, 6.8% for AGIs $100k-200k, 5.1% for AGIs over 200k)
Earned income credit: $2,381 (reported on 24.2% of returns)
Here:
$2,381
State:
$2,376
(% of AGI for various income ranges: 7.8% for AGIs below $25k, 1.7% for AGIs $25k-50k)
Percentage of individuals using paid preparers for their 2012 taxes: 48.9%
Here:
49%
State:
53%
(% for various income ranges: 46.8% for AGIs below $25k, 45.1% for AGIs $25k-50k, 53.7% for AGIs $50k-75k, 56.2% for AGIs $75k-100k, 53.1% for AGIs $100k-200k, 75.0% for AGIs over 200k)
Averages for the 2004 tax year for zip code 27863, filed in 2005:
Average Adjusted Gross Income (AGI) in 2004: $36,399 (Individual Income Tax Returns)
Here:
$36,399
State:
$45,376
Salary/wage: $34,245 (reported on 88.0% of returns)
Here:
$34,245
State:
$39,442
(% of AGI for various income ranges: 92.3% for AGIs below $10k, 80.3% for AGIs $10k-25k, 85.8% for AGIs $25k-50k, 87.7% for AGIs $50k-75k, 84.5% for AGIs $75k-100k, 63.8% for AGIs over 100k)
Taxable interest for individuals: $783 (reported on 33.6% of returns)
This zip code:
$783
North Carolina:
$1,515
(% of AGI for various income ranges: 2.5% for AGIs below $10k, 1.0% for AGIs $10k-25k, 0.6% for AGIs $25k-50k, 0.4% for AGIs $50k-75k, 0.7% for AGIs $75k-100k, 1.2% for AGIs over 100k)
Taxable dividends: $1,041 (reported on 12.0% of returns)
Here:
$1,041
State:
$4,016
(% of AGI for various income ranges: 0.5% for AGIs below $10k, 0.2% for AGIs $10k-25k, 0.2% for AGIs $25k-50k, 0.2% for AGIs $50k-75k, 0.5% for AGIs $75k-100k, 0.8% for AGIs over 100k)
Net capital gain/loss: +$4,974 (reported on 8.6% of returns)
Here:
+$4,974
State:
+$11,152
(% of AGI for various income ranges: 1.0% for AGIs below $10k, -0.0% for AGIs $10k-25k, 0.4% for AGIs $25k-50k, 0.5% for AGIs $50k-75k, 0.5% for AGIs $75k-100k, 6.7% for AGIs over 100k)
Profit/loss from business: +$6,513 (reported on 14.2% of returns)
Here:
+$6,513
State:
+$9,490
(% of AGI for various income ranges: 6.8% for AGIs below $10k, 5.0% for AGIs $10k-25k, 2.6% for AGIs $25k-50k, 1.9% for AGIs $50k-75k, 1.4% for AGIs $75k-100k, 1.9% for AGIs over 100k)
Profit/loss from farming: +$5,355 (reported on 1.5% of returns)
Here:
+$5,355
State:
-$3,231
(% of AGI for various income ranges: 2.4% for AGIs below $10k, 0.0% for AGIs $25k-50k, 0.0% for AGIs $50k-75k, 1.0% for AGIs $75k-100k)
IRA payment deduction: $3,107 (reported on 2.5% of returns)
27863:
$3,107
North Carolina:
$2,967
(% of AGI for various income ranges: 0.2% for AGIs $10k-25k, 0.3% for AGIs $25k-50k, 0.2% for AGIs $50k-75k, 0.4% for AGIs $75k-100k)
Total itemized deductions: $14,606 (23% of AGI, reported on 30.8% of returns)
Here:
$14,606
State:
$19,464
Here:
23.5% of AGI
State:
22.7% of AGI
(% of AGI for various income ranges: 10.5% for AGIs below $10k, 6.4% for AGIs $10k-25k, 11.2% for AGIs $25k-50k, 14.3% for AGIs $50k-75k, 15.8% for AGIs $75k-100k, 13.3% for AGIs over 100k)
Charity contributions deductions: $3,139 (5% of AGI, reported on 27.0% of returns)
Here:
$3,139
State:
$4,035
Here:
4.9% of AGI
State:
4.5% of AGI
(% of AGI for various income ranges: 0.6% for AGIs below $10k, 1.0% for AGIs $10k-25k, 1.9% for AGIs $25k-50k, 2.8% for AGIs $50k-75k, 3.2% for AGIs $75k-100k, 2.9% for AGIs over 100k)
Total tax: $4,093 (reported on 72.4% of returns)
27863:
$4,093
State:
$7,257
(% of AGI for various income ranges: 2.9% for AGIs below $10k, 3.6% for AGIs $10k-25k, 5.9% for AGIs $25k-50k, 8.0% for AGIs $50k-75k, 9.7% for AGIs $75k-100k, 17.4% for AGIs over 100k)
Earned income credit: $1,934 (reported on 20.3% of returns)
Here:
$1,934
State:
$1,851
Percentage of individuals using paid preparers for their 2004 taxes: 62.0%
Here:
62%
State:
62%
(% for various income ranges: 53.9% for AGIs below $10k, 66.5% for AGIs $10k-25k, 63.3% for AGIs $25k-50k, 59.0% for AGIs $50k-75k, 61.9% for AGIs $75k-100k, 73.0% for AGIs over 100k)
Household received Food Stamps/SNAP in the past 12 months: 891 Household did not receive Food Stamps/SNAP in the past 12 months: 4,179
Women who had a birth in the past 12 months: 296 (216 now married, 81 unmarried) Women who did not have a birth in the past 12 months: 3,049 (1,474 now married, 1,578 unmarried)
Housing units in zip code 27863 with a mortgage: 2,873 (187 second mortgage, 11 home equity loan, 167 both second mortgage and home equity loan) Houses without a mortgage: 9
Median monthly owner costs for units with a mortgage: $1,201 Median monthly owner costs for units without a mortgage: $397
Residents with income below the poverty level in 2022:
This zip code:
10.3%
Whole state:
12.8%
Residents with income below 50% of the poverty level in 2022:
This zip code:
6.7%
Whole state:
6.8%
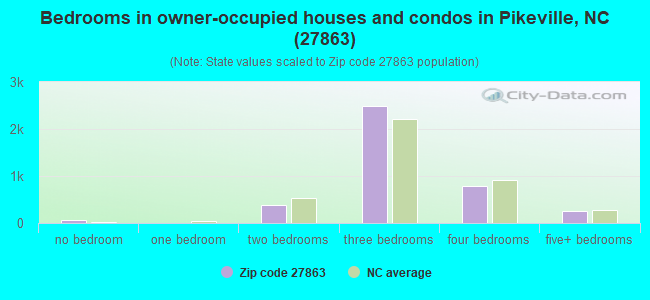
Median number of rooms in houses and condos:
Here:
6.1
State:
6.4
Median number of rooms in apartments:
Here:
5.0
State:
4.4
Notable locations in this zip code not listed on our city pages
Notable locations in zip code 27863: Pikeville Police Department (A), Wayne County Public Library - Pikeville Branch (B). Display/hide their locations on the map
Churches in zip code 27863 include: Hooks Grove Church (A), White Oak Grove Church (B), Little Nahunta Church (C), Mount Carmel Church (D), Antioch Church (E), Little Rock Church (F), Browns Chapel (G), White Oak Church (H), Mount Zion Church (I). Display/hide their locations on the map
Streams, rivers, and creeks: Dennis Branch (A), Long Branch (B), Granny Branch (C), Buck Meadow Branch (D), Poplar Branch (E), Button Branch (F), Beaver Dam (G), Beaver Branch (H), The Slough (I). Display/hide their locations on the map
In group quarters: 37 (-1 institutionalized population)
Size of family households: 1,812 2-persons, 1,002 3-persons, 693 4-persons, 287 5-persons, 360 6-persons, 55 7-or-more-persons
Size of nonfamily households: 561 1-person, 269 2-persons, 22 3-persons
2,353 married couples with children.
908 single-parent households (212 men, 696 women).
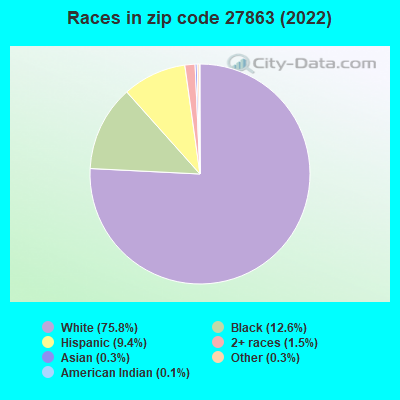
90.8% of residents of 27863 zip code speak English at home.
6.2% of residents speak Spanish at home (67% very well, 3% well, 30% not well).
1.9% of residents speak other Indo-European language at home (100% very well).
0.4% of residents speak Asian or Pacific Island language at home (100% well).
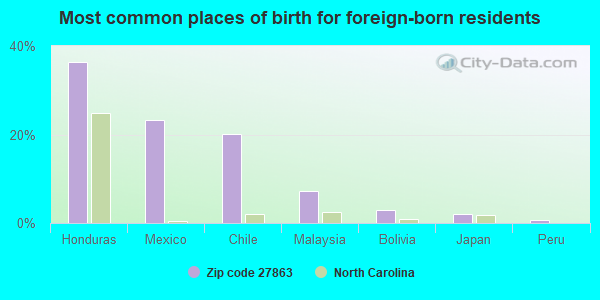
Foreign born population: 494 (3.6%) (51.9% of them are naturalized citizens)
This zip code:
3.6%
Whole state:
8.6%
36%Honduras
23%Mexico
20%Chile
7%Malaysia
3%Bolivia
2%Japan
1%Peru
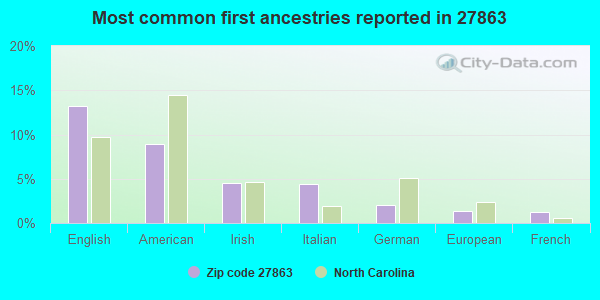
13%English
9%American
5%Irish
4%Italian
2%German
1%European
1%French
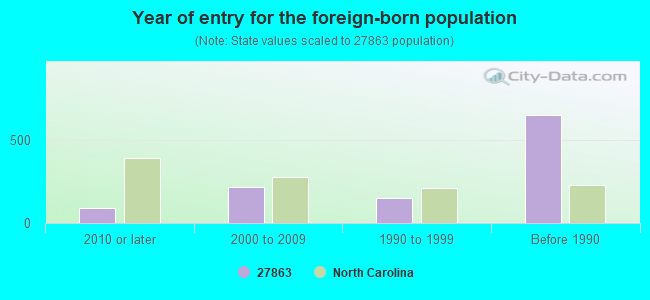
Year of entry for the foreign-born population
932010 or later
2192000 to 2009
1511990 to 1999
649Before 1990
Facilities with environmental interests located in this zip code:
AYCOCK HIGH SCHOOL (5460 US 117 N in PIKEVILLE, NC)
(Geographic Names Information System) (National Center for Education Statistics) - STATE ID-324 Organizations: WAYNE COUNTY PUBLIC SCHOOLS (SCHOOL DISTRICT)
Alternative names: CHARLES B AYCOCK HIGH
Housing units lacking complete plumbing facilities: 0.1% Housing units lacking complete kitchen facilities: 0.4%
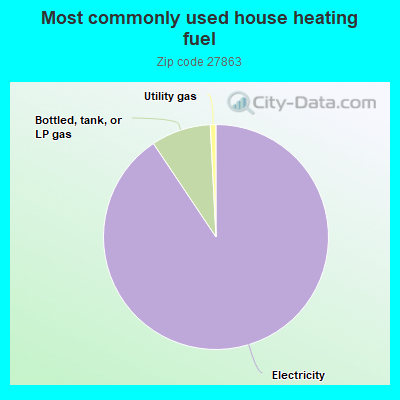
89.8%Electricity
8.5%Bottled, tank, or LP gas
0.8%Utility gas
Population in 1990: 1,968. Population change in the 1990s: +6,040 (+306.9%).
Place of birth for U.S.-born residents:
This state: 8,629
Northeast: 1,086
Midwest: 949
South: 1,377
West: 583
58% of the 27863 zip code residents lived in the same house 5 years ago. Out of people who lived in different houses, 67% lived in this county. Out of people who lived in different counties, 50% lived in North Carolina.
90% of the 27863 zip code residents lived in the same house 1 year ago. Out of people who lived in different houses, 40% moved from this county. Out of people who lived in different houses, 49% moved from different county within same state. Out of people who lived in different houses, 12% moved from different state.
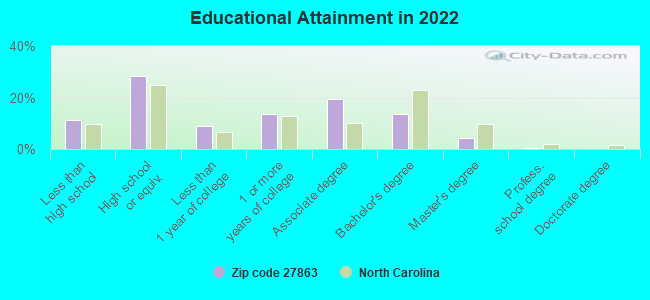
Private vs. public school enrollment:
Students in private schools in grades 1 to 8 (elementary and middle school): 119
Here:
6.9%
North Carolina:
13.8%
Students in private schools in grades 9 to 12 (high school): 62
Here:
9.0%
North Carolina:
11.9%
Students in private undergraduate colleges: 52
Here:
7.9%
North Carolina:
19.3%
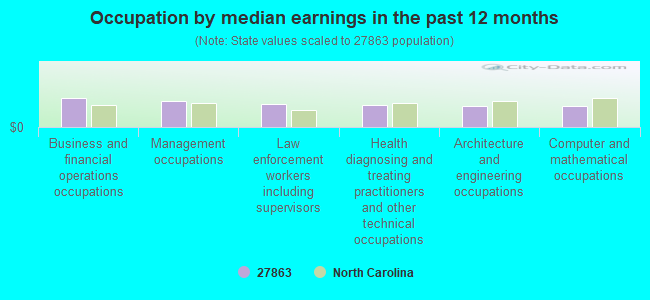
Occupation by median earnings in the past 12 months ($)
75,382Business and financial operations occupations
66,385Management occupations
58,299Law enforcement workers including supervisors
55,695Health diagnosing and treating practitioners and other technical occupations
55,229Architecture and engineering occupations
54,442Computer and mathematical occupations
Companies with federal contracts located in this zip code:
LANDSCAPE DESIGN OF GOLDSBORO, (380 WASHINGTON STREET in PIKEVILLE, NC; small business) : $4,372,490 in 19 contractsfrom 2000 to 2005
Contracts for Maintenance, Repair or Alteration of Real Property -- Other Non-Building Facilities, Landscaping/Groundskeeping Services, Construction of Structures and Facilities -- Family Housing Facilities by Air Force Signed by year:2000: $4,075,931; 2001: $34,535; 2002: $15,044; 2003: $0; 2004: $246,100; 2005: $880; 2006: $0.
Biggest contracts:
$2,443,800 with Air Force for Maintenance, Repair or Alteration of Real Property -- Other Non-Building Facilities. Signed on 2000-11-15. Completion date: 2000-11-06.
$1,562,190, same as above.Signed on 2000-12-08. Completion date: 2000-01-04.
$139,200 with Air Force for Landscaping/Groundskeeping Services. Signed on 2004-08-06. Completion date: 2004-08-12.
$80,000, same as above.Signed on 2004-09-23. Completion date: 2008-08-12.
SIG AVIATION LLC (240 AVIATION RD in PIKEVILLE, NC; small business) : $40,620 in 7 contractsfrom 2003 to 2006
Contracts for Fuel Oils, Liquid Propellants and Fuels, Petroleum Base by Air Force Signed by year:2000: $0; 2001: $0; 2002: $0; 2003: $10,775; 2004: $19,998; 2005: $14,040; 2006: -$4,193.
Biggest contracts:
$19,998 with Air Force for Fuel Oils. Signed on 2004-10-29. Completion date: 2004-11-07.
$19,550, same as above.Signed on 2005-11-01. Completion date: 2005-11-04.
$9,782 with Air Force for Liquid Propellants and Fuels, Petroleum Base. Signed on 2003-10-08. Completion date: 2003-10-11.
$4,192, same as above.Signed on 2003-10-08. Completion date: 2003-10-11.
STEEL SMART,INC (1042 AIRPORT RD in PIKEVILLE, NC; small business)
$10,399 with Air Force for Maintenance, Repair or Alteration of Real Property -- Recreational Buildings. Signed on 2001-06-19. Completion date: 2001-06-01.
Top industries in this zip code by the number of employees in 2005:
Administrative and Support and Waste Management and Remediation Services: Landscaping Services (50-99 employees: 1 establishment, 5-9 employees: 1 establishment, 1-4 employees: 1 establishment)
Accommodation and Food Services: Limited-Service Restaurants (20-49: 1, 10-19: 1)
Other Services (except Public Administration): Religious Organizations (20-49: 1, 1-4: 4)
Health Care and Social Assistance: Child Day Care Services (20-49: 1, 5-9: 1)
Health Care and Social Assistance: Homes for the Elderly (20-49: 1)
Construction: Painting and Wall Covering Contractors (10-19: 1, 5-9: 1)
Construction: Poured Concrete Foundation and Structure Contractors (10-19: 1, 1-4: 2)
People in group quarters in 2010:
10 people in group homes intended for adults
People in group quarters in 2000:
25 people in nursing homes
6 people in other group homes
Fatal accident statistics in 2014:
Fatal accident count: 2
Vehicles involved in fatal accidents: 2
Fatal accidents caused by drunken drivers: 2
Fatalities: 2
Persons involved in fatal accidents: 3
Pedestrians involved in fatal accidents: 0
Fatal accident statistics in 2013:
Fatal accident count: 1
Vehicles involved in fatal accidents: 1
Fatal accidents caused by drunken drivers: 0
Fatalities: 1
Persons involved in fatal accidents: 1
Pedestrians involved in fatal accidents: 0
Home Mortgage Disclosure Act Aggregated Statistics For Year 2009 (Based on 6 partial tracts)
A) FHA, FSA/RHS & VA Home Purchase Loans
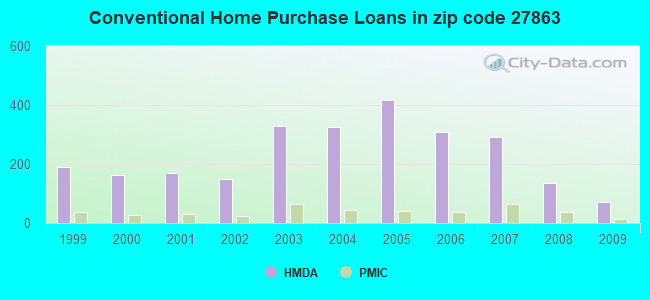
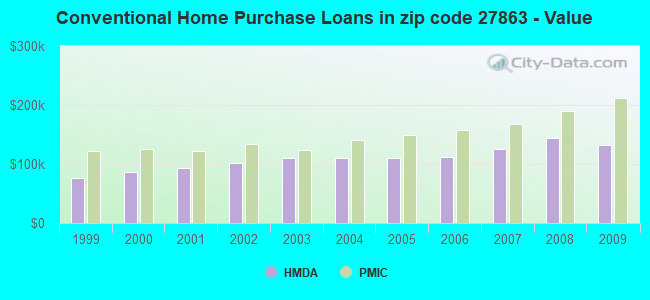
B) Conventional Home Purchase Loans
C) Refinancings
D) Home Improvement Loans
E) Loans on Dwellings For 5+ Families
F) Non-occupant Loans on < 5 Family Dwellings (A B C & D)
G) Loans On Manufactured Home Dwelling (A B C & D)
Number
Average Value
Number
Average Value
Number
Average Value
Number
Average Value
Number
Average Value
Number
Average Value
Number
Average Value
LOANS ORIGINATED
241
$162,585
72
$131,439
518
$145,759
35
$62,668
1
$227,040
36
$86,281
63
$74,760
APPLICATIONS APPROVED, NOT ACCEPTED
5
$137,186
5
$37,798
27
$142,235
4
$78,125
0
$0
2
$125,445
7
$66,069
APPLICATIONS DENIED
20
$128,851
14
$51,345
111
$123,692
25
$55,331
0
$0
10
$100,255
37
$67,044
APPLICATIONS WITHDRAWN
11
$126,925
5
$138,124
91
$152,210
5
$109,964
0
$0
3
$108,090
10
$71,897
FILES CLOSED FOR INCOMPLETENESS
3
$149,340
0
$0
26
$151,923
3
$21,137
0
$0
0
$0
1
$49,630
Aggregated Statistics For Year 2008 (Based on 6 partial tracts)
A) FHA, FSA/RHS & VA Home Purchase Loans
B) Conventional Home Purchase Loans
C) Refinancings
D) Home Improvement Loans
F) Non-occupant Loans on < 5 Family Dwellings (A B C & D)
G) Loans On Manufactured Home Dwelling (A B C & D)
Number
Average Value
Number
Average Value
Number
Average Value
Number
Average Value
Number
Average Value
Number
Average Value
LOANS ORIGINATED
252
$162,857
134
$144,861
333
$123,338
45
$63,351
43
$89,118
72
$71,977
APPLICATIONS APPROVED, NOT ACCEPTED
11
$149,575
7
$94,423
47
$129,947
12
$9,017
2
$115,685
6
$78,755
APPLICATIONS DENIED
11
$159,774
34
$88,241
192
$128,143
82
$51,096
16
$67,338
56
$62,443
APPLICATIONS WITHDRAWN
20
$148,496
14
$191,484
93
$132,199
7
$87,953
3
$118,420
12
$97,776
FILES CLOSED FOR INCOMPLETENESS
2
$91,005
1
$38,020
12
$151,996
1
$146,170
1
$38,020
0
$0
Aggregated Statistics For Year 2007 (Based on 6 partial tracts)
A) FHA, FSA/RHS & VA Home Purchase Loans
B) Conventional Home Purchase Loans
C) Refinancings
D) Home Improvement Loans
F) Non-occupant Loans on < 5 Family Dwellings (A B C & D)
G) Loans On Manufactured Home Dwelling (A B C & D)
Number
Average Value
Number
Average Value
Number
Average Value
Number
Average Value
Number
Average Value
Number
Average Value
LOANS ORIGINATED
202
$155,024
291
$125,355
294
$105,944
68
$51,403
58
$78,205
83
$67,677
APPLICATIONS APPROVED, NOT ACCEPTED
5
$152,616
33
$94,425
61
$97,619
13
$19,500
8
$82,235
15
$56,173
APPLICATIONS DENIED
15
$119,876
40
$88,470
223
$120,252
85
$57,384
12
$68,046
68
$57,087
APPLICATIONS WITHDRAWN
6
$145,952
23
$118,841
96
$124,802
10
$95,393
3
$57,033
7
$66,486
FILES CLOSED FOR INCOMPLETENESS
0
$0
4
$113,532
20
$129,318
0
$0
1
$113,220
1
$95,040
Aggregated Statistics For Year 2006 (Based on 6 partial tracts)
A) FHA, FSA/RHS & VA Home Purchase Loans
B) Conventional Home Purchase Loans
C) Refinancings
D) Home Improvement Loans
F) Non-occupant Loans on < 5 Family Dwellings (A B C & D)
G) Loans On Manufactured Home Dwelling (A B C & D)
Number
Average Value
Number
Average Value
Number
Average Value
Number
Average Value
Number
Average Value
Number
Average Value
LOANS ORIGINATED
204
$150,897
310
$112,710
321
$96,334
89
$42,181
59
$81,746
99
$62,527
APPLICATIONS APPROVED, NOT ACCEPTED
12
$150,845
44
$96,242
62
$86,391
15
$21,725
3
$112,133
31
$65,094
APPLICATIONS DENIED
15
$126,190
83
$80,539
231
$101,969
71
$42,922
14
$74,121
95
$57,398
APPLICATIONS WITHDRAWN
5
$178,876
25
$135,375
100
$105,671
10
$66,892
4
$182,768
9
$66,153
FILES CLOSED FOR INCOMPLETENESS
0
$0
13
$128,121
45
$129,068
0
$0
4
$124,025
0
$0
Aggregated Statistics For Year 2005 (Based on 6 partial tracts)
A) FHA, FSA/RHS & VA Home Purchase Loans
B) Conventional Home Purchase Loans
C) Refinancings
D) Home Improvement Loans
F) Non-occupant Loans on < 5 Family Dwellings (A B C & D)
G) Loans On Manufactured Home Dwelling (A B C & D)
Number
Average Value
Number
Average Value
Number
Average Value
Number
Average Value
Number
Average Value
Number
Average Value
LOANS ORIGINATED
207
$146,433
417
$110,353
345
$94,005
75
$29,823
89
$78,994
111
$62,078
APPLICATIONS APPROVED, NOT ACCEPTED
9
$130,971
25
$92,112
69
$80,866
9
$39,204
3
$26,213
15
$83,240
APPLICATIONS DENIED
7
$103,263
68
$62,031
276
$100,708
66
$38,495
13
$57,128
131
$57,107
APPLICATIONS WITHDRAWN
8
$145,041
27
$113,869
117
$117,147
11
$89,008
7
$79,691
22
$75,429
FILES CLOSED FOR INCOMPLETENESS
2
$131,495
7
$134,579
54
$126,232
4
$55,255
0
$0
7
$82,186
Aggregated Statistics For Year 2004 (Based on 6 partial tracts)
A) FHA, FSA/RHS & VA Home Purchase Loans
B) Conventional Home Purchase Loans
C) Refinancings
D) Home Improvement Loans
F) Non-occupant Loans on < 5 Family Dwellings (A B C & D)
G) Loans On Manufactured Home Dwelling (A B C & D)
Number
Average Value
Number
Average Value
Number
Average Value
Number
Average Value
Number
Average Value
Number
Average Value
LOANS ORIGINATED
184
$134,221
327
$110,949
371
$99,800
55
$28,671
63
$66,497
101
$57,039
APPLICATIONS APPROVED, NOT ACCEPTED
4
$145,572
32
$74,557
60
$98,549
7
$18,926
3
$66,073
29
$49,784
APPLICATIONS DENIED
13
$95,332
70
$60,259
273
$92,199
54
$37,694
8
$66,012
115
$54,865
APPLICATIONS WITHDRAWN
8
$116,356
28
$103,339
142
$107,060
19
$70,504
3
$109,260
30
$68,545
FILES CLOSED FOR INCOMPLETENESS
0
$0
5
$84,328
24
$118,580
0
$0
0
$0
3
$73,000
Aggregated Statistics For Year 2003 (Based on 6 partial tracts)
A) FHA, FSA/RHS & VA Home Purchase Loans
B) Conventional Home Purchase Loans
C) Refinancings
D) Home Improvement Loans
F) Non-occupant Loans on < 5 Family Dwellings (A B C & D)
Number
Average Value
Number
Average Value
Number
Average Value
Number
Average Value
Number
Average Value
LOANS ORIGINATED
157
$132,813
330
$109,534
864
$103,332
30
$17,416
63
$69,378
APPLICATIONS APPROVED, NOT ACCEPTED
5
$129,538
46
$59,241
93
$90,662
11
$22,756
4
$42,120
APPLICATIONS DENIED
14
$78,148
126
$51,132
266
$92,748
47
$37,211
10
$61,940
APPLICATIONS WITHDRAWN
9
$120,093
24
$97,639
132
$103,606
15
$37,133
6
$64,908
FILES CLOSED FOR INCOMPLETENESS
0
$0
7
$108,779
33
$112,018
0
$0
1
$132,900
Aggregated Statistics For Year 2002 (Based on 4 partial tracts)
A) FHA, FSA/RHS & VA Home Purchase Loans
B) Conventional Home Purchase Loans
C) Refinancings
D) Home Improvement Loans
F) Non-occupant Loans on < 5 Family Dwellings (A B C & D)
Number
Average Value
Number
Average Value
Number
Average Value
Number
Average Value
Number
Average Value
LOANS ORIGINATED
83
$131,820
148
$101,306
277
$104,774
20
$18,922
25
$57,492
APPLICATIONS APPROVED, NOT ACCEPTED
5
$76,778
18
$59,985
36
$86,658
5
$16,486
4
$52,058
APPLICATIONS DENIED
5
$61,050
82
$50,299
86
$81,296
21
$23,495
3
$61,257
APPLICATIONS WITHDRAWN
1
$128,620
7
$92,634
40
$96,628
7
$52,374
1
$52,430
FILES CLOSED FOR INCOMPLETENESS
1
$81,520
1
$134,060
10
$102,889
0
$0
0
$0
Aggregated Statistics For Year 2001 (Based on 4 partial tracts)
A) FHA, FSA/RHS & VA Home Purchase Loans
B) Conventional Home Purchase Loans
C) Refinancings
D) Home Improvement Loans
F) Non-occupant Loans on < 5 Family Dwellings (A B C & D)
Number
Average Value
Number
Average Value
Number
Average Value
Number
Average Value
Number
Average Value
LOANS ORIGINATED
90
$118,032
170
$92,407
238
$95,097
21
$14,797
19
$68,588
APPLICATIONS APPROVED, NOT ACCEPTED
2
$94,895
30
$57,996
26
$59,630
5
$16,832
2
$20,505
APPLICATIONS DENIED
2
$101,900
77
$43,171
87
$86,256
17
$19,332
3
$48,230
APPLICATIONS WITHDRAWN
2
$85,600
9
$130,502
44
$102,544
2
$24,035
1
$153,080
FILES CLOSED FOR INCOMPLETENESS
0
$0
5
$140,942
11
$94,436
1
$9,060
2
$65,670
Aggregated Statistics For Year 2000 (Based on 4 partial tracts)
A) FHA, FSA/RHS & VA Home Purchase Loans
B) Conventional Home Purchase Loans
C) Refinancings
D) Home Improvement Loans
F) Non-occupant Loans on < 5 Family Dwellings (A B C & D)
Number
Average Value
Number
Average Value
Number
Average Value
Number
Average Value
Number
Average Value
LOANS ORIGINATED
59
$106,235
163
$85,969
67
$67,644
19
$20,651
15
$43,555
APPLICATIONS APPROVED, NOT ACCEPTED
5
$71,552
40
$44,824
17
$87,635
5
$15,886
2
$106,975
APPLICATIONS DENIED
6
$78,983
135
$44,748
74
$70,094
12
$17,492
14
$60,574
APPLICATIONS WITHDRAWN
6
$106,432
12
$62,646
23
$67,492
0
$0
1
$100,010
FILES CLOSED FOR INCOMPLETENESS
0
$0
2
$97,965
9
$89,942
0
$0
1
$40,760
Aggregated Statistics For Year 1999 (Based on 3 partial tracts)
A) FHA, FSA/RHS & VA Home Purchase Loans
B) Conventional Home Purchase Loans
C) Refinancings
D) Home Improvement Loans
F) Non-occupant Loans on < 5 Family Dwellings (A B C & D)
2002 - 2018 National Fire Incident Reporting System (NFIRS) incidents
According to the data from the years 2002 - 2018 the average number of fire incidents per year is 46. The highest number of reported fires - 114 took place in 2017, and the least - 0 in 2003. The data has a decreasing trend.
When looking into fire subcategories, the most reports belonged to: Structure Fires (43.8%), and Outside Fires (43.2%).
Fire incident types reported to NFIRS in Zip Code 27863


+$5,355
-$3,231
(% of AGI for various income ranges: 2.4% for AGIs below $10k, 0.0% for AGIs $25k-50k, 0.0% for AGIs $50k-75k, 1.0% for AGIs $75k-100k) Nearest zip codes: 27830, 27534, 27530, 27531, 27813, 27851.


 According to the data from the years 2002 - 2018 the average number of fire incidents per year is 46. The highest number of reported fires - 114 took place in 2017, and the least - 0 in 2003. The data has a decreasing trend.
 When looking into fire subcategories, the most reports belonged to: Structure Fires (43.8%), and Outside Fires (43.2%).