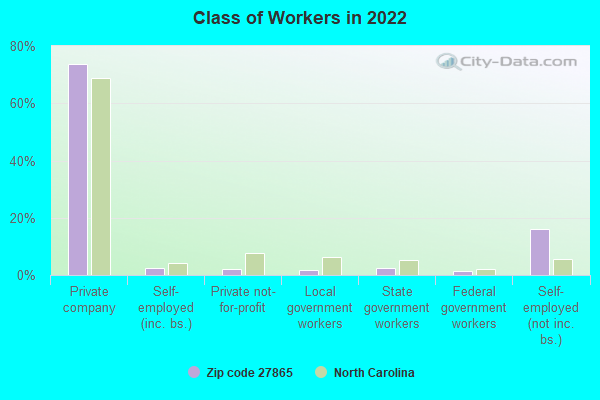
Estimated zip code population in 2022: 2,533 Zip code population in 2010: 1,927 Zip code population in 2000: 2,006
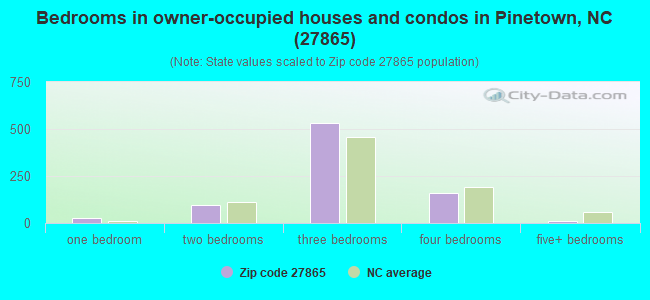
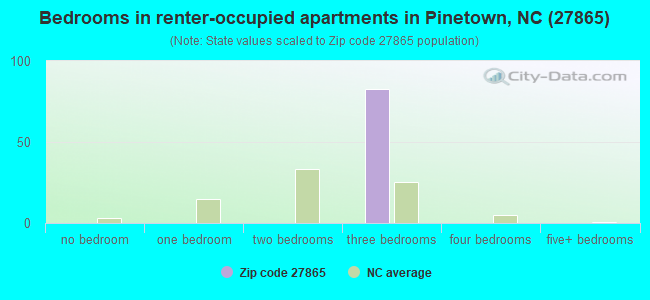
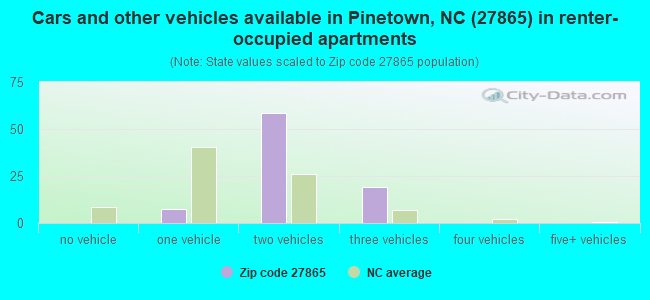
Houses and condos: 991 Renter-occupied apartments: 83
% of renters here:
9%
State:
33%
March 2022 cost of living index in zip code 27865: 82.4 (low, U.S. average is 100)
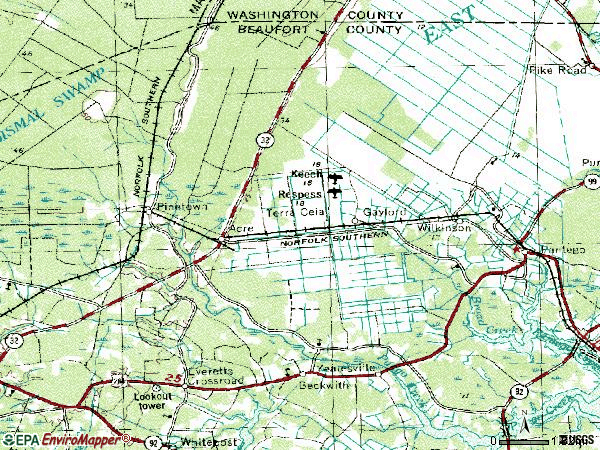
Land area: 86.5 sq. mi. Water area: 0.5 sq. mi.
Population density: 29 people per square mile
(very low).
OSM Map
General Map
Google Map
MSN Map
OSM Map
General Map
Google Map
MSN Map
OSM Map
General Map
Google Map
MSN Map
OSM Map
General Map
Google Map
MSN Map
Please wait while loading the map...
Real estate property taxes paid for housing units in 2022:
This zip code:
0.6% ($1,158)
North Carolina:
0.6% ($1,769)
Median real estate property taxes paid for housing units with mortgages in 2022: $1,235 (0.6%) Median real estate property taxes paid for housing units with no mortgage in 2022: $1,124 (0.6%)
Business Search- 14 Million verified businesses
Males: 1,170
(46.2%)
Females: 1,363
(53.8%)
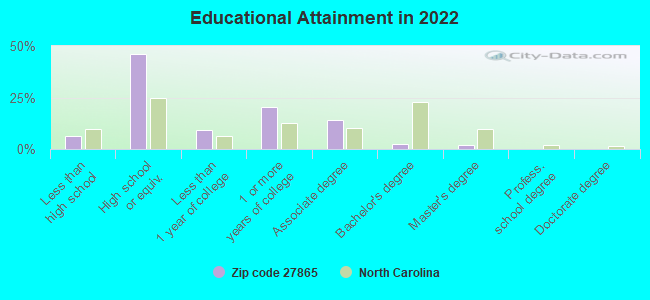
For population 25 years and over in 27865:
High school or higher: 91.3%
Bachelor's degree or higher: 4.2%
Graduate or professional degree: 2.0%
Unemployed: 3.8%
Mean travel time to work (commute): 37.9 minutes
For population 15 years and over in 27865:
Never married: 10.5%
Now married: 67.7%
Separated: 0.0%
Widowed: 5.6%
Divorced: 16.3%
Zip code 27865 compared to state average:
Black race population percentage significantly below state average.
Hispanic race population percentage significantly below state average.
Median age above state average.
Foreign-born population percentage significantly below state average.
Renting percentage significantly below state average.
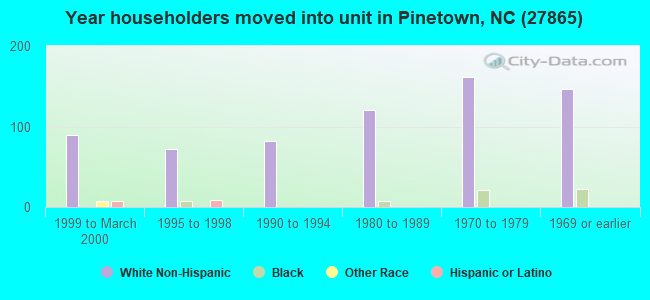
Length of stay since moving in significantly above state average.
Number of college students below state average.
Percentage of population with a bachelor's degree or higher significantly below state average.
Estimated median house/condo value in 2022: $192,920
27865:
$192,920
North Carolina:
$280,600
According to our research of North Carolina and other state lists, there were 3 registered sex offenders living in 27865 zip code as of May 28, 2024. The ratio of all residents to sex offenders in zip code 27865 is 839 to 1. The ratio of registered sex offenders to all residents in this zip code is lower than the state average.
Median resident age:
This zip code:
45.0 years
North Carolina median age:
39.2 years
Average household size:
This zip code:
2.8 people
North Carolina:
2.4 people
Averages for the 2020 tax year for zip code 27865, filed in 2021:
Average Adjusted Gross Income (AGI) in 2020: $51,387 (Individual Income Tax Returns)
Here:
$51,387
State:
$70,020
Salary/wage: $47,570 (reported on 82.4% of returns)
Here:
$47,570
State:
$58,387
(% of AGI for various income ranges: 1246.0% for AGIs below $25k, 3952.0% for AGIs $25k-50k, 7436.7% for AGIs $50k-75k, 12837.5% for AGIs $75k-100k, 26102.0% for AGIs $100k-200k)
Taxable interest for individuals: $571 (reported on 32.9% of returns)
This zip code:
$571
North Carolina:
$1,479
(% of AGI for various income ranges: 14.0% for AGIs below $25k, 46.0% for AGIs $25k-50k, 15.6% for AGIs $50k-75k, 7.5% for AGIs $75k-100k, 92.0% for AGIs $100k-200k)
Ordinary dividends: $1,445 (reported on 12.9% of returns)
Here:
$1,445
State:
$7,888
(% of AGI for various income ranges: 32.5% for AGIs below $25k, 42.2% for AGIs $50k-75k, 112.0% for AGIs $100k-200k)
Net capital gain/loss in AGI: +$2,700 (reported on 12.9% of returns)
Here:
+$2,700
State:
+$23,652
(% of AGI for various income ranges: 25.5% for AGIs below $25k, 18.7% for AGIs $25k-50k, 106.7% for AGIs $50k-75k, 244.0% for AGIs $100k-200k)
Profit/loss from business: +$4,743 (reported on 16.5% of returns)
Here:
+$4,743
State:
+$11,710
(% of AGI for various income ranges: 159.5% for AGIs below $25k, 64.7% for AGIs $25k-50k, 138.9% for AGIs $50k-75k, 307.5% for AGIs $75k-100k)
Taxable individual retirement arrangement distribution: $11,688 (reported on 9.4% of returns)
27865:
$11,688
North Carolina:
$20,247
(% of AGI for various income ranges: 65.0% for AGIs below $25k, 288.7% for AGIs $25k-50k, 930.0% for AGIs $75k-100k)
Taxes paid: $7,250 (reported on 2.4% of returns)
27865:
$7,250
State:
$7,586
(% of AGI for various income ranges: 161.1% for AGIs $50k-75k)
Earned income credit: $2,015 (reported on 15.3% of returns)
Here:
$2,015
State:
$2,337
(% of AGI for various income ranges: 85.5% for AGIs below $25k, 60.7% for AGIs $25k-50k)
Percentage of individuals using paid preparers for their 2020 taxes: 91.8%
Here:
92%
State:
93%
(% for various income ranges: 90.3% for AGIs below $25k, 90.5% for AGIs $25k-50k, 92.9% for AGIs $50k-75k, 100.0% for AGIs $75k-100k, 91.7% for AGIs $100k-200k)
Averages for the 2012 tax year for zip code 27865, filed in 2013:
Average Adjusted Gross Income (AGI) in 2012: $45,472 (Individual Income Tax Returns)
Here:
$45,472
State:
$54,937
Salary/wage: $43,192 (reported on 81.6% of returns)
Here:
$43,192
State:
$46,336
(% of AGI for various income ranges: 63.9% for AGIs below $25k, 79.0% for AGIs $25k-50k, 82.5% for AGIs $50k-75k, 79.4% for AGIs $75k-100k, 76.0% for AGIs $100k-200k)
Taxable interest for individuals: $500 (reported on 39.5% of returns)
This zip code:
$500
North Carolina:
$1,298
(% of AGI for various income ranges: 0.9% for AGIs below $25k, 0.4% for AGIs $25k-50k, 0.4% for AGIs $50k-75k, 0.4% for AGIs $75k-100k, 0.4% for AGIs $100k-200k)
Ordinary dividends: $829 (reported on 9.2% of returns)
Here:
$829
State:
$6,213
Net capital gain/loss in AGI: +$1,130 (reported on 13.2% of returns)
Here:
+$1,130
State:
+$12,740
(% of AGI for various income ranges: 1.2% for AGIs below $25k, 0.6% for AGIs $25k-50k, 0.4% for AGIs $75k-100k)
Profit/loss from business: +$5,954 (reported on 17.1% of returns)
Here:
+$5,954
State:
+$10,311
(% of AGI for various income ranges: 6.8% for AGIs below $25k, 3.8% for AGIs $25k-50k, 3.3% for AGIs $75k-100k)
Taxable individual retirement arrangement distribution: $8,714 (reported on 9.2% of returns)
27865:
$8,714
North Carolina:
$15,575
Total itemized deductions: $16,985 (21% of AGI, reported on 26.3% of returns)
Here:
$16,985
State:
$23,438
Here:
21.5% of AGI
State:
21.5% of AGI
(% of AGI for various income ranges: 11.8% for AGIs $25k-50k, 9.4% for AGIs $50k-75k, 11.5% for AGIs $75k-100k, 11.3% for AGIs $100k-200k)
Charity contributions: $4,138 (reported on 21.1% of returns)
Here:
$4,138
State:
$4,687
(% of AGI for various income ranges: 2.4% for AGIs $25k-50k, 1.7% for AGIs $50k-75k, 1.9% for AGIs $75k-100k, 2.5% for AGIs $100k-200k)
Taxes paid: $5,942 (reported on 25.0% of returns)
27865:
$5,942
State:
$8,823
(% of AGI for various income ranges: 1.9% for AGIs $25k-50k, 2.6% for AGIs $50k-75k, 3.8% for AGIs $75k-100k, 5.8% for AGIs $100k-200k)
Earned income credit: $2,360 (reported on 19.7% of returns)
Here:
$2,360
State:
$2,376
(% of AGI for various income ranges: 6.9% for AGIs below $25k, 1.4% for AGIs $25k-50k)
Percentage of individuals using paid preparers for their 2012 taxes: 61.8%
Here:
62%
State:
53%
(% for various income ranges: 62.1% for AGIs below $25k, 55.0% for AGIs $25k-50k, 66.7% for AGIs $50k-75k, 66.7% for AGIs $75k-100k, 66.7% for AGIs $100k-200k)
Averages for the 2004 tax year for zip code 27865, filed in 2005:
Average Adjusted Gross Income (AGI) in 2004: $36,105 (Individual Income Tax Returns)
Here:
$36,105
State:
$45,376
Salary/wage: $34,257 (reported on 85.1% of returns)
Here:
$34,257
State:
$39,442
(% of AGI for various income ranges: 116.7% for AGIs below $10k, 70.2% for AGIs $10k-25k, 86.2% for AGIs $25k-50k, 89.6% for AGIs $50k-75k, 80.8% for AGIs $75k-100k, 57.8% for AGIs over 100k)
Taxable interest for individuals: $941 (reported on 47.7% of returns)
This zip code:
$941
North Carolina:
$1,515
(% of AGI for various income ranges: 7.6% for AGIs below $10k, 2.5% for AGIs $10k-25k, 0.5% for AGIs $25k-50k, 0.4% for AGIs $50k-75k, 0.9% for AGIs $75k-100k, 2.9% for AGIs over 100k)
Taxable dividends: $1,143 (reported on 14.0% of returns)
Here:
$1,143
State:
$4,016
(% of AGI for various income ranges: 1.6% for AGIs $10k-25k, 0.2% for AGIs $25k-50k, 0.2% for AGIs $50k-75k, 0.1% for AGIs $75k-100k, 0.8% for AGIs over 100k)
Net capital gain/loss: +$4,688 (reported on 12.4% of returns)
Here:
+$4,688
State:
+$11,152
(% of AGI for various income ranges: -2.8% for AGIs below $10k, -0.6% for AGIs $10k-25k, -0.2% for AGIs $25k-50k, -0.1% for AGIs $50k-75k, 1.3% for AGIs $75k-100k, 10.9% for AGIs over 100k)
Profit/loss from business: +$4,993 (reported on 19.6% of returns)
Here:
+$4,993
State:
+$9,490
(% of AGI for various income ranges: 10.6% for AGIs below $10k, 8.1% for AGIs $10k-25k, 4.0% for AGIs $25k-50k, 0.2% for AGIs $50k-75k, 1.9% for AGIs $75k-100k)
Profit/loss from farming: +$1,091 (reported on 1.5% of returns)
Here:
+$1,091
State:
-$3,231
Total itemized deductions: $14,765 (22% of AGI, reported on 22.7% of returns)
Here:
$14,765
State:
$19,464
Here:
22.5% of AGI
State:
22.7% of AGI
(% of AGI for various income ranges: 5.7% for AGIs $10k-25k, 6.9% for AGIs $25k-50k, 9.9% for AGIs $50k-75k, 13.0% for AGIs $75k-100k, 13.2% for AGIs over 100k)
Charity contributions deductions: $3,533 (5% of AGI, reported on 20.3% of returns)
Here:
$3,533
State:
$4,035
Here:
5.3% of AGI
State:
4.5% of AGI
(% of AGI for various income ranges: 1.2% for AGIs $10k-25k, 1.0% for AGIs $25k-50k, 2.6% for AGIs $50k-75k, 2.7% for AGIs $75k-100k, 3.1% for AGIs over 100k)
Total tax: $3,973 (reported on 73.6% of returns)
27865:
$3,973
State:
$7,257
(% of AGI for various income ranges: 4.6% for AGIs below $10k, 4.2% for AGIs $10k-25k, 5.9% for AGIs $25k-50k, 7.8% for AGIs $50k-75k, 9.9% for AGIs $75k-100k, 14.9% for AGIs over 100k)
Earned income credit: $1,707 (reported on 18.7% of returns)
Here:
$1,707
State:
$1,851
Percentage of individuals using paid preparers for their 2004 taxes: 70.5%
Here:
71%
State:
62%
(% for various income ranges: 55.9% for AGIs below $10k, 74.5% for AGIs $10k-25k, 71.7% for AGIs $25k-50k, 72.3% for AGIs $50k-75k, 84.0% for AGIs $75k-100k, 79.3% for AGIs over 100k)
Household received Food Stamps/SNAP in the past 12 months: 26 Household did not receive Food Stamps/SNAP in the past 12 months: 874
Women who had a birth in the past 12 months: 10 (10 now married, 0 unmarried) Women who did not have a birth in the past 12 months: 561 (463 now married, 103 unmarried)
Housing units in zip code 27865 with a mortgage: 426 Houses without a mortgage: 14
Median monthly owner costs for units with a mortgage: $1,409 Median monthly owner costs for units without a mortgage: $607
Residents with income below the poverty level in 2022:
This zip code:
13.9%
Whole state:
12.8%
Residents with income below 50% of the poverty level in 2022:
This zip code:
7.2%
Whole state:
6.8%
Median number of rooms in houses and condos:
Here:
6.1
State:
6.4
Median number of rooms in apartments:
Here:
5.1
State:
4.4
Notable locations in this zip code not listed on our city pages
Streams, rivers, and creeks: Deep Run (A), Clark Creek (B), Rowland Creek (C), Acre Swamp (D), Jacks Branch (E), Fork Swamp (F). Display/hide their locations on the map
In group quarters: 12 (-1 institutionalized population)
Size of family households: 304 2-persons, 140 3-persons, 114 4-persons, 51 5-persons, 45 6-persons
Size of nonfamily households: 66 1-person, 191 2-persons
485 married couples with children.
17 single-parent households (17 women).
99.1% of residents of 27865 zip code speak English at home.
0.5% of residents speak other Indo-European language at home (100% very well).
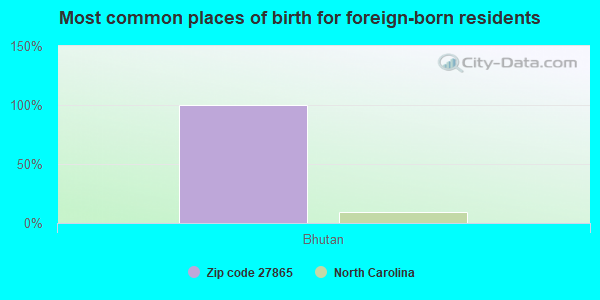
Foreign born population: 12 (0.5%) (0.0% of them are naturalized citizens)
:
0.5%
Whole state:
8.6%
100%Bhutan
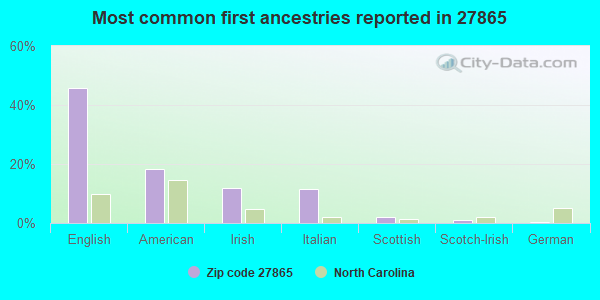
46%English
18%American
12%Irish
11%Italian
2%Scottish
1%Scotch-Irish
0%German
Year of entry for the foreign-born population
142010 or later
02000 to 2009
01990 to 1999
0Before 1990
Housing units lacking complete plumbing facilities: 3.2% Housing units lacking complete kitchen facilities: 3.0%
53.7%Bottled, tank, or LP gas
39.8%Electricity
4.6%Utility gas
2.2%Wood
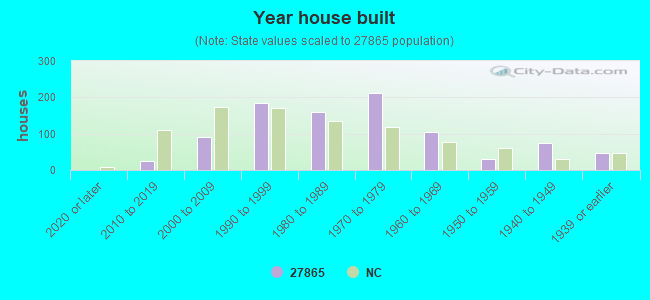
Population in 1990: 1,829. Population change in the 1990s: +177 (+9.7%).
Place of birth for U.S.-born residents:
This state: 1,797
Northeast: 60
Midwest: 419
South: 139
West: 80
79% of the 27865 zip code residents lived in the same house 5 years ago. Out of people who lived in different houses, 69% lived in this county. Out of people who lived in different counties, 50% lived in North Carolina.
99% of the 27865 zip code residents lived in the same house 1 year ago. Out of people who lived in different houses, 116% moved from this county. Out of people who lived in different houses, 53% moved from different county within same state.
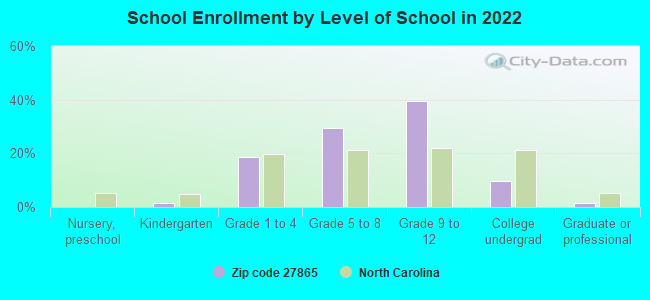
Private vs. public school enrollment:
Students in private schools in grades 1 to 8 (elementary and middle school): 20
Here:
7.4%
North Carolina:
13.8%
Students in private schools in grades 9 to 12 (high school): 9
Here:
4.2%
North Carolina:
11.9%
Students in private undergraduate colleges:
Here:
0.0%
North Carolina:
19.3%
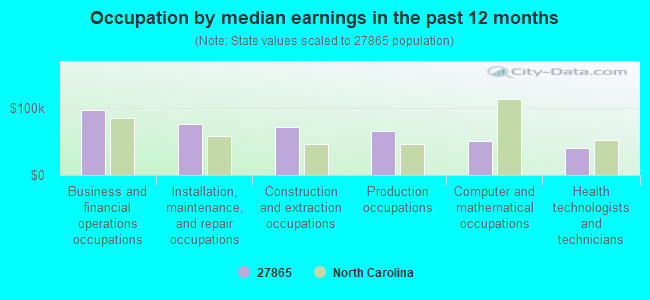
Occupation by median earnings in the past 12 months ($)
97,237Business and financial operations occupations
75,576Installation, maintenance, and repair occupations
71,983Construction and extraction occupations
65,544Production occupations
50,570Computer and mathematical occupations
40,982Health technologists and technicians
Top industries in this zip code by the number of employees in 2005:
Other Services (except Public Administration): Automotive Body, Paint, and Interior Repair and Maintenance (5-9 employees: 1 establishment, 1-4 employees: 1 establishment)
Other Services (except Public Administration): Commercial and Industrial Machinery and Equipment (except Automotive and Electronic) Repair and Maintenance (5-9: 1)
Construction: Site Preparation Contractors (1-4: 2)
People in group quarters in 2010:
47 people in nursing facilities/skilled-nursing facilities
6 people in group homes intended for adults
People in group quarters in 2000:
56 people in nursing homes
Fatal accident statistics in 2014:
Fatal accident count: 1
Vehicles involved in fatal accidents: 3
Fatal accidents caused by drunken drivers: 0
Fatalities: 1
Persons involved in fatal accidents: 5
Pedestrians involved in fatal accidents: 0
Fatal accident statistics in 2012:
Fatal accident count: 1
Vehicles involved in fatal accidents: 1
Fatal accidents caused by drunken drivers: 1
Fatalities: 1
Persons involved in fatal accidents: 1
Pedestrians involved in fatal accidents: 0
Most common first names in zip code 27865 among deceased individuals
Name
Count
Lived (average)
William
19
73.0 years
John
16
72.6 years
James
15
74.5 years
Mary
13
78.7 years
Robert
12
72.1 years
Charlie
8
72.6 years
Jesse
7
73.0 years
Leroy
6
73.2 years
Charles
6
75.8 years
Annie
6
87.8 years
Most common last names in zip code 27865 among deceased individuals
Last name
Count
Lived (average)
Waters
74
77.1 years
Boyd
45
73.9 years
Keech
31
76.3 years
Wallace
25
74.1 years
Tetterton
20
72.5 years
Woolard
20
74.5 years
Gurkin
15
77.4 years
Everett
12
81.6 years
Harris
12
74.4 years
Windley
12
81.7 years
Discuss Pinetown, North Carolina (NC) on our hugely popular North Carolina forum.


+$1,091
-$3,231
 Nearest zip codes: 27846, 27962, 27860, 27889, 27808, 27892.