Estimated zip code population in 2022: 1,812 Zip code population in 2010: 2,258 Zip code population in 2000: 2,686
Houses and condos: 1,070 Renter-occupied apartments: 194
% of renters here:
25%
State:
33%
March 2022 cost of living index in zip code 27869: 78.7 (low, U.S. average is 100)
Land area: 81.9 sq. mi. Water area: 0.8 sq. mi.
Population density: 22 people per square mile
(very low).
OSM Map
General Map
Google Map
MSN Map
OSM Map
General Map
Google Map
MSN Map
OSM Map
General Map
Google Map
MSN Map
OSM Map
General Map
Google Map
MSN Map
Please wait while loading the map...
Real estate property taxes paid for housing units in 2022:
This zip code:
1.1% ($1,086)
North Carolina:
0.6% ($1,769)
Median real estate property taxes paid for housing units with mortgages in 2022: $1,303 (1.3%) Median real estate property taxes paid for housing units with no mortgage in 2022: $994 (1.1%)
Estimated median house/condo value in 2022: $95,206
27869:
$95,206
North Carolina:
$280,600
According to our research of North Carolina and other state lists, there were 6 registered sex offenders living in 27869 zip code as of May 28, 2024. The ratio of all residents to sex offenders in zip code 27869 is 374 to 1.
Median resident age:
This zip code:
58.5 years
North Carolina median age:
39.2 years
Average household size:
This zip code:
2.1 people
North Carolina:
2.4 people
Averages for the 2020 tax year for zip code 27869, filed in 2021:
Average Adjusted Gross Income (AGI) in 2020: $39,549 (Individual Income Tax Returns)
Here:
$39,549
State:
$70,020
Salary/wage: $30,940 (reported on 84.3% of returns)
Here:
$30,940
State:
$58,387
(% of AGI for various income ranges: 1337.0% for AGIs below $25k, 4051.0% for AGIs $25k-50k, 5801.4% for AGIs $50k-75k, 18570.0% for AGIs $100k-200k)
Taxable interest for individuals: $633 (reported on 21.7% of returns)
This zip code:
$633
North Carolina:
$1,479
(% of AGI for various income ranges: 5.6% for AGIs below $25k, 11.4% for AGIs $25k-50k, 37.1% for AGIs $50k-75k, 245.0% for AGIs $100k-200k)
Ordinary dividends: $4,683 (reported on 7.2% of returns)
Here:
$4,683
State:
$7,888
(% of AGI for various income ranges: 31.5% for AGIs below $25k)
Net capital gain/loss in AGI: +$7,917 (reported on 7.2% of returns)
Here:
+$7,917
State:
+$23,652
(% of AGI for various income ranges: 157.1% for AGIs $50k-75k, 1825.0% for AGIs $100k-200k)
Profit/loss from business: +$7,208 (reported on 14.5% of returns)
Here:
+$7,208
State:
+$11,710
(% of AGI for various income ranges: 62.6% for AGIs below $25k, 41.4% for AGIs $25k-50k, 870.0% for AGIs $50k-75k)
Taxable individual retirement arrangement distribution: $10,020 (reported on 6.0% of returns)
27869:
$10,020
North Carolina:
$20,247
(% of AGI for various income ranges: 238.6% for AGIs $25k-50k)
Total itemized deductions: $26,125 (reported on 4.8% of returns)
Here:
$26,125
State:
$34,549
(% of AGI for various income ranges: 497.6% for AGIs $25k-50k)
Charity contributions: $6,533 (reported on 3.6% of returns)
Here:
$6,533
State:
$13,360
(% of AGI for various income ranges: 93.3% for AGIs $25k-50k)
Taxes paid: $4,625 (reported on 4.8% of returns)
27869:
$4,625
State:
$7,586
(% of AGI for various income ranges: 88.1% for AGIs $25k-50k)
Earned income credit: $2,319 (reported on 32.5% of returns)
Here:
$2,319
State:
$2,337
(% of AGI for various income ranges: 154.1% for AGIs below $25k, 100.0% for AGIs $25k-50k)
Percentage of individuals using paid preparers for their 2020 taxes: 89.2%
Here:
89%
State:
93%
(% for various income ranges: 88.9% for AGIs below $25k, 86.2% for AGIs $25k-50k, 88.9% for AGIs $50k-75k, 100.0% for AGIs $75k-100k, 100.0% for AGIs $100k-200k)
Averages for the 2012 tax year for zip code 27869, filed in 2013:
Average Adjusted Gross Income (AGI) in 2012: $32,411 (Individual Income Tax Returns)
Here:
$32,411
State:
$54,937
Salary/wage: $25,745 (reported on 86.7% of returns)
Here:
$25,745
State:
$46,336
(% of AGI for various income ranges: 78.3% for AGIs below $25k, 81.1% for AGIs $25k-50k, 62.4% for AGIs $50k-75k, 68.3% for AGIs $75k-100k, 40.8% for AGIs $100k-200k)
Taxable interest for individuals: $878 (reported on 20.0% of returns)
This zip code:
$878
North Carolina:
$1,298
(% of AGI for various income ranges: 0.5% for AGIs below $25k, 0.5% for AGIs $25k-50k, 0.8% for AGIs $50k-75k, 0.9% for AGIs $100k-200k)
Ordinary dividends: $11,025 (reported on 4.4% of returns)
Here:
$11,025
State:
$6,213
Net capital gain/loss in AGI: +$9,325 (reported on 4.4% of returns)
Here:
+$9,325
State:
+$12,740
Profit/loss from business: +$4,967 (reported on 13.3% of returns)
Here:
+$4,967
State:
+$10,311
Taxable individual retirement arrangement distribution: $12,317 (reported on 6.7% of returns)
27869:
$12,317
North Carolina:
$15,575
Total itemized deductions: $17,667 (27% of AGI, reported on 20.0% of returns)
Here:
$17,667
State:
$23,438
Here:
26.7% of AGI
State:
21.5% of AGI
(% of AGI for various income ranges: 4.5% for AGIs below $25k, 11.6% for AGIs $25k-50k, 25.3% for AGIs $50k-75k, 12.0% for AGIs $100k-200k)
Charity contributions: $4,062 (reported on 17.8% of returns)
Here:
$4,062
State:
$4,687
(% of AGI for various income ranges: 2.9% for AGIs $25k-50k, 5.8% for AGIs $50k-75k, 2.2% for AGIs $100k-200k)
Taxes paid: $5,222 (reported on 20.0% of returns)
27869:
$5,222
State:
$8,823
(% of AGI for various income ranges: 1.0% for AGIs below $25k, 2.6% for AGIs $25k-50k, 8.0% for AGIs $50k-75k, 4.9% for AGIs $100k-200k)
Earned income credit: $2,571 (reported on 42.2% of returns)
Here:
$2,571
State:
$2,376
(% of AGI for various income ranges: 12.3% for AGIs below $25k, 1.3% for AGIs $25k-50k)
Percentage of individuals using paid preparers for their 2012 taxes: 54.4%
Here:
54%
State:
53%
(% for various income ranges: 52.9% for AGIs below $25k, 45.8% for AGIs $25k-50k, 75.0% for AGIs $50k-75k, 75.0% for AGIs $75k-100k, 66.7% for AGIs $100k-200k)
Averages for the 2004 tax year for zip code 27869, filed in 2005:
Average Adjusted Gross Income (AGI) in 2004: $25,496 (Individual Income Tax Returns)
Here:
$25,496
State:
$45,376
Salary/wage: $22,725 (reported on 87.1% of returns)
Here:
$22,725
State:
$39,442
(% of AGI for various income ranges: 91.3% for AGIs below $10k, 87.3% for AGIs $10k-25k, 82.9% for AGIs $25k-50k, 72.1% for AGIs $50k-75k, 71.2% for AGIs $75k-100k, 38.5% for AGIs over 100k)
Taxable interest for individuals: $1,406 (reported on 24.0% of returns)
This zip code:
$1,406
North Carolina:
$1,515
(% of AGI for various income ranges: 2.4% for AGIs below $10k, 1.1% for AGIs $10k-25k, 0.8% for AGIs $25k-50k, 2.1% for AGIs $50k-75k, 0.6% for AGIs $75k-100k, 3.0% for AGIs over 100k)
Taxable dividends: $1,211 (reported on 7.8% of returns)
Here:
$1,211
State:
$4,016
(% of AGI for various income ranges: 0.3% for AGIs below $10k, 0.1% for AGIs $10k-25k, 0.4% for AGIs $25k-50k, 0.5% for AGIs $50k-75k, 1.1% for AGIs $75k-100k)
Net capital gain/loss: +$1,173 (reported on 7.7% of returns)
Here:
+$1,173
State:
+$11,152
(% of AGI for various income ranges: -1.4% for AGIs below $10k, -0.1% for AGIs $10k-25k, 0.0% for AGIs $25k-50k, 1.0% for AGIs $50k-75k, 3.1% for AGIs $75k-100k)
Profit/loss from business: +$2,773 (reported on 9.9% of returns)
Here:
+$2,773
State:
+$9,490
(% of AGI for various income ranges: 5.6% for AGIs below $10k, 0.9% for AGIs $10k-25k, 1.2% for AGIs $25k-50k, 1.1% for AGIs $50k-75k)
Total itemized deductions: $15,313 (32% of AGI, reported on 20.3% of returns)
Here:
$15,313
State:
$19,464
Here:
31.6% of AGI
State:
22.7% of AGI
(% of AGI for various income ranges: 7.5% for AGIs $10k-25k, 15.4% for AGIs $25k-50k, 13.7% for AGIs $50k-75k, 11.9% for AGIs $75k-100k, 16.7% for AGIs over 100k)
Charity contributions deductions: $4,089 (9% of AGI, reported on 18.3% of returns)
Here:
$4,089
State:
$4,035
Here:
8.5% of AGI
State:
4.5% of AGI
(% of AGI for various income ranges: 1.6% for AGIs $10k-25k, 3.4% for AGIs $25k-50k, 4.2% for AGIs $50k-75k, 4.2% for AGIs $75k-100k, 3.0% for AGIs over 100k)
Total tax: $2,872 (reported on 53.7% of returns)
27869:
$2,872
State:
$7,257
(% of AGI for various income ranges: 1.7% for AGIs below $10k, 2.1% for AGIs $10k-25k, 5.2% for AGIs $25k-50k, 8.1% for AGIs $50k-75k, 11.7% for AGIs $75k-100k, 13.5% for AGIs over 100k)
Earned income credit: $2,116 (reported on 42.3% of returns)
Here:
$2,116
State:
$1,851
Percentage of individuals using paid preparers for their 2004 taxes: 69.5%
Here:
69%
State:
62%
(% for various income ranges: 71.6% for AGIs below $10k, 69.1% for AGIs $10k-25k, 64.8% for AGIs $25k-50k, 75.8% for AGIs $50k-75k, 84.6% for AGIs $75k-100k, 68.8% for AGIs over 100k)
Household received Food Stamps/SNAP in the past 12 months: 336 Household did not receive Food Stamps/SNAP in the past 12 months: 471
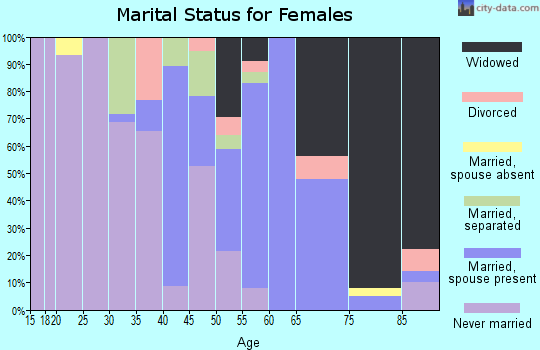
Women who did not have a birth in the past 12 months: 256 (98 now married, 158 unmarried)
Housing units in zip code 27869 with a mortgage: 319 (5 second mortgage, 5 both second mortgage and home equity loan) Median monthly owner costs for units with a mortgage: $837 Median monthly owner costs for units without a mortgage: $409
Residents with income below the poverty level in 2022:
This zip code:
16.2%
Whole state:
12.8%
Residents with income below 50% of the poverty level in 2022:
This zip code:
10.4%
Whole state:
6.8%
Median number of rooms in houses and condos:
Here:
5.5
State:
6.4
Median number of rooms in apartments:
Here:
5.2
State:
4.4
Notable locations in this zip code not listed on our city pages
Churches in zip code 27869 include: Hope Temple (A), Branch Chapel (B), New Hope Church (C), Chapel Hill Church (D), Pinners Church (E), Cumbo Chapel (F). Display/hide their locations on the map
Streams, rivers, and creeks: Conoconnara Swamp (A), Bull Neck Swamp (B), Bridgers Creek (C), Bear Swamp (D), Quarter Swamp (E), Looking Glass Run (F). Display/hide their locations on the map
In group quarters: 124 (-1 institutionalized population)
Size of family households: 322 2-persons, 72 3-persons, 97 4-persons, 38 5-persons, 7 6-persons
Size of nonfamily households: 238 1-person, 8 2-persons
101 married couples with children.
61 single-parent households (43 men, 18 women).
96.4% of residents of 27869 zip code speak English at home.
2.9% of residents speak Spanish at home (86% very well, 14% well).
0.6% of residents speak other Indo-European language at home (100% very well).
0.5% of residents speak Asian or Pacific Island language at home (100% not well).
Foreign born population: 27 (1.5%) (100.0% of them are naturalized citizens)
This zip code:
1.5%
Whole state:
8.6%
38%Thailand
27%Costa Rica
18%American
1%English
1%Irish
1%African
1%Greek
1%Scottish
0%German
Year of entry for the foreign-born population
02010 or later
02000 to 2009
01990 to 1999
25Before 1990
Housing units lacking complete plumbing facilities: 14.1% Housing units lacking complete kitchen facilities: 14.1%
52.0%Electricity
40.9%Bottled, tank, or LP gas
4.5%Utility gas
2.8%Fuel oil, kerosene, etc.
Population in 1990: 2,621. Population change in the 1990s: +65 (+2.5%).
Place of birth for U.S.-born residents:
This state: 1,448
Northeast: 140
Midwest: 21
South: 126
West: 25
68% of the 27869 zip code residents lived in the same house 5 years ago. Out of people who lived in different houses, 65% lived in this county. Out of people who lived in different counties, 50% lived in North Carolina.
88% of the 27869 zip code residents lived in the same house 1 year ago. Out of people who lived in different houses, 52% moved from this county. Out of people who lived in different houses, 31% moved from different county within same state. Out of people who lived in different houses, 12% moved from different state.
Private vs. public school enrollment:
Students in private schools in grades 1 to 8 (elementary and middle school): 35
Here:
35.4%
North Carolina:
13.8%
Students in private schools in grades 9 to 12 (high school):
Here:
0.0%
North Carolina:
11.9%
Students in private undergraduate colleges: 8
Here:
20.0%
North Carolina:
19.3%
Occupation by median earnings in the past 12 months ($)
77,872Construction and extraction occupations
44,820Transportation occupations
35,825Building and grounds cleaning and maintenance occupations
33,298Business and financial operations occupations
32,623Installation, maintenance, and repair occupations
30,546Management occupations
Top industries in this zip code by the number of employees in 2005:
Health Care and Social Assistance: Nursing Care Facilities (100-249 employees: 1 establishment)
Health Care and Social Assistance: Home Health Care Services (50-99: 1)
Utilities: Electric Power Distribution (50-99: 1)
Health Care and Social Assistance: Other Individual and Family Services (20-49: 1, 1-4: 1)
Administrative and Support and Waste Management and Remediation Services: Employment Placement Agencies (20-49: 1)
Accommodation and Food Services: Full-Service Restaurants (10-19: 1)
Health Care and Social Assistance: Kidney Dialysis Centers (10-19: 1)
Professional, Scientific, and Technical Services: Offices of Lawyers (5-9: 1, 1-4: 3)
Health Care and Social Assistance: Child Day Care Services (5-9: 1, 1-4: 2)
People in group quarters in 2010:
63 people in nursing facilities/skilled-nursing facilities
People in group quarters in 2000:
134 people in nursing homes
Fatal accident statistics in 2013:
Fatal accident count: 1
Vehicles involved in fatal accidents: 1
Fatal accidents caused by drunken drivers: 0
Fatalities: 1
Persons involved in fatal accidents: 1
Pedestrians involved in fatal accidents: 0
Fatal accident statistics in 2011:
Fatal accident count: 1
Vehicles involved in fatal accidents: 2
Fatal accidents caused by drunken drivers: 1
Fatalities: 1
Persons involved in fatal accidents: 6
Pedestrians involved in fatal accidents: 0
2003 - 2018 National Fire Incident Reporting System (NFIRS) incidents
Based on the data from the years 2003 - 2018 the average number of fires per year is 13. The highest number of reported fires - 29 took place in 2010, and the least - 0 in 2004. The data has a growing trend.
When looking into fire subcategories, the most incidents belonged to: Structure Fires (55.4%), and Outside Fires (26.0%).
Fire incident types reported to NFIRS in Zip Code 27869

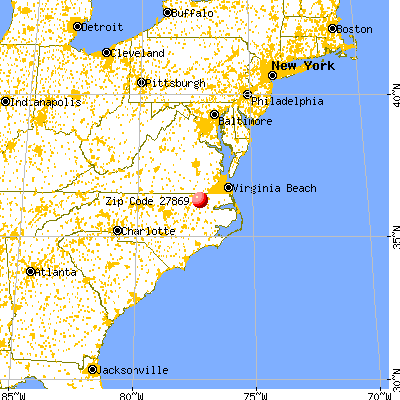


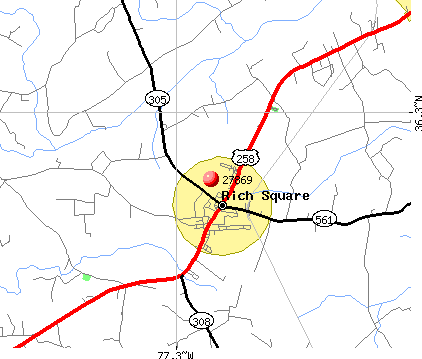 Nearest zip codes: 27872, 27897, 27847, 27874, 27845, 27820.


 Based on the data from the years 2003 - 2018 the average number of fires per year is 13. The highest number of reported fires - 29 took place in 2010, and the least - 0 in 2004. The data has a growing trend.
 When looking into fire subcategories, the most incidents belonged to: Structure Fires (55.4%), and Outside Fires (26.0%).