Estimated zip code population in 2022: 1,574 Zip code population in 2010: 1,282 Zip code population in 2000: 1,124
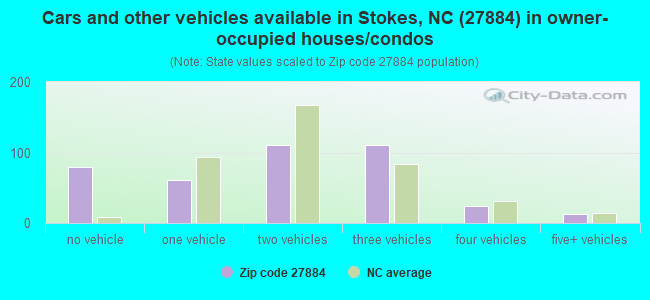
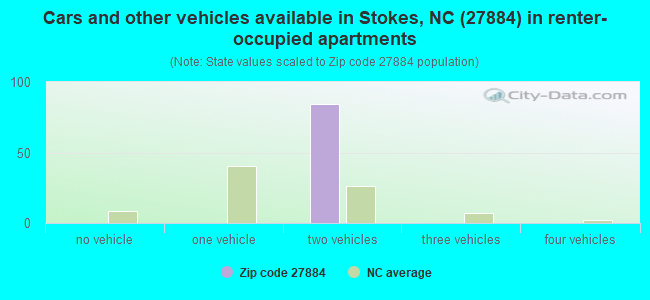
Houses and condos: 498 Renter-occupied apartments: 83
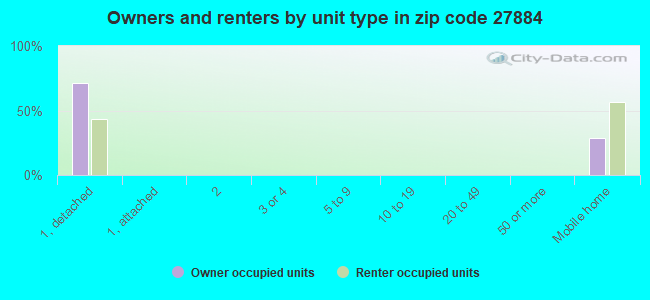
% of renters here:
17%
State:
33%
March 2022 cost of living index in zip code 27884: 81.3 (low, U.S. average is 100)
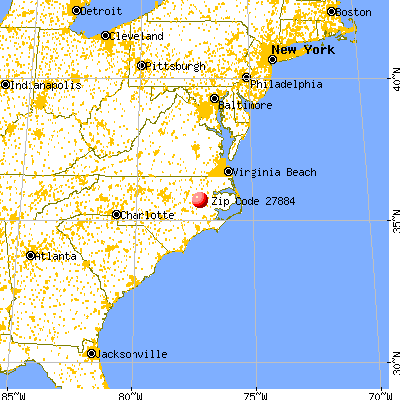
Land area: 33.1 sq. mi. Water area: 0.1 sq. mi.
Population density: 48 people per square mile
(very low).
OSM Map
General Map
Google Map
MSN Map
OSM Map
General Map
Google Map
MSN Map
OSM Map
General Map
Google Map
MSN Map
OSM Map
General Map
Google Map
MSN Map
Please wait while loading the map...
Real estate property taxes paid for housing units in 2022:
This zip code:
0.5% ($1,108)
North Carolina:
0.6% ($1,769)
Median real estate property taxes paid for housing units with mortgages in 2022: $1,644 (0.7%) Median real estate property taxes paid for housing units with no mortgage in 2022: $206 (0.1%)
Business Search- 14 Million verified businesses
Males: 1,035
(65.8%)
Females: 537
(34.2%)
For population 25 years and over in 27884:
High school or higher: 91.6%
Bachelor's degree or higher: 23.2%
Graduate or professional degree: 4.7%
Unemployed: 0.8%
Mean travel time to work (commute): 30.3 minutes
For population 15 years and over in 27884:
Never married: 32.1%
Now married: 58.8%
Separated: 0.8%
Widowed: 0.8%
Divorced: 7.5%
Zip code 27884 compared to state average:
Median house value significantly below state average.
Unemployed percentage significantly below state average.
Black race population percentage above state average.
Hispanic race population percentage above state average.
Median age significantly below state average.
Renting percentage below state average.
Length of stay since moving in significantly above state average.
Percentage of population with a bachelor's degree or higher below state average.
According to our research of North Carolina and other state lists, there were 3 registered sex offenders living in 27884 zip code as of May 28, 2024. The ratio of all residents to sex offenders in zip code 27884 is 374 to 1.
Median resident age:
This zip code:
28.2 years
North Carolina median age:
39.2 years
Average household size:
This zip code:
3.3 people
North Carolina:
2.4 people
Averages for the 2020 tax year for zip code 27884, filed in 2021:
Average Adjusted Gross Income (AGI) in 2020: $51,964 (Individual Income Tax Returns)
Here:
$51,964
State:
$70,020
Salary/wage: $46,978 (reported on 78.1% of returns)
Here:
$46,978
State:
$58,387
(% of AGI for various income ranges: 1437.1% for AGIs below $25k, 3726.4% for AGIs $25k-50k, 6672.9% for AGIs $50k-75k, 12356.7% for AGIs $75k-100k, 22500.0% for AGIs $100k-200k)
Taxable interest for individuals: $778 (reported on 28.1% of returns)
This zip code:
$778
North Carolina:
$1,479
(% of AGI for various income ranges: 10.0% for AGIs below $25k, 35.5% for AGIs $25k-50k, 18.6% for AGIs $50k-75k, 26.7% for AGIs $75k-100k, 165.0% for AGIs $100k-200k)
Ordinary dividends: $3,580 (reported on 7.8% of returns)
Here:
$3,580
State:
$7,888
(% of AGI for various income ranges: 120.0% for AGIs $50k-75k, 237.5% for AGIs $100k-200k)
Net capital gain/loss in AGI: +$13,683 (reported on 9.4% of returns)
Here:
+$13,683
State:
+$23,652
(% of AGI for various income ranges: 57.1% for AGIs $50k-75k, 1952.5% for AGIs $100k-200k)
Profit/loss from business: +$6,082 (reported on 17.2% of returns)
Here:
+$6,082
State:
+$11,710
(% of AGI for various income ranges: 202.9% for AGIs below $25k, 130.0% for AGIs $25k-50k, 806.7% for AGIs $75k-100k)
Taxable individual retirement arrangement distribution: $12,560 (reported on 7.8% of returns)
27884:
$12,560
North Carolina:
$20,247
(% of AGI for various income ranges: 108.6% for AGIs below $25k, 680.0% for AGIs $50k-75k)
Earned income credit: $2,260 (reported on 15.6% of returns)
Here:
$2,260
State:
$2,337
(% of AGI for various income ranges: 131.4% for AGIs below $25k, 38.2% for AGIs $25k-50k)
Percentage of individuals using paid preparers for their 2020 taxes: 89.1%
Here:
89%
State:
93%
(% for various income ranges: 87.5% for AGIs below $25k, 92.9% for AGIs $25k-50k, 90.9% for AGIs $50k-75k, 83.3% for AGIs $75k-100k, 88.9% for AGIs $100k-200k)
Averages for the 2012 tax year for zip code 27884, filed in 2013:
Average Adjusted Gross Income (AGI) in 2012: $39,405 (Individual Income Tax Returns)
Here:
$39,405
State:
$54,937
Salary/wage: $35,315 (reported on 87.1% of returns)
Here:
$35,315
State:
$46,336
(% of AGI for various income ranges: 77.6% for AGIs below $25k, 84.8% for AGIs $25k-50k, 77.0% for AGIs $50k-75k, 79.9% for AGIs $75k-100k, 69.7% for AGIs $100k-200k)
Taxable interest for individuals: $729 (reported on 27.4% of returns)
This zip code:
$729
North Carolina:
$1,298
(% of AGI for various income ranges: 1.0% for AGIs below $25k, 0.4% for AGIs $25k-50k, 0.1% for AGIs $50k-75k, 0.9% for AGIs $100k-200k)
Ordinary dividends: $1,667 (reported on 9.7% of returns)
Here:
$1,667
State:
$6,213
Net capital gain/loss in AGI: +$383 (reported on 9.7% of returns)
Here:
+$383
State:
+$12,740
Profit/loss from business: +$1,990 (reported on 16.1% of returns)
Here:
+$1,990
State:
+$10,311
(% of AGI for various income ranges: 4.7% for AGIs below $25k, 0.4% for AGIs $50k-75k)
Taxable individual retirement arrangement distribution: $9,950 (reported on 6.5% of returns)
27884:
$9,950
North Carolina:
$15,575
Total itemized deductions: $16,694 (26% of AGI, reported on 25.8% of returns)
Here:
$16,694
State:
$23,438
Here:
26.2% of AGI
State:
21.5% of AGI
(% of AGI for various income ranges: 10.4% for AGIs below $25k, 8.7% for AGIs $25k-50k, 12.2% for AGIs $50k-75k, 11.1% for AGIs $75k-100k, 12.8% for AGIs $100k-200k)
Charity contributions: $3,833 (reported on 19.4% of returns)
Here:
$3,833
State:
$4,687
(% of AGI for various income ranges: 1.7% for AGIs $25k-50k, 3.4% for AGIs $50k-75k, 3.3% for AGIs $100k-200k)
Taxes paid: $5,020 (reported on 24.2% of returns)
27884:
$5,020
State:
$8,823
(% of AGI for various income ranges: 1.1% for AGIs below $25k, 1.6% for AGIs $25k-50k, 2.6% for AGIs $50k-75k, 4.5% for AGIs $75k-100k, 5.9% for AGIs $100k-200k)
Earned income credit: $2,500 (reported on 24.2% of returns)
Here:
$2,500
State:
$2,376
(% of AGI for various income ranges: 7.7% for AGIs below $25k, 1.3% for AGIs $25k-50k)
Percentage of individuals using paid preparers for their 2012 taxes: 56.5%
Here:
56%
State:
53%
(% for various income ranges: 57.1% for AGIs below $25k, 50.0% for AGIs $25k-50k, 62.5% for AGIs $50k-75k, 75.0% for AGIs $75k-100k, 50.0% for AGIs $100k-200k)
Averages for the 2004 tax year for zip code 27884, filed in 2005:
Average Adjusted Gross Income (AGI) in 2004: $36,582 (Individual Income Tax Returns)
Here:
$36,582
State:
$45,376
Salary/wage: $32,659 (reported on 85.9% of returns)
Here:
$32,659
State:
$39,442
(% of AGI for various income ranges: 89.8% for AGIs below $10k, 78.4% for AGIs $10k-25k, 83.4% for AGIs $25k-50k, 82.3% for AGIs $50k-75k, 79.6% for AGIs $75k-100k, 53.4% for AGIs over 100k)
Taxable interest for individuals: $900 (reported on 35.7% of returns)
This zip code:
$900
North Carolina:
$1,515
(% of AGI for various income ranges: 4.3% for AGIs below $10k, 2.1% for AGIs $10k-25k, 0.8% for AGIs $25k-50k, 0.5% for AGIs $50k-75k, 0.3% for AGIs $75k-100k, 0.7% for AGIs over 100k)
Taxable dividends: $4,066 (reported on 12.9% of returns)
Here:
$4,066
State:
$4,016
(% of AGI for various income ranges: 0.7% for AGIs $10k-25k, 0.4% for AGIs $25k-50k, 1.1% for AGIs $50k-75k, 0.1% for AGIs $75k-100k, 5.3% for AGIs over 100k)
Net capital gain/loss: +$2,500 (reported on 9.5% of returns)
Here:
+$2,500
State:
+$11,152
(% of AGI for various income ranges: 0.8% for AGIs $10k-25k, -0.1% for AGIs $50k-75k, 3.3% for AGIs over 100k)
Profit/loss from business: +$2,081 (reported on 14.6% of returns)
Here:
+$2,081
State:
+$9,490
(% of AGI for various income ranges: -1.2% for AGIs below $10k, 5.0% for AGIs $10k-25k, 1.0% for AGIs $25k-50k, -0.1% for AGIs $50k-75k)
Total itemized deductions: $15,526 (22% of AGI, reported on 26.2% of returns)
Here:
$15,526
State:
$19,464
Here:
22.0% of AGI
State:
22.7% of AGI
(% of AGI for various income ranges: 5.6% for AGIs $10k-25k, 9.1% for AGIs $25k-50k, 12.2% for AGIs $50k-75k, 14.8% for AGIs $75k-100k, 14.2% for AGIs over 100k)
Charity contributions deductions: $3,096 (5% of AGI, reported on 24.8% of returns)
Here:
$3,096
State:
$4,035
Here:
4.8% of AGI
State:
4.5% of AGI
(% of AGI for various income ranges: 0.7% for AGIs $10k-25k, 2.0% for AGIs $25k-50k, 2.3% for AGIs $50k-75k, 3.1% for AGIs $75k-100k, 2.3% for AGIs over 100k)
Total tax: $4,229 (reported on 66.8% of returns)
27884:
$4,229
State:
$7,257
(% of AGI for various income ranges: 2.6% for AGIs below $10k, 3.5% for AGIs $10k-25k, 5.7% for AGIs $25k-50k, 8.0% for AGIs $50k-75k, 10.2% for AGIs $75k-100k, 11.4% for AGIs over 100k)
Earned income credit: $1,647 (reported on 23.1% of returns)
Here:
$1,647
State:
$1,851
Percentage of individuals using paid preparers for their 2004 taxes: 65.8%
Here:
66%
State:
62%
(% for various income ranges: 57.5% for AGIs below $10k, 65.8% for AGIs $10k-25k, 71.4% for AGIs $25k-50k, 62.2% for AGIs $50k-75k, 72.7% for AGIs $75k-100k, 77.3% for AGIs over 100k)
Household received Food Stamps/SNAP in the past 12 months: 99 Household did not receive Food Stamps/SNAP in the past 12 months: 386
Women who did not have a birth in the past 12 months: 226 (75 now married, 150 unmarried)
Housing units in zip code 27884 with a mortgage: 245 (21 second mortgage, 22 both second mortgage and home equity loan) Residents with income below the poverty level in 2022:
This zip code:
12.1%
Whole state:
12.8%
Residents with income below 50% of the poverty level in 2022:
This zip code:
6.6%
Whole state:
6.8%
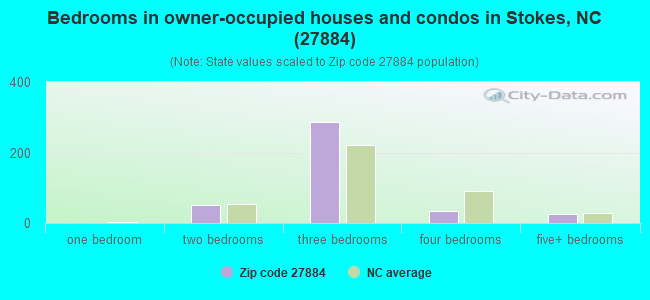
Median number of rooms in houses and condos:
Here:
6.0
State:
6.4
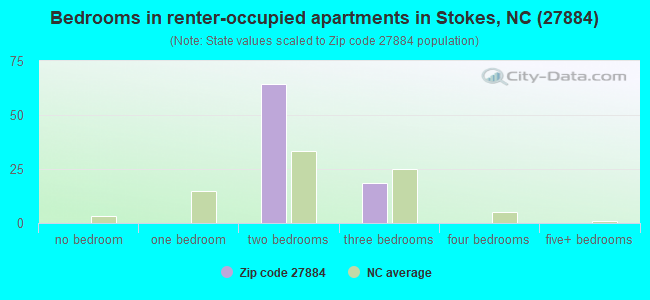
Median number of rooms in apartments:
Here:
3.4
State:
4.4
Notable locations in this zip code not listed on our city pages
Churches in zip code 27884 include: Briery Swamp Church (A), Clemons Grove Chapel (B), Saint Johns Church (C), Sweet Gum Grove Church (D). Display/hide their locations on the map
In group quarters: 1 (-1 institutionalized population)
Size of family households: 125 2-persons, 118 3-persons, 24 4-persons, 19 5-persons, 30 6-persons, 52 7-or-more-persons
Size of nonfamily households: 117 1-person
194 married couples with children.
66 single-parent households (43 men, 23 women).
83.3% of residents of 27884 zip code speak English at home.
15.4% of residents speak Spanish at home (72% very well, 28% not well).
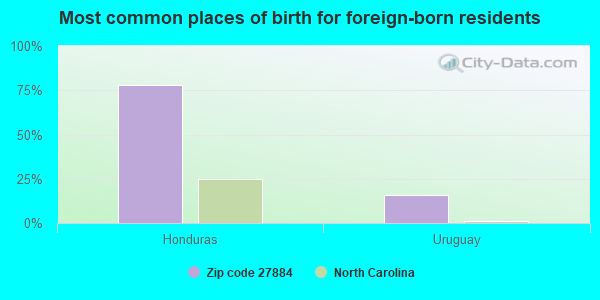
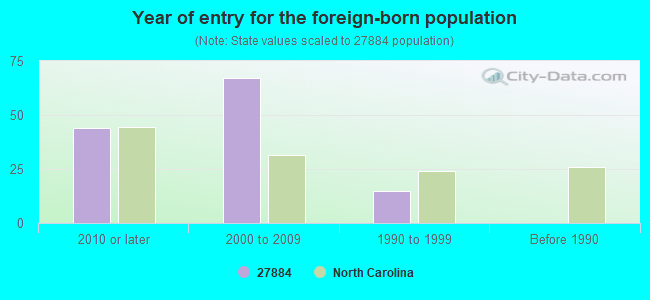
Foreign born population: 124 (7.9%) (14.2% of them are naturalized citizens)
This zip code:
7.9%
Whole state:
8.6%
78%Honduras
16%Uruguay
14%English
10%American
7%Irish
4%German
3%Lebanese
2%Scotch-Irish
Year of entry for the foreign-born population
442010 or later
672000 to 2009
151990 to 1999
0Before 1990
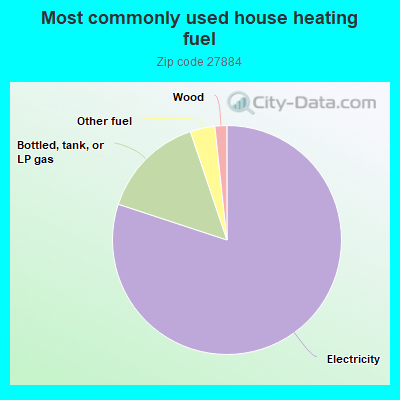
80.3%Electricity
14.8%Bottled, tank, or LP gas
3.5%Other fuel
1.7%Wood
Population in 1990: 922. Population change in the 1990s: +202 (+21.9%).
Place of birth for U.S.-born residents:
This state: 1,228
Northeast: 48
Midwest: 36
South: 60
West: 54
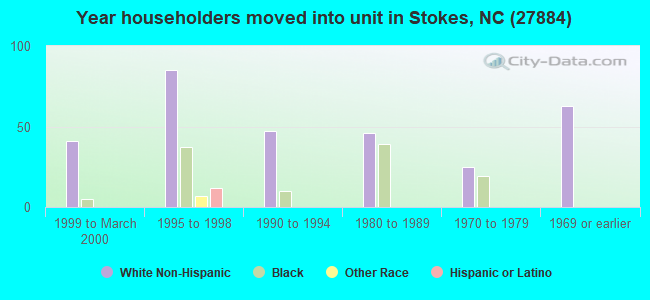
65% of the 27884 zip code residents lived in the same house 5 years ago. Out of people who lived in different houses, 70% lived in this county. Out of people who lived in different counties, 50% lived in North Carolina.
101% of the 27884 zip code residents lived in the same house 1 year ago.
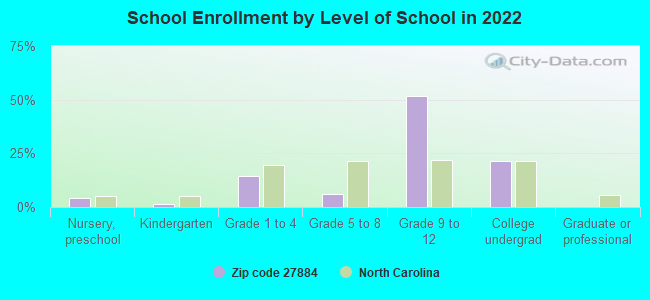
Private vs. public school enrollment:
Students in private schools in grades 1 to 8 (elementary and middle school): 8
Here:
5.4%
North Carolina:
13.8%
Students in private schools in grades 9 to 12 (high school): 25
Here:
6.6%
North Carolina:
11.9%
Students in private undergraduate colleges: 11
Here:
7.0%
North Carolina:
19.3%
Top industries in this zip code by the number of employees in 2005:
Real Estate and Rental and Leasing: All Other Consumer Goods Rental (10-19 employees: 1 establishment)
Health Care and Social Assistance: Residential Mental Retardation Facilities (10-19: 1)
Construction: Poured Concrete Foundation and Structure Contractors (5-9: 1)
Construction: Drywall and Insulation Contractors (5-9: 1)
Other Services (except Public Administration): Religious Organizations (1-4: 2)
Construction: Site Preparation Contractors (1-4: 1)
Utilities: Water Supply and Irrigation Systems (1-4: 1)
Fatal accident statistics in 2010:
Fatal accident count: 1
Vehicles involved in fatal accidents: 2
Fatal accidents caused by drunken drivers: 0
Fatalities: 1
Persons involved in fatal accidents: 2
Pedestrians involved in fatal accidents: 0
Home Mortgage Disclosure Act Aggregated Statistics For Year 2009 (Based on 4 partial tracts)
A) FHA, FSA/RHS & VA Home Purchase Loans
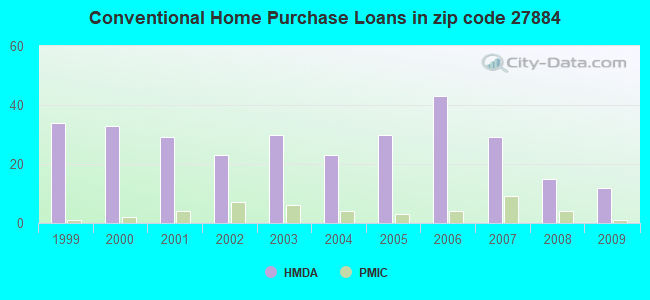
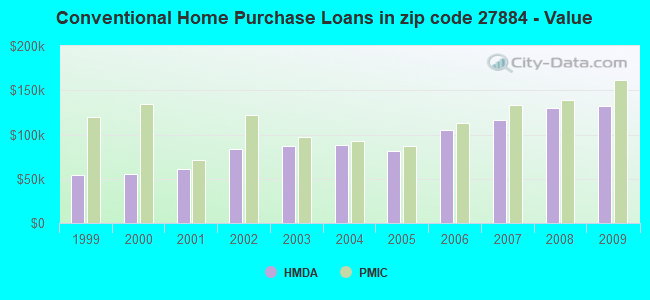
B) Conventional Home Purchase Loans
C) Refinancings
D) Home Improvement Loans
F) Non-occupant Loans on < 5 Family Dwellings (A B C & D)
G) Loans On Manufactured Home Dwelling (A B C & D)
Number
Average Value
Number
Average Value
Number
Average Value
Number
Average Value
Number
Average Value
Number
Average Value
LOANS ORIGINATED
8
$106,989
12
$132,378
34
$142,530
3
$54,500
4
$121,750
10
$60,388
APPLICATIONS APPROVED, NOT ACCEPTED
0
$0
0
$0
4
$84,860
1
$4,160
0
$0
1
$35,630
APPLICATIONS DENIED
5
$104,246
4
$70,250
17
$115,034
2
$16,525
1
$278,290
7
$56,487
APPLICATIONS WITHDRAWN
1
$67,570
2
$111,455
8
$114,358
1
$32,250
1
$39,740
3
$74,997
FILES CLOSED FOR INCOMPLETENESS
0
$0
1
$89,510
2
$106,600
0
$0
0
$0
1
$31,660
Aggregated Statistics For Year 2008 (Based on 4 partial tracts)
A) FHA, FSA/RHS & VA Home Purchase Loans
B) Conventional Home Purchase Loans
C) Refinancings
D) Home Improvement Loans
F) Non-occupant Loans on < 5 Family Dwellings (A B C & D)
G) Loans On Manufactured Home Dwelling (A B C & D)
Number
Average Value
Number
Average Value
Number
Average Value
Number
Average Value
Number
Average Value
Number
Average Value
LOANS ORIGINATED
10
$114,781
15
$129,393
28
$110,714
6
$22,862
6
$105,157
12
$59,525
APPLICATIONS APPROVED, NOT ACCEPTED
1
$68,070
1
$118,180
7
$137,683
2
$13,945
0
$0
1
$81,380
APPLICATIONS DENIED
4
$83,942
6
$114,873
38
$109,522
9
$60,156
2
$139,395
14
$72,210
APPLICATIONS WITHDRAWN
0
$0
0
$0
10
$90,199
2
$57,715
0
$0
2
$58,080
FILES CLOSED FOR INCOMPLETENESS
0
$0
1
$134,320
0
$0
0
$0
0
$0
0
$0
Aggregated Statistics For Year 2007 (Based on 4 partial tracts)
A) FHA, FSA/RHS & VA Home Purchase Loans
B) Conventional Home Purchase Loans
C) Refinancings
D) Home Improvement Loans
F) Non-occupant Loans on < 5 Family Dwellings (A B C & D)
G) Loans On Manufactured Home Dwelling (A B C & D)
Number
Average Value
Number
Average Value
Number
Average Value
Number
Average Value
Number
Average Value
Number
Average Value
LOANS ORIGINATED
7
$78,310
29
$116,313
24
$96,340
4
$36,438
9
$91,719
13
$67,429
APPLICATIONS APPROVED, NOT ACCEPTED
1
$52,230
2
$50,480
10
$100,779
1
$26,470
1
$46,570
2
$48,510
APPLICATIONS DENIED
2
$79,565
10
$100,342
45
$95,008
9
$36,167
2
$35,615
16
$59,696
APPLICATIONS WITHDRAWN
1
$52,890
5
$99,804
13
$105,196
3
$51,287
1
$70,050
4
$71,078
FILES CLOSED FOR INCOMPLETENESS
0
$0
1
$86,380
2
$148,750
0
$0
0
$0
0
$0
Aggregated Statistics For Year 2006 (Based on 4 partial tracts)
A) FHA, FSA/RHS & VA Home Purchase Loans
B) Conventional Home Purchase Loans
C) Refinancings
D) Home Improvement Loans
F) Non-occupant Loans on < 5 Family Dwellings (A B C & D)
G) Loans On Manufactured Home Dwelling (A B C & D)
Number
Average Value
Number
Average Value
Number
Average Value
Number
Average Value
Number
Average Value
Number
Average Value
LOANS ORIGINATED
4
$103,575
43
$105,506
38
$105,292
8
$39,841
14
$86,325
13
$57,790
APPLICATIONS APPROVED, NOT ACCEPTED
0
$0
10
$86,220
9
$82,014
1
$33,190
2
$89,550
4
$56,138
APPLICATIONS DENIED
1
$34,630
17
$70,865
50
$85,640
13
$51,592
3
$66,997
19
$61,558
APPLICATIONS WITHDRAWN
0
$0
6
$75,907
15
$85,972
1
$40,660
2
$49,030
4
$68,195
FILES CLOSED FOR INCOMPLETENESS
0
$0
1
$86,210
3
$83,470
0
$0
0
$0
1
$74,370
Aggregated Statistics For Year 2005 (Based on 4 partial tracts)
A) FHA, FSA/RHS & VA Home Purchase Loans
B) Conventional Home Purchase Loans
C) Refinancings
D) Home Improvement Loans
F) Non-occupant Loans on < 5 Family Dwellings (A B C & D)
G) Loans On Manufactured Home Dwelling (A B C & D)
Number
Average Value
Number
Average Value
Number
Average Value
Number
Average Value
Number
Average Value
Number
Average Value
LOANS ORIGINATED
4
$96,498
30
$81,310
37
$81,697
8
$35,028
11
$60,993
14
$50,695
APPLICATIONS APPROVED, NOT ACCEPTED
1
$63,250
6
$71,497
12
$92,130
1
$29,960
1
$55,210
3
$57,470
APPLICATIONS DENIED
2
$82,350
21
$79,635
53
$81,129
17
$59,921
5
$59,076
32
$62,103
APPLICATIONS WITHDRAWN
1
$62,390
7
$98,459
17
$102,761
2
$64,830
3
$102,987
7
$77,769
FILES CLOSED FOR INCOMPLETENESS
0
$0
2
$91,535
5
$120,128
0
$0
0
$0
1
$117,680
Aggregated Statistics For Year 2004 (Based on 4 partial tracts)
A) FHA, FSA/RHS & VA Home Purchase Loans
B) Conventional Home Purchase Loans
C) Refinancings
D) Home Improvement Loans
F) Non-occupant Loans on < 5 Family Dwellings (A B C & D)
G) Loans On Manufactured Home Dwelling (A B C & D)
Number
Average Value
Number
Average Value
Number
Average Value
Number
Average Value
Number
Average Value
Number
Average Value
LOANS ORIGINATED
5
$96,962
23
$87,812
38
$98,634
7
$47,711
7
$66,364
13
$60,421
APPLICATIONS APPROVED, NOT ACCEPTED
0
$0
5
$52,620
11
$66,658
2
$44,810
1
$51,120
4
$50,642
APPLICATIONS DENIED
1
$88,020
17
$77,199
40
$73,726
11
$43,692
2
$146,155
26
$57,938
APPLICATIONS WITHDRAWN
1
$123,560
6
$66,713
17
$75,996
2
$44,170
1
$66,150
5
$70,932
FILES CLOSED FOR INCOMPLETENESS
0
$0
1
$28,870
2
$100,620
1
$20,470
0
$0
0
$0
Aggregated Statistics For Year 2003 (Based on 4 partial tracts)
A) FHA, FSA/RHS & VA Home Purchase Loans
B) Conventional Home Purchase Loans
C) Refinancings
D) Home Improvement Loans
F) Non-occupant Loans on < 5 Family Dwellings (A B C & D)
Number
Average Value
Number
Average Value
Number
Average Value
Number
Average Value
Number
Average Value
LOANS ORIGINATED
4
$77,328
30
$86,644
72
$90,048
4
$13,292
9
$102,904
APPLICATIONS APPROVED, NOT ACCEPTED
1
$42,000
11
$52,737
13
$85,153
0
$0
1
$69,010
APPLICATIONS DENIED
0
$0
18
$67,537
56
$82,306
5
$38,320
2
$45,675
APPLICATIONS WITHDRAWN
1
$98,670
8
$104,898
18
$94,799
3
$14,583
2
$53,310
FILES CLOSED FOR INCOMPLETENESS
0
$0
0
$0
4
$123,402
0
$0
0
$0
Aggregated Statistics For Year 2002 (Based on 2 partial tracts)
A) FHA, FSA/RHS & VA Home Purchase Loans
B) Conventional Home Purchase Loans
C) Refinancings
D) Home Improvement Loans
F) Non-occupant Loans on < 5 Family Dwellings (A B C & D)
Number
Average Value
Number
Average Value
Number
Average Value
Number
Average Value
Number
Average Value
LOANS ORIGINATED
3
$80,743
23
$83,630
29
$92,753
3
$21,523
5
$91,996
APPLICATIONS APPROVED, NOT ACCEPTED
0
$0
9
$57,298
9
$62,316
3
$31,087
0
$0
APPLICATIONS DENIED
1
$76,800
28
$48,681
33
$67,558
6
$36,152
2
$126,180
APPLICATIONS WITHDRAWN
0
$0
3
$52,890
7
$84,943
0
$0
1
$28,270
FILES CLOSED FOR INCOMPLETENESS
0
$0
0
$0
1
$51,480
0
$0
0
$0
Aggregated Statistics For Year 2001 (Based on 2 partial tracts)
A) FHA, FSA/RHS & VA Home Purchase Loans
B) Conventional Home Purchase Loans
C) Refinancings
D) Home Improvement Loans
F) Non-occupant Loans on < 5 Family Dwellings (A B C & D)
Number
Average Value
Number
Average Value
Number
Average Value
Number
Average Value
Number
Average Value
LOANS ORIGINATED
4
$69,948
29
$60,826
26
$92,662
1
$24,900
1
$120,690
APPLICATIONS APPROVED, NOT ACCEPTED
0
$0
7
$53,594
5
$75,116
2
$37,345
0
$0
APPLICATIONS DENIED
0
$0
34
$46,693
26
$62,132
6
$26,023
2
$43,465
APPLICATIONS WITHDRAWN
0
$0
2
$33,760
7
$63,601
0
$0
0
$0
FILES CLOSED FOR INCOMPLETENESS
0
$0
0
$0
5
$64,820
0
$0
0
$0
Aggregated Statistics For Year 2000 (Based on 2 partial tracts)
A) FHA, FSA/RHS & VA Home Purchase Loans
B) Conventional Home Purchase Loans
C) Refinancings
D) Home Improvement Loans
F) Non-occupant Loans on < 5 Family Dwellings (A B C & D)
Number
Average Value
Number
Average Value
Number
Average Value
Number
Average Value
Number
Average Value
LOANS ORIGINATED
5
$82,036
33
$54,847
11
$72,047
1
$7,600
2
$59,715
APPLICATIONS APPROVED, NOT ACCEPTED
1
$53,170
12
$37,698
7
$52,810
0
$0
1
$66,250
APPLICATIONS DENIED
1
$49,800
25
$41,660
17
$47,189
4
$11,710
2
$40,090
APPLICATIONS WITHDRAWN
1
$38,820
3
$72,723
4
$41,250
1
$28,270
0
$0
FILES CLOSED FOR INCOMPLETENESS
0
$0
0
$0
2
$44,100
0
$0
0
$0
Aggregated Statistics For Year 1999 (Based on 2 partial tracts)
A) FHA, FSA/RHS & VA Home Purchase Loans
B) Conventional Home Purchase Loans
C) Refinancings
D) Home Improvement Loans
F) Non-occupant Loans on < 5 Family Dwellings (A B C & D)
Detailed PMIC statistics for the following Tracts:0009.00
, 0020.02
2004 - 2018 National Fire Incident Reporting System (NFIRS) incidents
Based on the data from the years 2004 - 2018 the average number of fire incidents per year is 10. The highest number of fires - 20 took place in 2008, and the least - 3 in 2004. The data has a growing trend.
When looking into fire subcategories, the most incidents belonged to: Structure Fires (44.2%), and Outside Fires (35.4%).
Fire incident types reported to NFIRS in Zip Code 27884


 Nearest zip codes: 27871, 27834, 27861, 27879, 27812, 27825.


 Based on the data from the years 2004 - 2018 the average number of fire incidents per year is 10. The highest number of fires - 20 took place in 2008, and the least - 3 in 2004. The data has a growing trend.
 When looking into fire subcategories, the most incidents belonged to: Structure Fires (44.2%), and Outside Fires (35.4%).