Estimated zip code population in 2022: 4,917 Zip code population in 2010: 5,227 Zip code population in 2000: 5,064
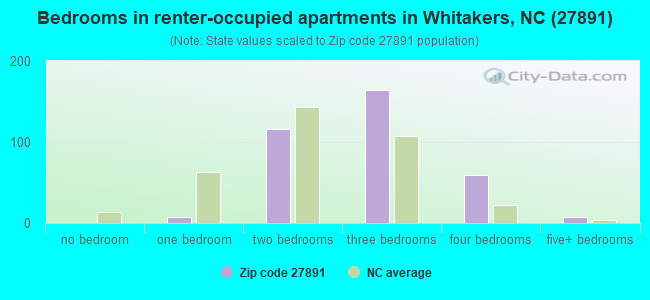
Houses and condos: 2,292 Renter-occupied apartments: 352
% of renters here:
20%
State:
33%
March 2022 cost of living index in zip code 27891: 79.9 (low, U.S. average is 100)
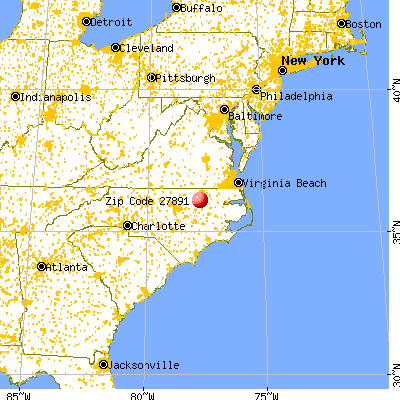
Land area: 141.4 sq. mi. Water area: 0.2 sq. mi.
Population density: 35 people per square mile
(very low).
OSM Map
General Map
Google Map
MSN Map
OSM Map
General Map
Google Map
MSN Map
OSM Map
General Map
Google Map
MSN Map
OSM Map
General Map
Google Map
MSN Map
Please wait while loading the map...
Real estate property taxes paid for housing units in 2022:
This zip code:
0.8% ($1,058)
North Carolina:
0.6% ($1,769)
Median real estate property taxes paid for housing units with mortgages in 2022: $1,144 (0.8%) Median real estate property taxes paid for housing units with no mortgage in 2022: $908 (0.8%)
Business Search- 14 Million verified businesses
Males: 2,681
(54.5%)
Females: 2,234
(45.5%)
For population 25 years and over in 27891:
High school or higher: 77.9%
Bachelor's degree or higher: 9.6%
Graduate or professional degree: 1.7%
Unemployed: 11.6%
Mean travel time to work (commute): 25.4 minutes
For population 15 years and over in 27891:
Never married: 40.7%
Now married: 45.6%
Separated: 1.8%
Widowed: 6.4%
Divorced: 5.5%
Zip code 27891 compared to state average:
Median house value below state average.
Unemployed percentage significantly above state average.
Black race population percentage significantly above state average.
Hispanic race population percentage significantly below state average.
Foreign-born population percentage significantly below state average.
Renting percentage below state average.
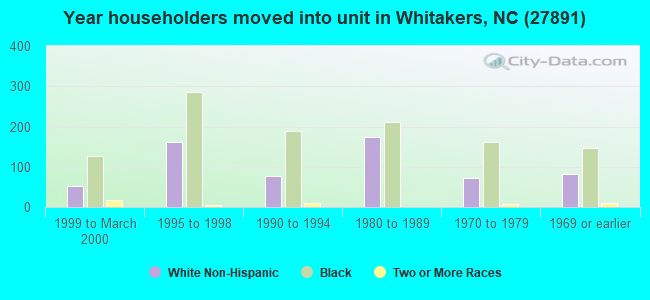
Length of stay since moving in significantly above state average.
Number of college students below state average.
Percentage of population with a bachelor's degree or higher significantly below state average.
Averages for the 2020 tax year for zip code 27891, filed in 2021:
Average Adjusted Gross Income (AGI) in 2020: $40,379 (Individual Income Tax Returns)
Here:
$40,379
State:
$70,020
Salary/wage: $35,855 (reported on 86.5% of returns)
Here:
$35,855
State:
$58,387
(% of AGI for various income ranges: 1395.9% for AGIs below $25k, 4043.4% for AGIs $25k-50k, 7664.8% for AGIs $50k-75k, 11261.1% for AGIs $75k-100k, 19583.3% for AGIs $100k-200k)
Taxable interest for individuals: $465 (reported on 16.3% of returns)
This zip code:
$465
North Carolina:
$1,479
(% of AGI for various income ranges: 3.6% for AGIs below $25k, 7.5% for AGIs $25k-50k, 13.8% for AGIs $50k-75k, 16.7% for AGIs $75k-100k, 63.3% for AGIs $100k-200k)
Ordinary dividends: $4,421 (reported on 5.7% of returns)
Here:
$4,421
State:
$7,888
(% of AGI for various income ranges: 3.7% for AGIs below $25k, 10.0% for AGIs $25k-50k, 54.3% for AGIs $50k-75k, 696.7% for AGIs $100k-200k)
Net capital gain/loss in AGI: +$14,314 (reported on 5.7% of returns)
Here:
+$14,314
State:
+$23,652
(% of AGI for various income ranges: 4.2% for AGIs below $25k, 17.3% for AGIs $25k-50k, 5.7% for AGIs $50k-75k, 186.7% for AGIs $75k-100k, 2816.7% for AGIs $100k-200k)
Profit/loss from business: +$2,473 (reported on 12.2% of returns)
Here:
+$2,473
State:
+$11,710
(% of AGI for various income ranges: 65.0% for AGIs below $25k, 111.9% for AGIs $50k-75k, 25.0% for AGIs $100k-200k)
Taxable individual retirement arrangement distribution: $14,664 (reported on 5.7% of returns)
27891:
$14,664
North Carolina:
$20,247
(% of AGI for various income ranges: 31.6% for AGIs below $25k, 80.7% for AGIs $25k-50k, 265.7% for AGIs $50k-75k, 865.6% for AGIs $75k-100k)
Total itemized deductions: $28,020 (reported on 4.1% of returns)
Here:
$28,020
State:
$34,549
(% of AGI for various income ranges: 115.3% for AGIs $25k-50k, 262.9% for AGIs $50k-75k, 616.7% for AGIs $75k-100k, 1691.7% for AGIs $100k-200k)
Charity contributions: $11,290 (reported on 4.1% of returns)
Here:
$11,290
State:
$13,360
(% of AGI for various income ranges: 37.8% for AGIs $25k-50k, 167.6% for AGIs $50k-75k, 923.3% for AGIs $100k-200k)
Taxes paid: $5,760 (reported on 4.1% of returns)
27891:
$5,760
State:
$7,586
(% of AGI for various income ranges: 14.6% for AGIs $25k-50k, 44.3% for AGIs $50k-75k, 161.1% for AGIs $75k-100k, 420.0% for AGIs $100k-200k)
Earned income credit: $2,356 (reported on 29.0% of returns)
Here:
$2,356
State:
$2,337
(% of AGI for various income ranges: 145.1% for AGIs below $25k, 96.6% for AGIs $25k-50k)
Percentage of individuals using paid preparers for their 2020 taxes: 87.3%
Here:
87%
State:
93%
(% for various income ranges: 87.5% for AGIs below $25k, 88.5% for AGIs $25k-50k, 81.8% for AGIs $50k-75k, 93.3% for AGIs $75k-100k, 84.6% for AGIs $100k-200k, 100.0% for AGIs over 200k)
Averages for the 2012 tax year for zip code 27891, filed in 2013:
Average Adjusted Gross Income (AGI) in 2012: $34,086 (Individual Income Tax Returns)
Here:
$34,086
State:
$54,937
Salary/wage: $30,664 (reported on 90.1% of returns)
Here:
$30,664
State:
$46,336
(% of AGI for various income ranges: 82.0% for AGIs below $25k, 86.9% for AGIs $25k-50k, 83.9% for AGIs $50k-75k, 78.9% for AGIs $75k-100k, 68.1% for AGIs $100k-200k)
Taxable interest for individuals: $512 (reported on 17.9% of returns)
This zip code:
$512
North Carolina:
$1,298
(% of AGI for various income ranges: 0.4% for AGIs below $25k, 0.1% for AGIs $25k-50k, 0.3% for AGIs $50k-75k, 0.5% for AGIs $75k-100k, 0.3% for AGIs $100k-200k)
Ordinary dividends: $2,206 (reported on 7.2% of returns)
Here:
$2,206
State:
$6,213
(% of AGI for various income ranges: 0.4% for AGIs below $25k, 0.3% for AGIs $25k-50k, 0.2% for AGIs $50k-75k, 1.3% for AGIs $75k-100k, 0.6% for AGIs $100k-200k)
Net capital gain/loss in AGI: +$2,008 (reported on 5.8% of returns)
Here:
+$2,008
State:
+$12,740
(% of AGI for various income ranges: 0.2% for AGIs $50k-75k, 1.8% for AGIs $100k-200k)
Profit/loss from business: +$2,985 (reported on 11.7% of returns)
Here:
+$2,985
State:
+$10,311
(% of AGI for various income ranges: 3.6% for AGIs below $25k, 0.2% for AGIs $25k-50k, 1.3% for AGIs $50k-75k)
Taxable individual retirement arrangement distribution: $11,958 (reported on 5.4% of returns)
27891:
$11,958
North Carolina:
$15,575
(% of AGI for various income ranges: 2.2% for AGIs below $25k, 1.1% for AGIs $25k-50k, 1.8% for AGIs $50k-75k, 7.0% for AGIs $75k-100k)
Total itemized deductions: $17,043 (27% of AGI, reported on 23.8% of returns)
Here:
$17,043
State:
$23,438
Here:
27.1% of AGI
State:
21.5% of AGI
(% of AGI for various income ranges: 6.3% for AGIs below $25k, 10.5% for AGIs $25k-50k, 15.8% for AGIs $50k-75k, 13.9% for AGIs $75k-100k, 14.9% for AGIs $100k-200k)
Charity contributions: $3,933 (reported on 20.2% of returns)
Here:
$3,933
State:
$4,687
(% of AGI for various income ranges: 0.9% for AGIs below $25k, 1.9% for AGIs $25k-50k, 3.6% for AGIs $50k-75k, 2.6% for AGIs $75k-100k, 3.1% for AGIs $100k-200k)
Taxes paid: $4,715 (reported on 23.8% of returns)
27891:
$4,715
State:
$8,823
(% of AGI for various income ranges: 1.0% for AGIs below $25k, 2.3% for AGIs $25k-50k, 4.3% for AGIs $50k-75k, 4.2% for AGIs $75k-100k, 5.8% for AGIs $100k-200k)
Earned income credit: $2,461 (reported on 40.4% of returns)
Here:
$2,461
State:
$2,376
(% of AGI for various income ranges: 11.3% for AGIs below $25k, 2.2% for AGIs $25k-50k)
Percentage of individuals using paid preparers for their 2012 taxes: 52.0%
Here:
52%
State:
53%
(% for various income ranges: 53.2% for AGIs below $25k, 49.3% for AGIs $25k-50k, 50.0% for AGIs $50k-75k, 55.6% for AGIs $75k-100k, 60.0% for AGIs $100k-200k)
Averages for the 2004 tax year for zip code 27891, filed in 2005:
Average Adjusted Gross Income (AGI) in 2004: $28,756 (Individual Income Tax Returns)
Here:
$28,756
State:
$45,376
Salary/wage: $27,833 (reported on 90.8% of returns)
Here:
$27,833
State:
$39,442
(% of AGI for various income ranges: 103.1% for AGIs below $10k, 91.2% for AGIs $10k-25k, 89.3% for AGIs $25k-50k, 85.1% for AGIs $50k-75k, 84.6% for AGIs $75k-100k, 78.3% for AGIs over 100k)
Taxable interest for individuals: $821 (reported on 19.8% of returns)
This zip code:
$821
North Carolina:
$1,515
(% of AGI for various income ranges: 2.4% for AGIs below $10k, 0.5% for AGIs $10k-25k, 0.6% for AGIs $25k-50k, 0.4% for AGIs $50k-75k, 0.4% for AGIs $75k-100k, 0.5% for AGIs over 100k)
Taxable dividends: $2,016 (reported on 8.4% of returns)
Here:
$2,016
State:
$4,016
(% of AGI for various income ranges: 1.8% for AGIs below $10k, 0.1% for AGIs $10k-25k, 0.4% for AGIs $25k-50k, 0.7% for AGIs $50k-75k, 1.9% for AGIs $75k-100k, 0.2% for AGIs over 100k)
Net capital gain/loss: +$3,593 (reported on 6.1% of returns)
Here:
+$3,593
State:
+$11,152
(% of AGI for various income ranges: 0.3% for AGIs below $10k, 0.0% for AGIs $10k-25k, 0.3% for AGIs $25k-50k, 1.6% for AGIs $50k-75k, 2.7% for AGIs $75k-100k, 0.1% for AGIs over 100k)
Profit/loss from business: +$4,034 (reported on 9.2% of returns)
Here:
+$4,034
State:
+$9,490
(% of AGI for various income ranges: 5.2% for AGIs below $10k, 0.3% for AGIs $10k-25k, 1.1% for AGIs $25k-50k, 1.6% for AGIs $50k-75k, 3.1% for AGIs $75k-100k)
IRA payment deduction: $2,759 (reported on 1.3% of returns)
27891:
$2,759
North Carolina:
$2,967
Total itemized deductions: $14,541 (28% of AGI, reported on 24.1% of returns)
Here:
$14,541
State:
$19,464
Here:
27.8% of AGI
State:
22.7% of AGI
(% of AGI for various income ranges: 7.4% for AGIs below $10k, 5.2% for AGIs $10k-25k, 13.6% for AGIs $25k-50k, 14.3% for AGIs $50k-75k, 16.3% for AGIs $75k-100k, 15.0% for AGIs over 100k)
Charity contributions deductions: $3,088 (6% of AGI, reported on 20.5% of returns)
Here:
$3,088
State:
$4,035
Here:
5.7% of AGI
State:
4.5% of AGI
(% of AGI for various income ranges: 0.9% for AGIs below $10k, 0.7% for AGIs $10k-25k, 2.5% for AGIs $25k-50k, 2.6% for AGIs $50k-75k, 3.1% for AGIs $75k-100k, 3.3% for AGIs over 100k)
Total tax: $3,170 (reported on 58.4% of returns)
27891:
$3,170
State:
$7,257
(% of AGI for various income ranges: 1.8% for AGIs below $10k, 2.1% for AGIs $10k-25k, 5.1% for AGIs $25k-50k, 8.3% for AGIs $50k-75k, 10.9% for AGIs $75k-100k, 15.0% for AGIs over 100k)
Earned income credit: $1,982 (reported on 37.9% of returns)
Here:
$1,982
State:
$1,851
Percentage of individuals using paid preparers for their 2004 taxes: 62.5%
Here:
62%
State:
62%
(% for various income ranges: 55.6% for AGIs below $10k, 67.7% for AGIs $10k-25k, 60.8% for AGIs $25k-50k, 60.6% for AGIs $50k-75k, 64.5% for AGIs $75k-100k, 68.3% for AGIs over 100k)
Household received Food Stamps/SNAP in the past 12 months: 414 Household did not receive Food Stamps/SNAP in the past 12 months: 1,375
Women who had a birth in the past 12 months: 38 (29 now married, 8 unmarried) Women who did not have a birth in the past 12 months: 794 (380 now married, 414 unmarried)
Housing units in zip code 27891 with a mortgage: 746 (44 second mortgage, 45 both second mortgage and home equity loan) Houses without a mortgage: 3
Median monthly owner costs for units with a mortgage: $1,119 Median monthly owner costs for units without a mortgage: $535
Residents with income below the poverty level in 2022:
This zip code:
19.7%
Whole state:
12.8%
Residents with income below 50% of the poverty level in 2022:
This zip code:
17.7%
Whole state:
6.8%
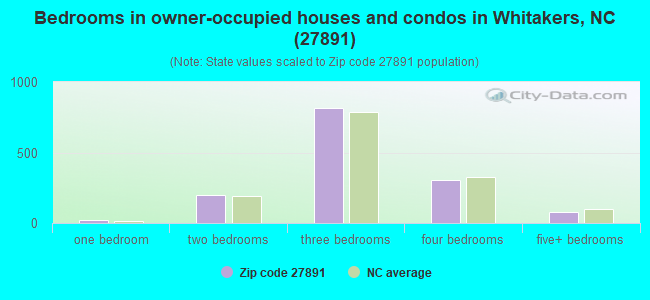
Median number of rooms in houses and condos:
Here:
5.7
State:
6.4
Median number of rooms in apartments:
Here:
5.3
State:
4.4
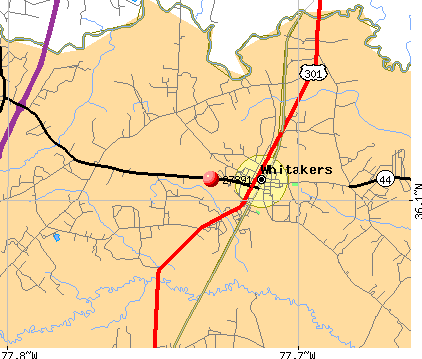
Notable locations in this zip code not listed on our city pages
Churches in zip code 27891 include: Bethany Church (A), Manns Chapel (B), Hickory Church (C), Mount Moriah Church (D), Williams Church (E), Zion Cross Church (F), Pleasure Hill Church (G), Red Hill Church (H), Ebenezer Church (I). Display/hide their locations on the map
Cemeteries: Battle Cemetery (1), Tyler Cemetery (2), Jerusalem Cemetery (3), Bellamy Cemetery (4), Dozier Cemetery (5), Hunter Cemetery (6), Ward Cemetery (7). Display/hide their locations on the map
Streams, rivers, and creeks: Black Swamp (A), Beaverdam Swamp (B), White Oak Swamp (C), Rocky Swamp (D), Pine Log Branch (E), Lane Swamp (F). Display/hide their locations on the map
In group quarters: 4 (-1 institutionalized population)
Size of family households: 522 2-persons, 402 3-persons, 136 4-persons, 127 5-persons, 39 6-persons, 75 7-or-more-persons
Size of nonfamily households: 445 1-person, 28 2-persons
312 married couples with children.
207 single-parent households (53 men, 154 women).
96.9% of residents of 27891 zip code speak English at home.
1.1% of residents speak Spanish at home (80% very well, 6% well, 6% not well, 8% not at all).
0.4% of residents speak other Indo-European language at home (100% very well).
0.1% of residents speak Asian or Pacific Island language at home (100% very well).
1.1% of residents speak other language at home (50% very well, 50% well).
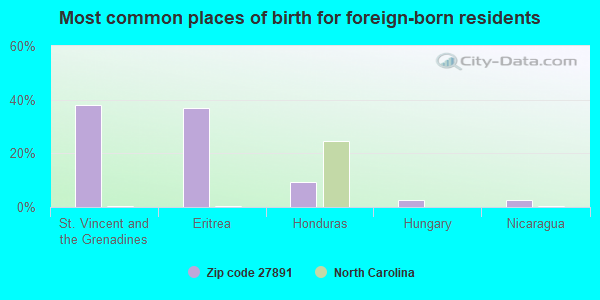
Foreign born population: 77 (1.6%) (73.7% of them are naturalized citizens)
This zip code:
1.6%
Whole state:
8.6%
38%St. Vincent and the Grenadines
37%Eritrea
9%Honduras
3%Hungary
3%Nicaragua
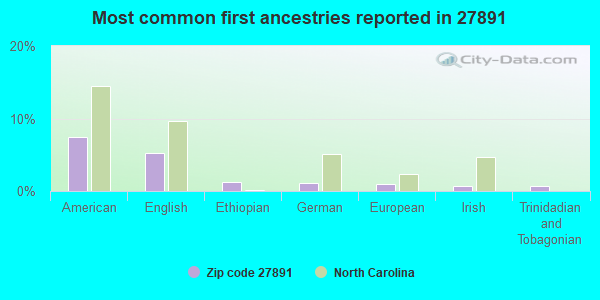
7%American
5%English
1%Ethiopian
1%German
1%European
1%Irish
1%Trinidadian and Tobagonian
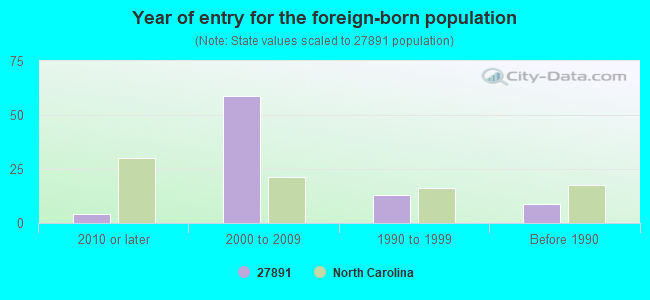
Year of entry for the foreign-born population
42010 or later
592000 to 2009
131990 to 1999
9Before 1990
Facilities with environmental interests located in this zip code:
AMERLINK. LTD. (ROUTE 2, BEASLEY ROAD in WHITAKERS, NC)
AIR MINOR (AIRS/AFS) STATE MASTER (North Carolina facility info) - -115DA4YG00M29W84AX3YRA1R6B, WASTEWATER FACILITY, -2626, AIR PROGRAM STATE MASTER (North Carolina facility info) - UNDERGROUND STORAGE TANK PROGRAM CRITERIA AND HAZARDOUS AIR POLLUTANT INVENTORY (Inventory of air pollution sources) National Pollutant Discharge Elimination System NON-MAJOR (Tracking pollutant discharge elimination systems) - permit National Pollutant Discharge Elimination System NON-MAJOR (Tracking pollutant discharge elimination systems) - permit Business SIC classification: PREFABRICATED WOOD BUILDINGS AND COMPONENTS; NONCLASSIFIABLE ESTABLISHMENTS Business NAICS classification: PREFABRICATED WOOD BUILDING MANUFACTURING.; PREFABRICATED WOOD BUILDING MANUFACTURING. Alternative names: AMERLINK LTD AMERLINK LIMITED, AMERLINK LTD
Housing units lacking complete plumbing facilities: 6.8% Housing units lacking complete kitchen facilities: 2.8%
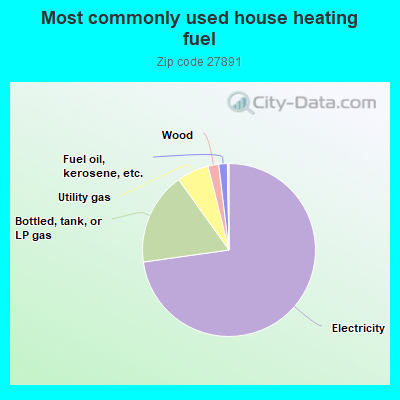
73.0%Electricity
17.4%Bottled, tank, or LP gas
6.0%Utility gas
2.0%Wood
1.6%Fuel oil, kerosene, etc.
Population in 1990: 6,281.
Place of birth for U.S.-born residents:
This state: 4,122
Northeast: 207
Midwest: 89
South: 286
West: 41
68% of the 27891 zip code residents lived in the same house 5 years ago. Out of people who lived in different houses, 56% lived in this county. Out of people who lived in different counties, 50% lived in North Carolina.
91% of the 27891 zip code residents lived in the same house 1 year ago. Out of people who lived in different houses, 14% moved from this county. Out of people who lived in different houses, 83% moved from different county within same state. Out of people who lived in different houses, 9% moved from different state. Out of people who lived in different houses, 2% moved from abroad.
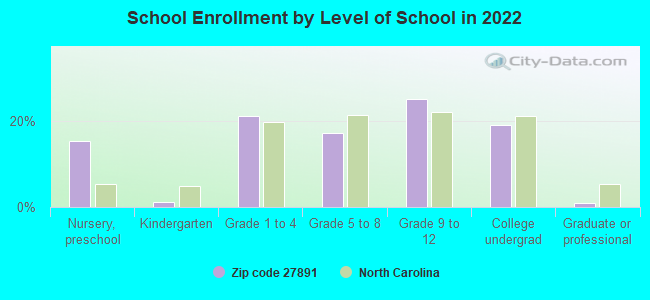
Private vs. public school enrollment:
Students in private schools in grades 1 to 8 (elementary and middle school): 82
Here:
29.5%
North Carolina:
13.8%
Students in private schools in grades 9 to 12 (high school): 14
Here:
8.4%
North Carolina:
11.9%
Students in private undergraduate colleges:
Here:
0.0%
North Carolina:
19.3%
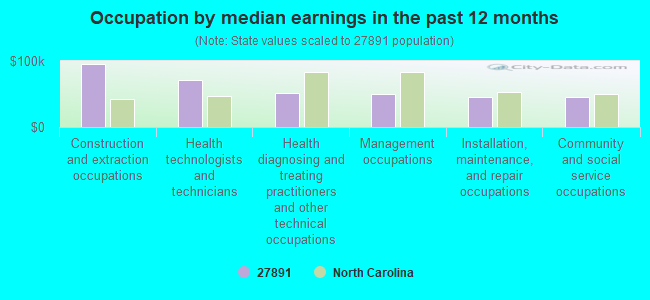
Occupation by median earnings in the past 12 months ($)
94,887Construction and extraction occupations
71,565Health technologists and technicians
51,025Health diagnosing and treating practitioners and other technical occupations
49,711Management occupations
45,934Installation, maintenance, and repair occupations
44,933Community and social service occupations
Top industries in this zip code by the number of employees in 2005:
Accommodation and Food Services: Full-Service Restaurants (50-99 employees: 1 establishment)
Accommodation and Food Services: Food Service Contractors (20-49: 1, 5-9: 1)
Other Services (except Public Administration): Religious Organizations (10-19: 1, 1-4: 1)
Professional, Scientific, and Technical Services: Administrative Management and General Management Consulting Services (10-19: 1)
Other Services (except Public Administration): Civic and Social Organizations (10-19: 1)
Professional, Scientific, and Technical Services: Process, Physical Distribution, and Logistics Consulting Services (10-19: 1)
Other Services (except Public Administration): Funeral Homes and Funeral Services (10-19: 1)
People in group quarters in 2010:
5 people in workers' group living quarters and job corps centers
People in group quarters in 2000:
27 people in agriculture workers' dormitories on farms
5 people in other group homes
3 people in college dormitories (includes college quarters off campus)
Fatal accident statistics in 2012:
Fatal accident count: 2
Vehicles involved in fatal accidents: 3
Fatal accidents caused by drunken drivers: 0
Fatalities: 3
Persons involved in fatal accidents: 4
Pedestrians involved in fatal accidents: 0
Fatal accident statistics in 2011:
Fatal accident count: 1
Vehicles involved in fatal accidents: 1
Fatal accidents caused by drunken drivers: 0
Fatalities: 1
Persons involved in fatal accidents: 1
Pedestrians involved in fatal accidents: 0
Home Mortgage Disclosure Act Aggregated Statistics For Year 2009 (Based on 8 partial tracts)
A) FHA, FSA/RHS & VA Home Purchase Loans
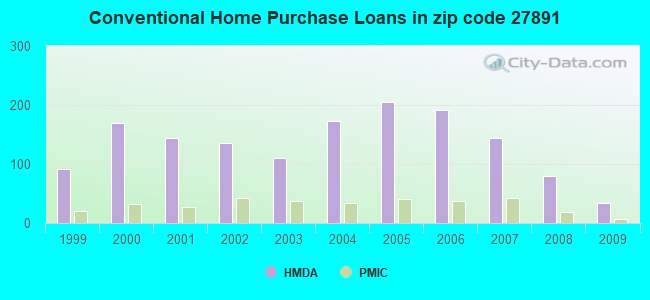
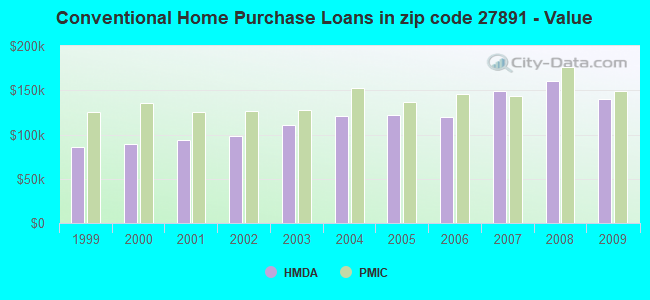
B) Conventional Home Purchase Loans
C) Refinancings
D) Home Improvement Loans
F) Non-occupant Loans on < 5 Family Dwellings (A B C & D)
G) Loans On Manufactured Home Dwelling (A B C & D)
Number
Average Value
Number
Average Value
Number
Average Value
Number
Average Value
Number
Average Value
Number
Average Value
LOANS ORIGINATED
33
$139,461
34
$140,154
192
$152,630
11
$45,325
10
$82,312
14
$66,383
APPLICATIONS APPROVED, NOT ACCEPTED
3
$131,467
6
$79,000
10
$100,973
1
$10,380
3
$61,487
3
$66,157
APPLICATIONS DENIED
10
$119,220
15
$85,672
87
$137,961
16
$18,496
2
$47,530
22
$57,288
APPLICATIONS WITHDRAWN
7
$127,329
4
$151,672
54
$135,716
1
$97,100
1
$69,580
7
$96,179
FILES CLOSED FOR INCOMPLETENESS
4
$95,692
2
$132,025
17
$119,496
1
$94,090
0
$0
8
$80,425
Aggregated Statistics For Year 2008 (Based on 8 partial tracts)
A) FHA, FSA/RHS & VA Home Purchase Loans
B) Conventional Home Purchase Loans
C) Refinancings
D) Home Improvement Loans
F) Non-occupant Loans on < 5 Family Dwellings (A B C & D)
G) Loans On Manufactured Home Dwelling (A B C & D)
Number
Average Value
Number
Average Value
Number
Average Value
Number
Average Value
Number
Average Value
Number
Average Value
LOANS ORIGINATED
40
$127,171
80
$160,607
146
$150,430
30
$41,075
24
$149,788
38
$74,733
APPLICATIONS APPROVED, NOT ACCEPTED
3
$82,740
6
$172,840
25
$110,139
5
$72,132
1
$56,460
8
$85,728
APPLICATIONS DENIED
11
$119,032
28
$106,718
99
$136,879
31
$46,949
15
$80,660
25
$87,649
APPLICATIONS WITHDRAWN
6
$118,703
16
$108,743
40
$140,046
5
$34,024
3
$85,643
8
$101,768
FILES CLOSED FOR INCOMPLETENESS
1
$103,470
2
$317,970
8
$99,305
1
$11,720
1
$130,410
3
$69,180
Aggregated Statistics For Year 2007 (Based on 8 partial tracts)
A) FHA, FSA/RHS & VA Home Purchase Loans
B) Conventional Home Purchase Loans
C) Refinancings
D) Home Improvement Loans
F) Non-occupant Loans on < 5 Family Dwellings (A B C & D)
G) Loans On Manufactured Home Dwelling (A B C & D)
Number
Average Value
Number
Average Value
Number
Average Value
Number
Average Value
Number
Average Value
Number
Average Value
LOANS ORIGINATED
37
$126,182
144
$149,669
161
$131,825
22
$58,563
28
$113,601
43
$73,183
APPLICATIONS APPROVED, NOT ACCEPTED
0
$0
11
$129,481
42
$123,763
8
$83,600
2
$163,295
4
$86,902
APPLICATIONS DENIED
7
$86,106
33
$101,396
158
$101,122
45
$71,914
7
$84,697
50
$70,783
APPLICATIONS WITHDRAWN
9
$117,756
13
$128,802
61
$123,588
5
$108,834
0
$0
18
$88,280
FILES CLOSED FOR INCOMPLETENESS
1
$82,990
6
$114,515
10
$188,846
0
$0
0
$0
1
$82,990
Aggregated Statistics For Year 2006 (Based on 8 partial tracts)
A) FHA, FSA/RHS & VA Home Purchase Loans
B) Conventional Home Purchase Loans
C) Refinancings
D) Home Improvement Loans
F) Non-occupant Loans on < 5 Family Dwellings (A B C & D)
G) Loans On Manufactured Home Dwelling (A B C & D)
Number
Average Value
Number
Average Value
Number
Average Value
Number
Average Value
Number
Average Value
Number
Average Value
LOANS ORIGINATED
26
$109,330
192
$119,349
177
$101,499
37
$35,427
37
$101,876
53
$68,296
APPLICATIONS APPROVED, NOT ACCEPTED
3
$144,693
26
$76,687
36
$93,084
8
$32,480
3
$37,563
15
$68,290
APPLICATIONS DENIED
6
$107,163
74
$96,815
209
$98,624
38
$60,349
13
$76,733
73
$68,132
APPLICATIONS WITHDRAWN
3
$101,543
26
$129,137
60
$117,691
2
$71,495
3
$65,160
7
$71,904
FILES CLOSED FOR INCOMPLETENESS
0
$0
4
$208,235
20
$125,186
2
$64,175
1
$127,960
0
$0
Aggregated Statistics For Year 2005 (Based on 8 partial tracts)
A) FHA, FSA/RHS & VA Home Purchase Loans
B) Conventional Home Purchase Loans
C) Refinancings
D) Home Improvement Loans
F) Non-occupant Loans on < 5 Family Dwellings (A B C & D)
G) Loans On Manufactured Home Dwelling (A B C & D)
Number
Average Value
Number
Average Value
Number
Average Value
Number
Average Value
Number
Average Value
Number
Average Value
LOANS ORIGINATED
36
$118,637
205
$121,528
181
$107,628
44
$33,000
30
$93,134
49
$67,882
APPLICATIONS APPROVED, NOT ACCEPTED
2
$102,780
21
$73,094
30
$89,436
7
$40,403
4
$87,262
11
$48,481
APPLICATIONS DENIED
4
$108,855
77
$79,981
210
$96,066
34
$42,786
5
$75,434
96
$60,406
APPLICATIONS WITHDRAWN
4
$88,338
21
$115,569
80
$123,672
9
$127,650
1
$56,600
17
$68,432
FILES CLOSED FOR INCOMPLETENESS
3
$78,310
6
$69,730
28
$126,940
3
$48,640
0
$0
4
$68,190
Aggregated Statistics For Year 2004 (Based on 8 partial tracts)
A) FHA, FSA/RHS & VA Home Purchase Loans
B) Conventional Home Purchase Loans
C) Refinancings
D) Home Improvement Loans
F) Non-occupant Loans on < 5 Family Dwellings (A B C & D)
G) Loans On Manufactured Home Dwelling (A B C & D)
Number
Average Value
Number
Average Value
Number
Average Value
Number
Average Value
Number
Average Value
Number
Average Value
LOANS ORIGINATED
20
$116,351
173
$120,723
200
$102,471
19
$34,472
32
$107,445
44
$60,770
APPLICATIONS APPROVED, NOT ACCEPTED
0
$0
20
$119,108
43
$78,537
4
$46,328
3
$74,217
12
$40,958
APPLICATIONS DENIED
17
$90,205
55
$69,826
222
$90,119
36
$26,090
11
$79,882
91
$61,566
APPLICATIONS WITHDRAWN
4
$77,888
25
$119,749
72
$121,812
7
$23,827
3
$132,770
11
$65,582
FILES CLOSED FOR INCOMPLETENESS
1
$144,030
4
$100,128
16
$126,302
0
$0
1
$161,090
2
$96,770
Aggregated Statistics For Year 2003 (Based on 8 partial tracts)
A) FHA, FSA/RHS & VA Home Purchase Loans
B) Conventional Home Purchase Loans
C) Refinancings
D) Home Improvement Loans
F) Non-occupant Loans on < 5 Family Dwellings (A B C & D)
Number
Average Value
Number
Average Value
Number
Average Value
Number
Average Value
Number
Average Value
LOANS ORIGINATED
21
$119,569
110
$110,784
448
$112,378
23
$29,155
28
$76,250
APPLICATIONS APPROVED, NOT ACCEPTED
1
$79,040
30
$76,349
69
$122,333
8
$29,885
6
$76,733
APPLICATIONS DENIED
8
$66,445
71
$62,614
210
$86,516
23
$25,745
12
$76,537
APPLICATIONS WITHDRAWN
6
$104,833
10
$105,978
76
$97,472
4
$12,420
4
$73,858
FILES CLOSED FOR INCOMPLETENESS
1
$85,990
3
$123,070
8
$100,399
0
$0
0
$0
Aggregated Statistics For Year 2002 (Based on 8 partial tracts)
A) FHA, FSA/RHS & VA Home Purchase Loans
B) Conventional Home Purchase Loans
C) Refinancings
D) Home Improvement Loans
F) Non-occupant Loans on < 5 Family Dwellings (A B C & D)
Number
Average Value
Number
Average Value
Number
Average Value
Number
Average Value
Number
Average Value
LOANS ORIGINATED
30
$100,884
135
$98,350
281
$112,581
19
$28,098
18
$70,086
APPLICATIONS APPROVED, NOT ACCEPTED
2
$25,190
30
$48,655
50
$94,025
6
$28,110
0
$0
APPLICATIONS DENIED
6
$90,182
91
$49,511
197
$72,753
35
$23,873
9
$29,184
APPLICATIONS WITHDRAWN
1
$94,680
11
$127,278
74
$99,250
8
$27,871
3
$50,057
FILES CLOSED FOR INCOMPLETENESS
3
$74,990
5
$98,814
13
$101,362
2
$37,455
0
$0
Aggregated Statistics For Year 2001 (Based on 8 partial tracts)
A) FHA, FSA/RHS & VA Home Purchase Loans
B) Conventional Home Purchase Loans
C) Refinancings
D) Home Improvement Loans
F) Non-occupant Loans on < 5 Family Dwellings (A B C & D)
Number
Average Value
Number
Average Value
Number
Average Value
Number
Average Value
Number
Average Value
LOANS ORIGINATED
14
$111,381
144
$94,318
263
$105,016
7
$28,626
13
$172,502
APPLICATIONS APPROVED, NOT ACCEPTED
4
$62,205
59
$52,130
38
$82,636
6
$30,965
6
$42,458
APPLICATIONS DENIED
4
$74,328
152
$53,532
142
$77,310
10
$23,231
7
$39,769
APPLICATIONS WITHDRAWN
1
$98,790
19
$73,887
81
$79,456
1
$61,670
1
$82,990
FILES CLOSED FOR INCOMPLETENESS
0
$0
2
$57,750
25
$71,208
0
$0
0
$0
Aggregated Statistics For Year 2000 (Based on 8 partial tracts)
A) FHA, FSA/RHS & VA Home Purchase Loans
B) Conventional Home Purchase Loans
C) Refinancings
D) Home Improvement Loans
E) Loans on Dwellings For 5+ Families
F) Non-occupant Loans on < 5 Family Dwellings (A B C & D)
Number
Average Value
Number
Average Value
Number
Average Value
Number
Average Value
Number
Average Value
Number
Average Value
LOANS ORIGINATED
20
$80,607
170
$89,685
111
$78,850
18
$13,196
1
$560,970
13
$119,927
APPLICATIONS APPROVED, NOT ACCEPTED
18
$33,319
60
$50,811
40
$65,639
5
$6,816
0
$0
3
$34,730
APPLICATIONS DENIED
39
$34,134
206
$50,550
154
$63,146
28
$12,699
0
$0
9
$53,107
APPLICATIONS WITHDRAWN
3
$75,963
20
$66,632
50
$71,962
3
$59,310
0
$0
5
$56,472
FILES CLOSED FOR INCOMPLETENESS
0
$0
2
$103,770
13
$62,083
0
$0
0
$0
0
$0
Aggregated Statistics For Year 1999 (Based on 4 partial tracts)
A) FHA, FSA/RHS & VA Home Purchase Loans
B) Conventional Home Purchase Loans
C) Refinancings
D) Home Improvement Loans
F) Non-occupant Loans on < 5 Family Dwellings (A B C & D)
2002 - 2018 National Fire Incident Reporting System (NFIRS) incidents
Based on the data from the years 2002 - 2018 the average number of fire incidents per year is 44. The highest number of fire incidents - 100 took place in 2011, and the least - 2 in 2004. The data has an increasing trend.
When looking into fire subcategories, the most reports belonged to: Structure Fires (48.3%), and Outside Fires (31.9%).
Fire incident types reported to NFIRS in Zip Code 27891


 Nearest zip codes: 27809, 27823, 27804, 27801, 27803, 27878.


 Based on the data from the years 2002 - 2018 the average number of fire incidents per year is 44. The highest number of fire incidents - 100 took place in 2011, and the least - 2 in 2004. The data has an increasing trend.
 When looking into fire subcategories, the most reports belonged to: Structure Fires (48.3%), and Outside Fires (31.9%).