Estimated zip code population in 2022: 2,071 Zip code population in 2010: 1,915 Zip code population in 2000: 1,651
Houses and condos: 851 Renter-occupied apartments: 161
% of renters here:
23%
State:
33%
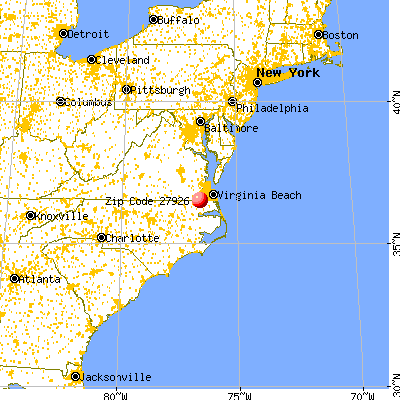
March 2022 cost of living index in zip code 27926: 83.0 (low, U.S. average is 100)
Land area: 35.8 sq. mi. Water area: 0.0 sq. mi.
Population density: 58 people per square mile
(very low).
OSM Map
General Map
Google Map
MSN Map
OSM Map
General Map
Google Map
MSN Map
OSM Map
General Map
Google Map
MSN Map
OSM Map
General Map
Google Map
MSN Map
Please wait while loading the map...
Real estate property taxes paid for housing units in 2022:
This zip code:
0.5% ($1,426)
North Carolina:
0.6% ($1,769)
Median real estate property taxes paid for housing units with mortgages in 2022: $1,956 (0.6%) Median real estate property taxes paid for housing units with no mortgage in 2022: $1,243 (0.5%)
Business Search- 14 Million verified businesses
Males: 1,026
(49.6%)
Females: 1,044
(50.4%)
For population 25 years and over in 27926:
High school or higher: 84.0%
Bachelor's degree or higher: 11.6%
Graduate or professional degree: 4.6%
Unemployed: 3.6%
Mean travel time to work (commute): 38.3 minutes
For population 15 years and over in 27926:
Never married: 26.2%
Now married: 42.8%
Separated: 1.7%
Widowed: 7.1%
Divorced: 22.2%
Zip code 27926 compared to state average:
Hispanic race population percentage significantly below state average.
Median age significantly above state average.
Foreign-born population percentage significantly below state average.
Length of stay since moving in significantly above state average.
Percentage of population with a bachelor's degree or higher significantly below state average.
Estimated median house/condo value in 2022: $269,849
27926:
$269,849
North Carolina:
$280,600
According to our research of North Carolina and other state lists, there were 5 registered sex offenders living in 27926 zip code as of May 28, 2024. The ratio of all residents to sex offenders in zip code 27926 is 341 to 1.
Median resident age:
This zip code:
50.2 years
North Carolina median age:
39.2 years
Average household size:
This zip code:
2.9 people
North Carolina:
2.4 people
Averages for the 2020 tax year for zip code 27926, filed in 2021:
Average Adjusted Gross Income (AGI) in 2020: $52,437 (Individual Income Tax Returns)
Here:
$52,437
State:
$70,020
Salary/wage: $46,707 (reported on 82.9% of returns)
Here:
$46,707
State:
$58,387
(% of AGI for various income ranges: 1111.2% for AGIs below $25k, 3719.2% for AGIs $25k-50k, 7196.7% for AGIs $50k-75k, 10396.0% for AGIs $75k-100k, 17382.0% for AGIs $100k-200k)
Taxable interest for individuals: $465 (reported on 24.3% of returns)
This zip code:
$465
North Carolina:
$1,479
(% of AGI for various income ranges: 7.1% for AGIs below $25k, 10.8% for AGIs $25k-50k, 15.6% for AGIs $50k-75k, 6.0% for AGIs $75k-100k, 72.0% for AGIs $100k-200k)
Ordinary dividends: $1,343 (reported on 10.0% of returns)
Here:
$1,343
State:
$7,888
(% of AGI for various income ranges: 11.8% for AGIs below $25k, 36.7% for AGIs $50k-75k, 82.0% for AGIs $100k-200k)
Net capital gain/loss in AGI: +$6,740 (reported on 7.1% of returns)
Here:
+$6,740
State:
+$23,652
(% of AGI for various income ranges: 65.4% for AGIs $25k-50k, 504.0% for AGIs $100k-200k)
Profit/loss from business: +$7,000 (reported on 12.9% of returns)
Here:
+$7,000
State:
+$11,710
(% of AGI for various income ranges: 148.8% for AGIs below $25k, 33.1% for AGIs $25k-50k, 668.0% for AGIs $75k-100k)
Taxable individual retirement arrangement distribution: $11,333 (reported on 8.6% of returns)
27926:
$11,333
North Carolina:
$20,247
(% of AGI for various income ranges: 143.5% for AGIs below $25k, 484.4% for AGIs $50k-75k)
Total itemized deductions: $26,375 (reported on 5.7% of returns)
Here:
$26,375
State:
$34,549
(% of AGI for various income ranges: 2110.0% for AGIs $75k-100k)
Charity contributions: $9,533 (reported on 4.3% of returns)
Here:
$9,533
State:
$13,360
(% of AGI for various income ranges: 572.0% for AGIs $75k-100k)
Taxes paid: $6,275 (reported on 5.7% of returns)
27926:
$6,275
State:
$7,586
(% of AGI for various income ranges: 502.0% for AGIs $75k-100k)
Earned income credit: $2,408 (reported on 17.1% of returns)
Here:
$2,408
State:
$2,337
(% of AGI for various income ranges: 126.5% for AGIs below $25k, 56.9% for AGIs $25k-50k)
Percentage of individuals using paid preparers for their 2020 taxes: 92.9%
Here:
93%
State:
93%
(% for various income ranges: 91.3% for AGIs below $25k, 94.1% for AGIs $25k-50k, 92.3% for AGIs $50k-75k, 87.5% for AGIs $75k-100k, 100.0% for AGIs $100k-200k)
Averages for the 2012 tax year for zip code 27926, filed in 2013:
Average Adjusted Gross Income (AGI) in 2012: $44,483 (Individual Income Tax Returns)
Here:
$44,483
State:
$54,937
Salary/wage: $39,081 (reported on 87.7% of returns)
Here:
$39,081
State:
$46,336
(% of AGI for various income ranges: 76.0% for AGIs below $25k, 83.9% for AGIs $25k-50k, 83.9% for AGIs $50k-75k, 80.8% for AGIs $75k-100k, 62.2% for AGIs $100k-200k)
Taxable interest for individuals: $359 (reported on 26.2% of returns)
This zip code:
$359
North Carolina:
$1,298
(% of AGI for various income ranges: 0.4% for AGIs below $25k, 0.2% for AGIs $25k-50k, 0.2% for AGIs $50k-75k, 0.2% for AGIs $75k-100k, 0.1% for AGIs $100k-200k)
Ordinary dividends: $667 (reported on 9.2% of returns)
Here:
$667
State:
$6,213
Net capital gain/loss in AGI: +$1,850 (reported on 6.2% of returns)
Here:
+$1,850
State:
+$12,740
Profit/loss from business: +$4,338 (reported on 12.3% of returns)
Here:
+$4,338
State:
+$10,311
(% of AGI for various income ranges: 3.0% for AGIs below $25k, 0.5% for AGIs $25k-50k, 4.7% for AGIs $75k-100k)
Taxable individual retirement arrangement distribution: $8,280 (reported on 7.7% of returns)
27926:
$8,280
North Carolina:
$15,575
Total itemized deductions: $17,248 (25% of AGI, reported on 32.3% of returns)
Here:
$17,248
State:
$23,438
Here:
24.9% of AGI
State:
21.5% of AGI
(% of AGI for various income ranges: 12.4% for AGIs below $25k, 11.0% for AGIs $25k-50k, 11.2% for AGIs $50k-75k, 14.9% for AGIs $75k-100k, 13.7% for AGIs $100k-200k)
Charity contributions: $2,481 (reported on 24.6% of returns)
Here:
$2,481
State:
$4,687
(% of AGI for various income ranges: 1.7% for AGIs $25k-50k, 1.0% for AGIs $50k-75k, 1.9% for AGIs $75k-100k, 1.7% for AGIs $100k-200k)
Taxes paid: $4,881 (reported on 32.3% of returns)
27926:
$4,881
State:
$8,823
(% of AGI for various income ranges: 1.7% for AGIs below $25k, 2.0% for AGIs $25k-50k, 3.2% for AGIs $50k-75k, 4.3% for AGIs $75k-100k, 5.5% for AGIs $100k-200k)
Earned income credit: $2,340 (reported on 23.1% of returns)
Here:
$2,340
State:
$2,376
(% of AGI for various income ranges: 8.2% for AGIs below $25k, 1.5% for AGIs $25k-50k)
Percentage of individuals using paid preparers for their 2012 taxes: 56.9%
Here:
57%
State:
53%
(% for various income ranges: 56.0% for AGIs below $25k, 52.9% for AGIs $25k-50k, 58.3% for AGIs $50k-75k, 66.7% for AGIs $75k-100k, 60.0% for AGIs $100k-200k)
Averages for the 2004 tax year for zip code 27926, filed in 2005:
Average Adjusted Gross Income (AGI) in 2004: $36,175 (Individual Income Tax Returns)
Here:
$36,175
State:
$45,376
Salary/wage: $33,705 (reported on 89.0% of returns)
Here:
$33,705
State:
$39,442
(% of AGI for various income ranges: 100.0% for AGIs below $10k, 80.6% for AGIs $10k-25k, 80.8% for AGIs $25k-50k, 87.4% for AGIs $50k-75k, 89.3% for AGIs $75k-100k, 71.6% for AGIs over 100k)
Taxable interest for individuals: $923 (reported on 32.7% of returns)
This zip code:
$923
North Carolina:
$1,515
(% of AGI for various income ranges: 3.7% for AGIs below $10k, 1.9% for AGIs $10k-25k, 0.9% for AGIs $25k-50k, 0.1% for AGIs $50k-75k, 0.4% for AGIs $75k-100k, 1.2% for AGIs over 100k)
Taxable dividends: $455 (reported on 9.8% of returns)
Here:
$455
State:
$4,016
(% of AGI for various income ranges: 0.1% for AGIs $10k-25k, 0.2% for AGIs $25k-50k, 0.0% for AGIs $50k-75k, 0.1% for AGIs $75k-100k, 0.3% for AGIs over 100k)
Net capital gain/loss: +$6,283 (reported on 8.9% of returns)
Here:
+$6,283
State:
+$11,152
(% of AGI for various income ranges: 0.5% for AGIs $10k-25k, -0.2% for AGIs $25k-50k, 1.7% for AGIs $50k-75k, 7.7% for AGIs $75k-100k)
Profit/loss from business: +$7,880 (reported on 12.3% of returns)
Here:
+$7,880
State:
+$9,490
Total itemized deductions: $14,751 (25% of AGI, reported on 26.9% of returns)
Here:
$14,751
State:
$19,464
Here:
24.6% of AGI
State:
22.7% of AGI
(% of AGI for various income ranges: 11.7% for AGIs $10k-25k, 7.7% for AGIs $25k-50k, 11.4% for AGIs $50k-75k, 14.9% for AGIs $75k-100k, 14.0% for AGIs over 100k)
Charity contributions deductions: $2,195 (4% of AGI, reported on 23.6% of returns)
Here:
$2,195
State:
$4,035
Here:
3.7% of AGI
State:
4.5% of AGI
(% of AGI for various income ranges: 1.5% for AGIs $10k-25k, 1.2% for AGIs $25k-50k, 1.7% for AGIs $50k-75k, 2.0% for AGIs $75k-100k, 1.1% for AGIs over 100k)
Total tax: $4,103 (reported on 70.7% of returns)
27926:
$4,103
State:
$7,257
(% of AGI for various income ranges: 1.9% for AGIs below $10k, 3.5% for AGIs $10k-25k, 6.2% for AGIs $25k-50k, 8.2% for AGIs $50k-75k, 9.5% for AGIs $75k-100k, 15.1% for AGIs over 100k)
Earned income credit: $1,807 (reported on 22.3% of returns)
Here:
$1,807
State:
$1,851
Percentage of individuals using paid preparers for their 2004 taxes: 58.8%
Here:
59%
State:
62%
(% for various income ranges: 54.7% for AGIs below $10k, 55.7% for AGIs $10k-25k, 61.2% for AGIs $25k-50k, 58.4% for AGIs $50k-75k, 74.4% for AGIs $75k-100k, 60.0% for AGIs over 100k)
Household received Food Stamps/SNAP in the past 12 months: 86 Household did not receive Food Stamps/SNAP in the past 12 months: 629
Women who did not have a birth in the past 12 months: 333 (70 now married, 261 unmarried)
Housing units in zip code 27926 with a mortgage: 220 (3 second mortgage, 3 both second mortgage and home equity loan) Median monthly owner costs for units with a mortgage: $1,441 Median monthly owner costs for units without a mortgage: $459
Residents with income below the poverty level in 2022:
This zip code:
24.5%
Whole state:
12.8%
Residents with income below 50% of the poverty level in 2022:
This zip code:
11.4%
Whole state:
6.8%
Median number of rooms in houses and condos:
Here:
6.3
State:
6.4
Median number of rooms in apartments:
Here:
4.9
State:
4.4
Notable locations in this zip code not listed on our city pages
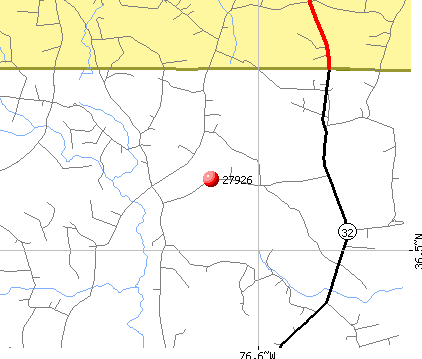
Churches in zip code 27926 include: Union Branch Church (A), New Middle Swamp Church (B), Zion Church (C), Eureka Church (D), Parker Church (E). Display/hide their locations on the map
Reservoirs and swamps: Jones Millpond (A), Hall Pocosin (B), Middle Swamp (C), Black Mingle Pocosin (D), Goodman Swamp (E). Display/hide their locations on the map
Streams, rivers, and creeks: Corapeake Swamp (A), Adams Swamp (B), Taylor Swamp (C), Middle Swamp (D), Goodman Swamp (E). Display/hide their locations on the map
Size of family households: 295 2-persons, 76 3-persons, 9 4-persons, 22 5-persons, 41 7-or-more-persons
Size of nonfamily households: 250 1-person, 26 2-persons
56 married couples with children.
68 single-parent households (68 women).
100.1% of residents of 27926 zip code speak English at home.
Foreign born population: 9 (0.5%) (100.0% of them are naturalized citizens)
This zip code:
0.5%
Whole state:
8.6%
100%France
23%American
11%English
5%Italian
2%Haitian
2%Irish
2%Welsh
Year of entry for the foreign-born population
02010 or later
152000 to 2009
01990 to 1999
9Before 1990
Facilities with environmental interests located in this zip code:
CORAPEAKE COLLISION CENTER (1017 NC HWY 32 N in CORAPEAKE, NC)
Conditionally Exempt Small Quantity Generators, less than 100 kg/month of hazardous waste (Resource Conservation and Recovery Act (tracking hazardous waste)) - notification Organizations: JOSEPH E HEWITT (CONTACT/OWNER)
Housing units lacking complete plumbing facilities: 2.9%
63.2%Electricity
31.9%Bottled, tank, or LP gas
3.4%Other fuel
1.8%Wood
Population in 1990: 1,377. Population change in the 1990s: +274 (+19.9%).
Place of birth for U.S.-born residents:
This state: 541
Northeast: 113
Midwest: 106
South: 1,303
63% of the 27926 zip code residents lived in the same house 5 years ago. Out of people who lived in different houses, 21% lived in this county. Out of people who lived in different counties, 50% lived in North Carolina.
89% of the 27926 zip code residents lived in the same house 1 year ago. Out of people who lived in different houses, 44% moved from this county. Out of people who lived in different houses, 56% moved from different state.
Private vs. public school enrollment:
Students in private schools in grades 1 to 8 (elementary and middle school): 33
Here:
11.8%
North Carolina:
13.8%
Students in private schools in grades 9 to 12 (high school): 23
Here:
30.3%
North Carolina:
11.9%
Students in private undergraduate colleges:
Here:
0.0%
North Carolina:
19.3%
Occupation by median earnings in the past 12 months ($)
47,216Installation, maintenance, and repair occupations
38,606Office and administrative support occupations
32,250Sales and related occupations
7,646Construction and extraction occupations
Top industries in this zip code by the number of employees in 2005:
Accommodation and Food Services: Full-Service Restaurants (10-19 employees: 1 establishment)
Professional, Scientific, and Technical Services: Veterinary Services (10-19: 1)
Other Services (except Public Administration): Religious Organizations (5-9: 1)
Other Services (except Public Administration): General Automotive Repair (1-4: 1)
2002 - 2018 National Fire Incident Reporting System (NFIRS) incidents
According to the data from the years 2002 - 2018 the average number of fires per year is 9. The highest number of fire incidents - 19 took place in 2009, and the least - 3 in 2013. The data has a decreasing trend.
When looking into fire subcategories, the most incidents belonged to: Structure Fires (40.0%), and Outside Fires (36.7%).
Fire incident types reported to NFIRS in Zip Code 27926


 Nearest zip codes: 27979, 23438, 27946, 27938, 27937, 23434.


 According to the data from the years 2002 - 2018 the average number of fires per year is 9. The highest number of fire incidents - 19 took place in 2009, and the least - 3 in 2013. The data has a decreasing trend.
 When looking into fire subcategories, the most incidents belonged to: Structure Fires (40.0%), and Outside Fires (36.7%).