Estimated zip code population in 2022: 1,306 Zip code population in 2010: 542 Zip code population in 2000: 648
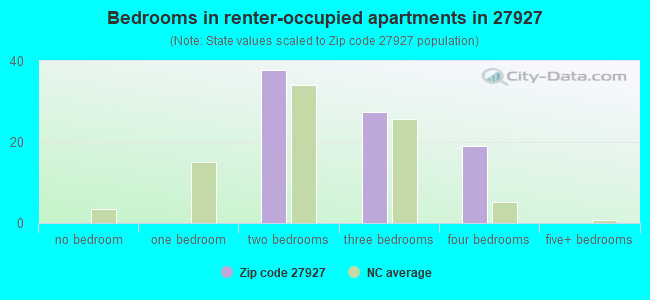
Houses and condos: 4,853 Renter-occupied apartments: 83
% of renters here:
13%
State:
33%
March 2022 cost of living index in zip code 27927: 86.3 (less than average, U.S. average is 100)
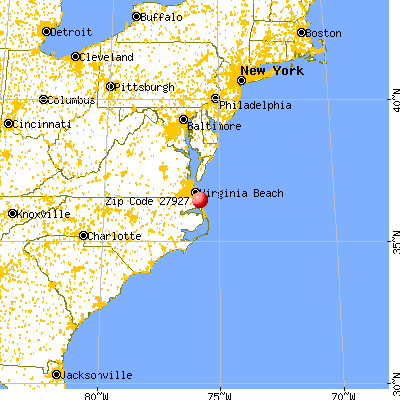
Land area: 26.6 sq. mi. Water area: 43.5 sq. mi.
Population density: 49 people per square mile
(very low).
OSM Map
General Map
Google Map
MSN Map
OSM Map
General Map
Google Map
MSN Map
OSM Map
General Map
Google Map
MSN Map
OSM Map
General Map
Google Map
MSN Map
Please wait while loading the map...
Real estate property taxes paid for housing units in 2022:
This zip code:
0.5% ($3,070)
North Carolina:
0.6% ($1,769)
Median real estate property taxes paid for housing units with mortgages in 2022: $3,253 (0.5%) Median real estate property taxes paid for housing units with no mortgage in 2022: $2,737 (0.5%)
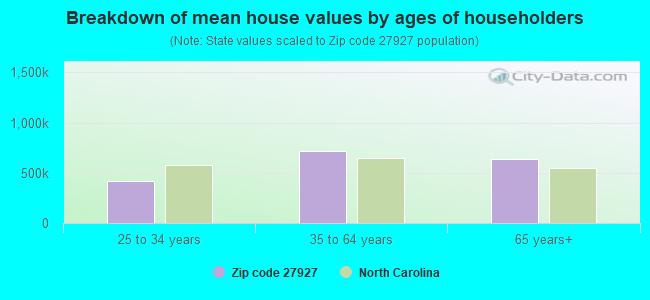
Estimated median house/condo value in 2022: $647,088
27927:
$647,088
North Carolina:
$280,600
According to our research of North Carolina and other state lists, there were 3 registered sex offenders living in 27927 zip code as of May 28, 2024. The ratio of all residents to sex offenders in zip code 27927 is 248 to 1.
Median resident age:
This zip code:
62.1 years
North Carolina median age:
39.2 years
Average household size:
This zip code:
2.0 people
North Carolina:
2.4 people
Averages for the 2020 tax year for zip code 27927, filed in 2021:
Average Adjusted Gross Income (AGI) in 2020: $119,796 (Individual Income Tax Returns)
Here:
$119,796
State:
$70,020
Salary/wage: $77,602 (reported on 73.1% of returns)
Here:
$77,602
State:
$58,387
(% of AGI for various income ranges: 1387.7% for AGIs below $25k, 3834.0% for AGIs $25k-50k, 5294.0% for AGIs $50k-75k, 6917.5% for AGIs $75k-100k, 11566.2% for AGIs $100k-200k, 79760.0% for AGIs over 200k)
Taxable interest for individuals: $1,388 (reported on 43.6% of returns)
This zip code:
$1,388
North Carolina:
$1,479
(% of AGI for various income ranges: 23.1% for AGIs below $25k, 14.0% for AGIs $25k-50k, 28.0% for AGIs $50k-75k, 42.5% for AGIs $75k-100k, 140.0% for AGIs $100k-200k, 950.0% for AGIs over 200k)
Ordinary dividends: $7,285 (reported on 34.6% of returns)
Here:
$7,285
State:
$7,888
(% of AGI for various income ranges: 40.0% for AGIs below $25k, 144.0% for AGIs $25k-50k, 50.0% for AGIs $50k-75k, 227.5% for AGIs $75k-100k, 716.2% for AGIs $100k-200k, 3606.7% for AGIs over 200k)
Net capital gain/loss in AGI: +$29,719 (reported on 33.3% of returns)
Here:
+$29,719
State:
+$23,652
(% of AGI for various income ranges: 39.2% for AGIs below $25k, 48.0% for AGIs $25k-50k, 16.0% for AGIs $50k-75k, 890.0% for AGIs $75k-100k, 1273.8% for AGIs $100k-200k, 20816.7% for AGIs over 200k)
Profit/loss from business: +$29,620 (reported on 19.2% of returns)
Here:
+$29,620
State:
+$11,710
(% of AGI for various income ranges: 165.4% for AGIs below $25k, 606.0% for AGIs $25k-50k, 1420.0% for AGIs $75k-100k, 3817.5% for AGIs $100k-200k)
Taxable individual retirement arrangement distribution: $32,500 (reported on 16.7% of returns)
27927:
$32,500
North Carolina:
$20,247
(% of AGI for various income ranges: 1696.0% for AGIs $50k-75k, 2370.0% for AGIs $100k-200k, 4936.7% for AGIs over 200k)
Total itemized deductions: $35,080 (reported on 19.2% of returns)
Here:
$35,080
State:
$34,549
(% of AGI for various income ranges: 1630.0% for AGIs $50k-75k, 1873.8% for AGIs $100k-200k, 9826.7% for AGIs over 200k)
Charity contributions: $6,500 (reported on 15.4% of returns)
Here:
$6,500
State:
$13,360
(% of AGI for various income ranges: 40.0% for AGIs $25k-50k, 206.2% for AGIs $100k-200k, 1916.7% for AGIs over 200k)
Taxes paid: $7,627 (reported on 19.2% of returns)
27927:
$7,627
State:
$7,586
(% of AGI for various income ranges: 320.0% for AGIs $50k-75k, 526.2% for AGIs $100k-200k, 1876.7% for AGIs over 200k)
Earned income credit: $1,075 (reported on 5.1% of returns)
Here:
$1,075
State:
$2,337
(% of AGI for various income ranges: 33.1% for AGIs below $25k)
Percentage of individuals using paid preparers for their 2020 taxes: 93.6%
Here:
94%
State:
93%
(% for various income ranges: 95.0% for AGIs below $25k, 93.3% for AGIs $25k-50k, 87.5% for AGIs $50k-75k, 87.5% for AGIs $75k-100k, 93.8% for AGIs $100k-200k, 100.0% for AGIs over 200k)
Averages for the 2012 tax year for zip code 27927, filed in 2013:
Average Adjusted Gross Income (AGI) in 2012: $72,263 (Individual Income Tax Returns)
Here:
$72,263
State:
$54,937
Salary/wage: $43,166 (reported on 77.6% of returns)
Here:
$43,166
State:
$46,336
(% of AGI for various income ranges: 64.8% for AGIs below $25k, 64.2% for AGIs $25k-50k, 43.2% for AGIs $50k-75k, 40.2% for AGIs $75k-100k, 37.9% for AGIs $100k-200k, 47.4% for AGIs over 200k)
Taxable interest for individuals: $923 (reported on 44.9% of returns)
This zip code:
$923
North Carolina:
$1,298
(% of AGI for various income ranges: 0.7% for AGIs below $25k, 0.3% for AGIs $25k-50k, 0.4% for AGIs $50k-75k, 1.2% for AGIs $75k-100k, 0.5% for AGIs $100k-200k, 0.5% for AGIs over 200k)
Ordinary dividends: $4,424 (reported on 34.7% of returns)
Here:
$4,424
State:
$6,213
(% of AGI for various income ranges: 8.2% for AGIs below $25k, 0.6% for AGIs $25k-50k, 1.2% for AGIs $50k-75k, 2.2% for AGIs $75k-100k, 4.2% for AGIs $100k-200k)
Net capital gain/loss in AGI: +$5,893 (reported on 28.6% of returns)
Here:
+$5,893
State:
+$12,740
(% of AGI for various income ranges: 4.3% for AGIs $75k-100k, 2.8% for AGIs $100k-200k, 3.4% for AGIs over 200k)
Profit/loss from business: +$27,373 (reported on 22.4% of returns)
Here:
+$27,373
State:
+$10,311
(% of AGI for various income ranges: 14.5% for AGIs below $25k, 11.5% for AGIs $25k-50k, 19.4% for AGIs $50k-75k, 15.0% for AGIs $100k-200k)
Taxable individual retirement arrangement distribution: $25,056 (reported on 18.4% of returns)
27927:
$25,056
North Carolina:
$15,575
(% of AGI for various income ranges: 10.2% for AGIs $25k-50k, 7.8% for AGIs $75k-100k, 14.1% for AGIs $100k-200k)
Total itemized deductions: $30,445 (24% of AGI, reported on 44.9% of returns)
Here:
$30,445
State:
$23,438
Here:
24.1% of AGI
State:
21.5% of AGI
(% of AGI for various income ranges: 21.6% for AGIs $25k-50k, 19.2% for AGIs $50k-75k, 25.7% for AGIs $75k-100k, 22.6% for AGIs $100k-200k, 14.9% for AGIs over 200k)
Charity contributions: $3,316 (reported on 38.8% of returns)
Here:
$3,316
State:
$4,687
(% of AGI for various income ranges: 1.3% for AGIs $25k-50k, 1.0% for AGIs $50k-75k, 3.3% for AGIs $75k-100k, 2.5% for AGIs $100k-200k, 1.2% for AGIs over 200k)
Taxes paid: $9,914 (reported on 44.9% of returns)
27927:
$9,914
State:
$8,823
(% of AGI for various income ranges: 4.2% for AGIs $25k-50k, 6.3% for AGIs $50k-75k, 6.1% for AGIs $75k-100k, 7.4% for AGIs $100k-200k, 6.8% for AGIs over 200k)
Earned income credit: $1,060 (reported on 10.2% of returns)
Here:
$1,060
State:
$2,376
(% of AGI for various income ranges: 2.7% for AGIs below $25k)
Percentage of individuals using paid preparers for their 2012 taxes: 51.0%
Here:
51%
State:
53%
(% for various income ranges: 40.0% for AGIs below $25k, 41.7% for AGIs $25k-50k, 50.0% for AGIs $50k-75k, 60.0% for AGIs $75k-100k, 75.0% for AGIs $100k-200k, 66.7% for AGIs over 200k)
Averages for the 2004 tax year for zip code 27927, filed in 2005:
Average Adjusted Gross Income (AGI) in 2004: $69,248 (Individual Income Tax Returns)
Here:
$69,248
State:
$45,376
Salary/wage: $41,188 (reported on 73.1% of returns)
Here:
$41,188
State:
$39,442
(% of AGI for various income ranges: 166.8% for AGIs below $10k, 74.4% for AGIs $10k-25k, 66.6% for AGIs $25k-50k, 33.8% for AGIs $50k-75k, 31.5% for AGIs $75k-100k, 38.9% for AGIs over 100k)
Taxable interest for individuals: $2,368 (reported on 60.2% of returns)
This zip code:
$2,368
North Carolina:
$1,515
(% of AGI for various income ranges: 7.0% for AGIs below $10k, 2.7% for AGIs $10k-25k, 2.5% for AGIs $25k-50k, 1.8% for AGIs $50k-75k, 0.6% for AGIs $75k-100k, 2.1% for AGIs over 100k)
Taxable dividends: $3,957 (reported on 42.5% of returns)
Here:
$3,957
State:
$4,016
(% of AGI for various income ranges: 7.5% for AGIs below $10k, 1.6% for AGIs $10k-25k, 1.4% for AGIs $25k-50k, 1.9% for AGIs $50k-75k, 1.1% for AGIs $75k-100k, 2.9% for AGIs over 100k)
Net capital gain/loss: +$21,475 (reported on 36.7% of returns)
Here:
+$21,475
State:
+$11,152
(% of AGI for various income ranges: -10.6% for AGIs below $10k, 0.0% for AGIs $10k-25k, 7.7% for AGIs $25k-50k, 2.2% for AGIs $50k-75k, 0.1% for AGIs $75k-100k, 16.7% for AGIs over 100k)
Profit/loss from business: +$40,000 (reported on 25.9% of returns)
Here:
+$40,000
State:
+$9,490
(% of AGI for various income ranges: 28.6% for AGIs below $10k, 11.3% for AGIs $10k-25k, 2.9% for AGIs $25k-50k, 10.4% for AGIs $50k-75k, 20.3% for AGIs over 100k)
IRA payment deduction: $2,750 (reported on 3.2% of returns)
27927:
$2,750
North Carolina:
$2,967
Self-employed pension: $23,100 (reported on 2.6% of returns)
Here:
$23,100
North Carolina:
$14,754
Total itemized deductions: $28,659 (25% of AGI, reported on 48.8% of returns)
Here:
$28,659
State:
$19,464
Here:
25.5% of AGI
State:
22.7% of AGI
(% of AGI for various income ranges: 22.9% for AGIs $10k-25k, 21.9% for AGIs $25k-50k, 23.3% for AGIs $50k-75k, 19.4% for AGIs $75k-100k, 19.4% for AGIs over 100k)
Charity contributions deductions: $4,636 (4% of AGI, reported on 43.5% of returns)
Here:
$4,636
State:
$4,035
Here:
4.0% of AGI
State:
4.5% of AGI
(% of AGI for various income ranges: 0.8% for AGIs $10k-25k, 1.8% for AGIs $25k-50k, 2.1% for AGIs $50k-75k, 2.3% for AGIs $75k-100k, 3.6% for AGIs over 100k)
Total tax: $12,246 (reported on 86.8% of returns)
27927:
$12,246
State:
$7,257
(% of AGI for various income ranges: 8.0% for AGIs below $10k, 6.1% for AGIs $10k-25k, 7.8% for AGIs $25k-50k, 10.5% for AGIs $50k-75k, 12.0% for AGIs $75k-100k, 19.0% for AGIs over 100k)
Earned income credit: $1,056 (reported on 4.7% of returns)
Here:
$1,056
State:
$1,851
Percentage of individuals using paid preparers for their 2004 taxes: 63.3%
Here:
63%
State:
62%
(% for various income ranges: 50.8% for AGIs below $10k, 60.0% for AGIs $10k-25k, 66.2% for AGIs $25k-50k, 63.3% for AGIs $50k-75k, 48.3% for AGIs $75k-100k, 80.3% for AGIs over 100k)
Household received Food Stamps/SNAP in the past 12 months: 11 Household did not receive Food Stamps/SNAP in the past 12 months: 640
Women who had a birth in the past 12 months: 8 (0 now married, 7 unmarried) Women who did not have a birth in the past 12 months: 152 (48 now married, 104 unmarried)
Housing units in zip code 27927 with a mortgage: 358 (58 second mortgage, 61 both second mortgage and home equity loan) Median monthly owner costs for units with a mortgage: $2,912 Median monthly owner costs for units without a mortgage: $656
Residents with income below the poverty level in 2022:
This zip code:
5.5%
Whole state:
12.8%
Residents with income below 50% of the poverty level in 2022:
This zip code:
3.1%
Whole state:
6.8%
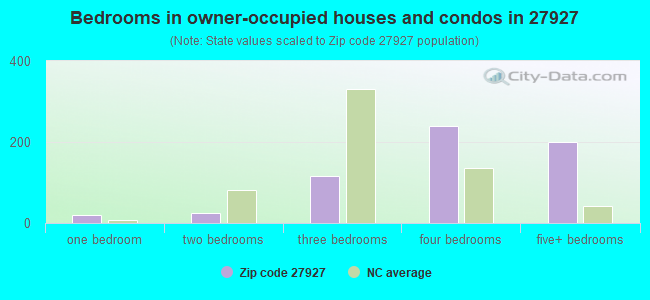
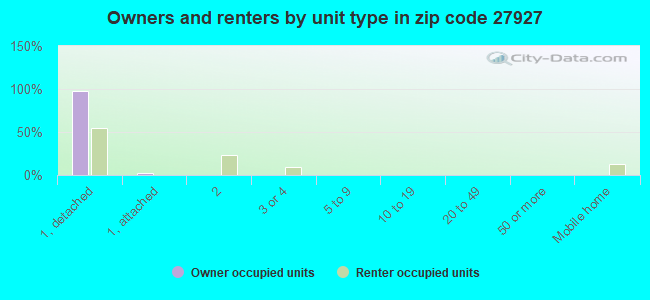
Median number of rooms in houses and condos:
Here:
6.8
State:
6.4
Median number of rooms in apartments:
Here:
4.8
State:
4.4
Notable locations in this zip code not listed on our city pages
Notable locations in zip code 27927: Pine Island Gun Club Center (A), Corolla C G Station 166 (B), Currituck Light (C), Penny Hill C G Station 167 (D), Currituck Beach Lighthouse (E), Poyner Hill C G Station (F), Monteray Plaza (G), Corolla Light Village Shops (H), Seagull (I), Currituck County Sheriff's Office (J). Display/hide their locations on the map
Lakes and swamps: Oak Pond (A), Great Beach Pond (B), Canvasback Pond (C), Long Pond (D), Northeast Pond (E), Dotty Pond (F), Mossy Pond (G), Doxeys Salthouse (H). Display/hide their locations on the map
Streams, rivers, and creeks: Ware Creek (A), Sheep Creek (B), Straight Creek (C), Beach Creek (D), Old Currituck Inlet (E). Display/hide their locations on the map
Tourist attractions (not listed on the city page) : Corolla ATV Adventure Tours (Tours & Charters; 1070 Ocean Trail) (1), Corolla A T V Tours (Tours & Charters; Winks Shp Centre) (2). Display/hide their approximate locations on the map
37 married couples with children.
20 single-parent households (13 men, 7 women).
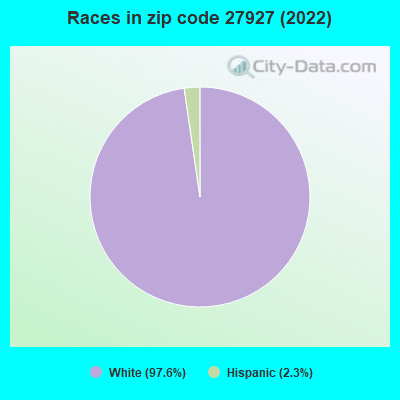
94.7% of residents of 27927 zip code speak English at home.
2.4% of residents speak Spanish at home (29% very well, 71% well).
3.8% of residents speak other Indo-European language at home (100% very well).
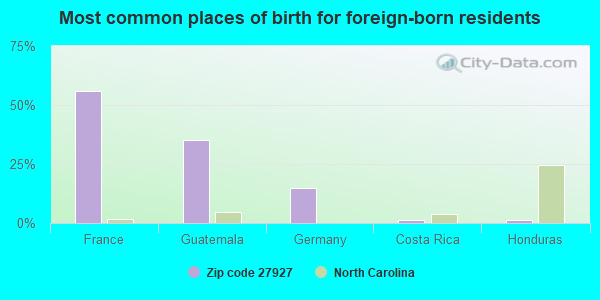
Foreign born population: 68 (5.3%) (44.9% of them are naturalized citizens)
This zip code:
5.3%
Whole state:
8.6%
56%France
35%Guatemala
15%Germany
1%Costa Rica
1%Honduras
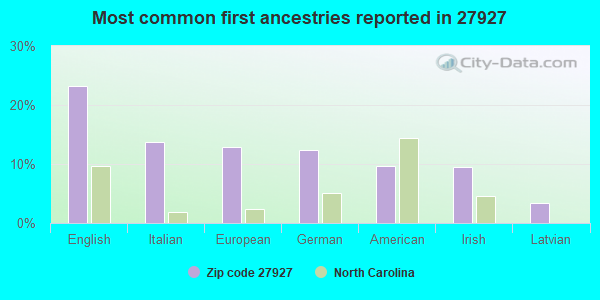
23%English
14%Italian
13%European
12%German
10%American
10%Irish
3%Latvian
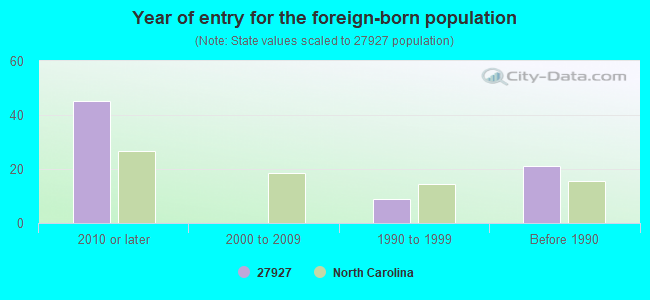
Year of entry for the foreign-born population
452010 or later
02000 to 2009
91990 to 1999
21Before 1990
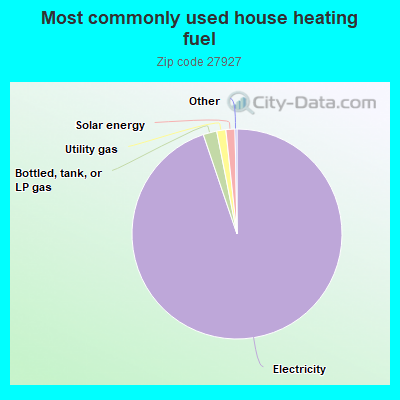
95.0%Electricity
2.1%Bottled, tank, or LP gas
1.4%Utility gas
1.4%Solar energy
Population in 1990: 288. Population change in the 1990s: +360 (+125.0%).
Place of birth for U.S.-born residents:
This state: 138
Northeast: 459
Midwest: 75
South: 560
West: 23
40% of the 27927 zip code residents lived in the same house 5 years ago. Out of people who lived in different houses, 12% lived in this county. Out of people who lived in different counties, 50% lived in North Carolina.
84% of the 27927 zip code residents lived in the same house 1 year ago. Out of people who lived in different houses, 10% moved from different county within same state. Out of people who lived in different houses, 98% moved from different state.
Private vs. public school enrollment:
Students in private schools in grades 1 to 8 (elementary and middle school):
Here:
0.0%
North Carolina:
13.8%
Students in private schools in grades 9 to 12 (high school): 24
Here:
75.3%
North Carolina:
11.9%
Students in private undergraduate colleges:
Here:
0.0%
North Carolina:
19.3%
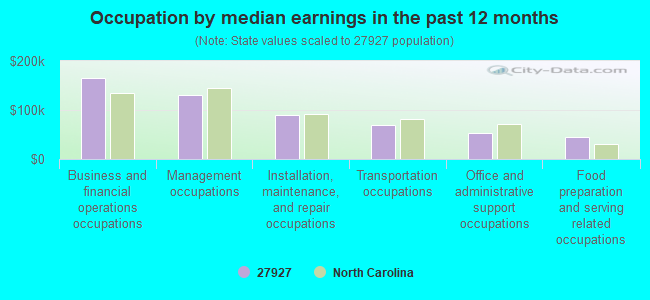
Occupation by median earnings in the past 12 months ($)
164,539Business and financial operations occupations
130,522Management occupations
90,714Installation, maintenance, and repair occupations
68,625Transportation occupations
53,595Office and administrative support occupations
45,785Food preparation and serving related occupations
Top industries in this zip code by the number of employees in 2005:
Real Estate and Rental and Leasing: Offices of Real Estate Agents and Brokers (250-499 employees: 1 establishment, 100-249 employees: 1 establishment, 50-99 employees: 1 establishment, 20-49 employees: 1 establishment, 10-19 employees: 1 establishment, 5-9 employees: 2 establishments, 1-4 employees: 7 establishments)
Real Estate and Rental and Leasing: Residential Property Managers (50-99: 1, 20-49: 1, 10-19: 1)
Accommodation and Food Services: Hotels (except Casino Hotels) and Motels (20-49: 1, 10-19: 2)
Construction: New Single-Family Housing Construction (except Operative Builders) (20-49: 1, 10-19: 1, 5-9: 1, 1-4: 2)
Other Services (except Public Administration): Other Similar Organizations (except Business, Professional, Labor, and Political Organizations) (20-49: 1, 1-4: 3)
Health Care and Social Assistance: Ambulance Services (20-49: 1)
Arts, Entertainment, and Recreation: Golf Courses and Country Clubs (20-49: 1)
Administrative and Support and Waste Management and Remediation Services: Landscaping Services (10-19: 2, 1-4: 1)
Fatal accident statistics in 2014:
Fatal accident count: 1
Vehicles involved in fatal accidents: 1
Fatal accidents caused by drunken drivers: 0
Fatalities: 1
Persons involved in fatal accidents: 1
Pedestrians involved in fatal accidents: 1
Fatal accident statistics in 2013:
Fatal accident count: 1
Vehicles involved in fatal accidents: 1
Fatal accidents caused by drunken drivers: 0
Fatalities: 2
Persons involved in fatal accidents: 2
Pedestrians involved in fatal accidents: 2
2005 - 2018 National Fire Incident Reporting System (NFIRS) incidents
According to the data from the years 2005 - 2018 the average number of fire incidents per year is 30. The highest number of reported fire incidents - 96 took place in 2015, and the least - 4 in 2010. The data has a rising trend.
When looking into fire subcategories, the most reports belonged to: Structure Fires (50.8%), and Outside Fires (36.6%).
Fire incident types reported to NFIRS in Zip Code 27927


 Nearest zip codes: 27916, 27923, 27939, 27965, 27917, 27947.


 According to the data from the years 2005 - 2018 the average number of fire incidents per year is 30. The highest number of reported fire incidents - 96 took place in 2015, and the least - 4 in 2010. The data has a rising trend.
 When looking into fire subcategories, the most reports belonged to: Structure Fires (50.8%), and Outside Fires (36.6%).