Estimated zip code population in 2022: 4,424 Zip code population in 2010: 3,449 Zip code population in 2000: 2,251
Houses and condos: 1,529 Renter-occupied apartments: 124
% of renters here:
8%
State:
33%
March 2022 cost of living index in zip code 27976: 78.3 (low, U.S. average is 100)
Land area: 106.5 sq. mi. Water area: 0.0 sq. mi.
Population density: 42 people per square mile
(very low).
OSM Map
General Map
Google Map
MSN Map
OSM Map
General Map
Google Map
MSN Map
OSM Map
General Map
Google Map
MSN Map
OSM Map
General Map
Google Map
MSN Map
Please wait while loading the map...
Real estate property taxes paid for housing units in 2022:
This zip code:
0.6% ($1,859)
North Carolina:
0.6% ($1,769)
Median real estate property taxes paid for housing units with mortgages in 2022: $1,789 (0.5%) Median real estate property taxes paid for housing units with no mortgage in 2022: $1,947 (0.7%)
Estimated median house/condo value in 2022: $323,484
27976:
$323,484
North Carolina:
$280,600
According to our research of North Carolina and other state lists, there were 5 registered sex offenders living in 27976 zip code as of May 28, 2024. The ratio of all residents to sex offenders in zip code 27976 is 722 to 1. The ratio of registered sex offenders to all residents in this zip code is lower than the state average.
Median resident age:
This zip code:
43.8 years
North Carolina median age:
39.2 years
Average household size:
This zip code:
2.9 people
North Carolina:
2.4 people
Averages for the 2020 tax year for zip code 27976, filed in 2021:
Average Adjusted Gross Income (AGI) in 2020: $68,768 (Individual Income Tax Returns)
Here:
$68,768
State:
$70,020
Salary/wage: $62,519 (reported on 85.1% of returns)
Here:
$62,519
State:
$58,387
(% of AGI for various income ranges: 1133.9% for AGIs below $25k, 3601.4% for AGIs $25k-50k, 6640.5% for AGIs $50k-75k, 9633.7% for AGIs $75k-100k, 16580.8% for AGIs $100k-200k)
Taxable interest for individuals: $734 (reported on 32.0% of returns)
This zip code:
$734
North Carolina:
$1,479
(% of AGI for various income ranges: 9.0% for AGIs below $25k, 24.5% for AGIs $25k-50k, 48.2% for AGIs $50k-75k, 54.2% for AGIs $75k-100k, 43.6% for AGIs $100k-200k)
Ordinary dividends: $1,296 (reported on 12.7% of returns)
Here:
$1,296
State:
$7,888
(% of AGI for various income ranges: 21.0% for AGIs $25k-50k, 39.1% for AGIs $50k-75k, 20.0% for AGIs $75k-100k, 45.2% for AGIs $100k-200k)
Net capital gain/loss in AGI: +$5,318 (reported on 12.2% of returns)
Here:
+$5,318
State:
+$23,652
(% of AGI for various income ranges: 2.6% for AGIs below $25k, 31.7% for AGIs $25k-50k, 54.1% for AGIs $50k-75k, 67.9% for AGIs $75k-100k, 328.8% for AGIs $100k-200k)
Profit/loss from business: +$6,518 (reported on 15.5% of returns)
Here:
+$6,518
State:
+$11,710
(% of AGI for various income ranges: 62.6% for AGIs below $25k, 46.2% for AGIs $25k-50k, 56.8% for AGIs $50k-75k, 377.9% for AGIs $75k-100k, 261.6% for AGIs $100k-200k)
Taxable individual retirement arrangement distribution: $11,818 (reported on 6.1% of returns)
27976:
$11,818
North Carolina:
$20,247
(% of AGI for various income ranges: 89.7% for AGIs $25k-50k, 201.8% for AGIs $50k-75k, 238.4% for AGIs $100k-200k)
Total itemized deductions: $26,393 (reported on 8.3% of returns)
Here:
$26,393
State:
$34,549
(% of AGI for various income ranges: 397.3% for AGIs $50k-75k, 414.7% for AGIs $75k-100k, 918.8% for AGIs $100k-200k)
Charity contributions: $6,800 (reported on 5.5% of returns)
Here:
$6,800
State:
$13,360
(% of AGI for various income ranges: 58.6% for AGIs $50k-75k, 220.4% for AGIs $100k-200k)
Taxes paid: $6,520 (reported on 8.3% of returns)
27976:
$6,520
State:
$7,586
(% of AGI for various income ranges: 21.0% for AGIs below $25k, 53.2% for AGIs $50k-75k, 86.8% for AGIs $75k-100k, 252.4% for AGIs $100k-200k)
Earned income credit: $1,995 (reported on 11.6% of returns)
Here:
$1,995
State:
$2,337
(% of AGI for various income ranges: 72.3% for AGIs below $25k, 67.2% for AGIs $25k-50k)
Percentage of individuals using paid preparers for their 2020 taxes: 93.4%
Here:
93%
State:
93%
(% for various income ranges: 90.7% for AGIs below $25k, 92.1% for AGIs $25k-50k, 93.1% for AGIs $50k-75k, 92.9% for AGIs $75k-100k, 97.4% for AGIs $100k-200k, 100.0% for AGIs over 200k)
Averages for the 2012 tax year for zip code 27976, filed in 2013:
Average Adjusted Gross Income (AGI) in 2012: $56,669 (Individual Income Tax Returns)
Here:
$56,669
State:
$54,937
Salary/wage: $50,767 (reported on 85.2% of returns)
Here:
$50,767
State:
$46,336
(% of AGI for various income ranges: 69.6% for AGIs below $25k, 75.9% for AGIs $25k-50k, 78.8% for AGIs $50k-75k, 83.2% for AGIs $75k-100k, 72.5% for AGIs $100k-200k)
Taxable interest for individuals: $481 (reported on 34.9% of returns)
This zip code:
$481
North Carolina:
$1,298
(% of AGI for various income ranges: 0.9% for AGIs below $25k, 0.5% for AGIs $25k-50k, 0.2% for AGIs $50k-75k, 0.2% for AGIs $75k-100k, 0.2% for AGIs $100k-200k)
Ordinary dividends: $1,250 (reported on 12.1% of returns)
Here:
$1,250
State:
$6,213
(% of AGI for various income ranges: 0.4% for AGIs below $25k, 0.4% for AGIs $25k-50k, 0.4% for AGIs $50k-75k, 0.2% for AGIs $100k-200k)
Net capital gain/loss in AGI: +$5,750 (reported on 6.7% of returns)
Here:
+$5,750
State:
+$12,740
(% of AGI for various income ranges: 1.8% for AGIs $100k-200k)
Profit/loss from business: +$6,770 (reported on 13.4% of returns)
Here:
+$6,770
State:
+$10,311
(% of AGI for various income ranges: 4.6% for AGIs below $25k, 1.8% for AGIs $25k-50k, 2.8% for AGIs $50k-75k, 2.1% for AGIs $75k-100k, 0.2% for AGIs $100k-200k)
Taxable individual retirement arrangement distribution: $6,130 (reported on 6.7% of returns)
27976:
$6,130
North Carolina:
$15,575
(% of AGI for various income ranges: 1.6% for AGIs below $25k, 1.9% for AGIs $25k-50k, 1.5% for AGIs $75k-100k)
Total itemized deductions: $19,718 (22% of AGI, reported on 41.6% of returns)
Here:
$19,718
State:
$23,438
Here:
22.2% of AGI
State:
21.5% of AGI
(% of AGI for various income ranges: 13.5% for AGIs below $25k, 11.2% for AGIs $25k-50k, 14.8% for AGIs $50k-75k, 16.2% for AGIs $75k-100k, 14.7% for AGIs $100k-200k)
Charity contributions: $2,545 (reported on 31.5% of returns)
Here:
$2,545
State:
$4,687
(% of AGI for various income ranges: 1.0% for AGIs below $25k, 1.1% for AGIs $25k-50k, 1.2% for AGIs $50k-75k, 1.3% for AGIs $75k-100k, 1.8% for AGIs $100k-200k)
Taxes paid: $6,123 (reported on 41.6% of returns)
27976:
$6,123
State:
$8,823
(% of AGI for various income ranges: 1.7% for AGIs below $25k, 2.2% for AGIs $25k-50k, 4.0% for AGIs $50k-75k, 5.2% for AGIs $75k-100k, 5.7% for AGIs $100k-200k)
Earned income credit: $2,126 (reported on 15.4% of returns)
Here:
$2,126
State:
$2,376
(% of AGI for various income ranges: 5.8% for AGIs below $25k, 1.3% for AGIs $25k-50k)
Percentage of individuals using paid preparers for their 2012 taxes: 49.7%
Here:
50%
State:
53%
(% for various income ranges: 45.7% for AGIs below $25k, 47.1% for AGIs $25k-50k, 52.0% for AGIs $50k-75k, 54.5% for AGIs $75k-100k, 54.5% for AGIs $100k-200k)
Averages for the 2004 tax year for zip code 27976, filed in 2005:
Average Adjusted Gross Income (AGI) in 2004: $44,091 (Individual Income Tax Returns)
Here:
$44,091
State:
$45,376
Salary/wage: $41,211 (reported on 86.8% of returns)
Here:
$41,211
State:
$39,442
(% of AGI for various income ranges: 76.3% for AGIs below $10k, 69.8% for AGIs $10k-25k, 79.3% for AGIs $25k-50k, 87.1% for AGIs $50k-75k, 86.8% for AGIs $75k-100k, 73.8% for AGIs over 100k)
Taxable interest for individuals: $843 (reported on 45.6% of returns)
This zip code:
$843
North Carolina:
$1,515
(% of AGI for various income ranges: 2.9% for AGIs below $10k, 2.2% for AGIs $10k-25k, 0.6% for AGIs $25k-50k, 0.9% for AGIs $50k-75k, 0.5% for AGIs $75k-100k, 0.9% for AGIs over 100k)
Taxable dividends: $830 (reported on 14.7% of returns)
Here:
$830
State:
$4,016
(% of AGI for various income ranges: 0.3% for AGIs below $10k, 0.1% for AGIs $10k-25k, 0.5% for AGIs $25k-50k, 0.2% for AGIs $50k-75k, 0.2% for AGIs $75k-100k, 0.2% for AGIs over 100k)
Net capital gain/loss: +$12,971 (reported on 10.9% of returns)
Here:
+$12,971
State:
+$11,152
(% of AGI for various income ranges: -0.3% for AGIs $10k-25k, 0.9% for AGIs $25k-50k, 0.2% for AGIs $50k-75k, 1.3% for AGIs $75k-100k, 14.2% for AGIs over 100k)
Profit/loss from business: +$3,653 (reported on 13.7% of returns)
Here:
+$3,653
State:
+$9,490
(% of AGI for various income ranges: 11.2% for AGIs below $10k, 2.4% for AGIs $10k-25k, 2.2% for AGIs $25k-50k, 0.8% for AGIs $50k-75k, 0.2% for AGIs $75k-100k, 0.1% for AGIs over 100k)
Profit/loss from farming: +$1,188 (reported on 1.2% of returns)
Here:
+$1,188
State:
-$3,231
IRA payment deduction: $1,882 (reported on 1.3% of returns)
27976:
$1,882
North Carolina:
$2,967
Total itemized deductions: $15,879 (23% of AGI, reported on 39.9% of returns)
Here:
$15,879
State:
$19,464
Here:
22.9% of AGI
State:
22.7% of AGI
(% of AGI for various income ranges: 8.2% for AGIs $10k-25k, 13.6% for AGIs $25k-50k, 16.1% for AGIs $50k-75k, 15.7% for AGIs $75k-100k, 15.2% for AGIs over 100k)
Charity contributions deductions: $2,837 (4% of AGI, reported on 34.5% of returns)
Here:
$2,837
State:
$4,035
Here:
4.0% of AGI
State:
4.5% of AGI
(% of AGI for various income ranges: 1.0% for AGIs $10k-25k, 2.0% for AGIs $25k-50k, 2.3% for AGIs $50k-75k, 2.1% for AGIs $75k-100k, 3.3% for AGIs over 100k)
Total tax: $4,793 (reported on 78.6% of returns)
27976:
$4,793
State:
$7,257
(% of AGI for various income ranges: 3.2% for AGIs below $10k, 4.0% for AGIs $10k-25k, 6.1% for AGIs $25k-50k, 7.7% for AGIs $50k-75k, 9.9% for AGIs $75k-100k, 13.5% for AGIs over 100k)
Earned income credit: $1,621 (reported on 13.2% of returns)
Here:
$1,621
State:
$1,851
Percentage of individuals using paid preparers for their 2004 taxes: 59.4%
Here:
59%
State:
62%
(% for various income ranges: 49.7% for AGIs below $10k, 59.5% for AGIs $10k-25k, 60.1% for AGIs $25k-50k, 59.0% for AGIs $50k-75k, 60.4% for AGIs $75k-100k, 77.1% for AGIs over 100k)
Household received Food Stamps/SNAP in the past 12 months: 56 Household did not receive Food Stamps/SNAP in the past 12 months: 1,456
Women who had a birth in the past 12 months: 65 (36 now married, 28 unmarried) Women who did not have a birth in the past 12 months: 743 (543 now married, 204 unmarried)
Housing units in zip code 27976 with a mortgage: 1,054 (38 second mortgage, 40 both second mortgage and home equity loan) Median monthly owner costs for units with a mortgage: $1,753 Median monthly owner costs for units without a mortgage: $540
Residents with income below the poverty level in 2022:
This zip code:
8.5%
Whole state:
12.8%
Residents with income below 50% of the poverty level in 2022:
This zip code:
8.5%
Whole state:
6.8%
Median number of rooms in houses and condos:
Here:
7.7
State:
6.4
Median number of rooms in apartments:
Here:
5.2
State:
4.4
Notable locations in this zip code not listed on our city pages
Churches in zip code 27976 include: Trinity Church (A), Ebenezer Church (B), McBride Church (C), Antioch Church (D), Oak Grove Church (E). Display/hide their locations on the map
Size of family households: 536 2-persons, 294 3-persons, 206 4-persons, 258 5-persons, 10 6-persons
Size of nonfamily households: 180 1-person, 37 2-persons
838 married couples with children.
39 single-parent households (39 women).
96.0% of residents of 27976 zip code speak English at home.
0.4% of residents speak Spanish at home (100% very well).
1.7% of residents speak other Indo-European language at home (32% very well, 68% well).
1.7% of residents speak other language at home (61% very well, 39% not at all).
Foreign born population: 71 (1.6%) (100.0% of them are naturalized citizens)
This zip code:
1.6%
Whole state:
8.6%
84%Nepal
20%American
18%English
13%Irish
13%Italian
3%German
2%Czechoslovakian
1%Norwegian
Year of entry for the foreign-born population
02010 or later
02000 to 2009
401990 to 1999
72Before 1990
Facilities with environmental interests located in this zip code:
ALBERTSON FARM (204 OLD SWAMP RD in SOUTH MILLS, NC)
National Pollutant Discharge Elimination System NON-MAJOR (Tracking pollutant discharge elimination systems) - permit Alternative names: MAXWELL FOODS INC ALBERTSON FA
CAMDEN YARD MATERIALS (PONDEROSA DR in SOUTH MILLS, NC)
National Pollutant Discharge Elimination System NON-MAJOR (Tracking pollutant discharge elimination systems) - permit
80.7%Electricity
15.1%Bottled, tank, or LP gas
3.4%Utility gas
1.0%Fuel oil, kerosene, etc.
Population in 1990: 2,087. Population change in the 1990s: +164 (+7.9%).
Place of birth for U.S.-born residents:
This state: 1,627
Northeast: 498
Midwest: 477
South: 1,446
West: 283
50% of the 27976 zip code residents lived in the same house 5 years ago. Out of people who lived in different houses, 31% lived in this county. Out of people who lived in different counties, 50% lived in North Carolina.
99% of the 27976 zip code residents lived in the same house 1 year ago. Out of people who lived in different houses, 100% moved from this county. Out of people who lived in different houses, 29% moved from different county within same state. Out of people who lived in different houses, 100% moved from different state.
Private vs. public school enrollment:
Students in private schools in grades 1 to 8 (elementary and middle school): 15
Here:
3.3%
North Carolina:
13.8%
Students in private schools in grades 9 to 12 (high school):
Here:
0.0%
North Carolina:
11.9%
Students in private undergraduate colleges: 46
Here:
28.8%
North Carolina:
19.3%
Occupation by median earnings in the past 12 months ($)
125,841Health diagnosing and treating practitioners and other technical occupations
79,643Construction and extraction occupations
56,159Management occupations
54,105Transportation occupations
47,804Installation, maintenance, and repair occupations
42,179Production occupations
Top industries in this zip code by the number of employees in 2005:
Utilities: Water Supply and Irrigation Systems (10-19 employees: 1 establishment)
Construction: New Single-Family Housing Construction (except Operative Builders) (1-4: 4)
Other Services (except Public Administration): Religious Organizations (1-4: 4)
Construction: Electrical Contractors (5-9: 1)
Administrative and Support and Waste Management and Remediation Services: Landscaping Services (1-4: 3)
Other Services (except Public Administration): Reupholstery and Furniture Repair (1-4: 1)
Fatal accident statistics in 2014:
Fatal accident count: 1
Vehicles involved in fatal accidents: 2
Fatal accidents caused by drunken drivers: 0
Fatalities: 2
Persons involved in fatal accidents: 3
Pedestrians involved in fatal accidents: 0
2002 - 2018 National Fire Incident Reporting System (NFIRS) incidents
According to the data from the years 2002 - 2018 the average number of fire incidents per year is 17. The highest number of fire incidents - 50 took place in 2010, and the least - 0 in 2015. The data has an increasing trend.
When looking into fire subcategories, the most reports belonged to: Outside Fires (46.9%), and Structure Fires (34.6%).
Fire incident types reported to NFIRS in Zip Code 27976


+$1,188
-$3,231
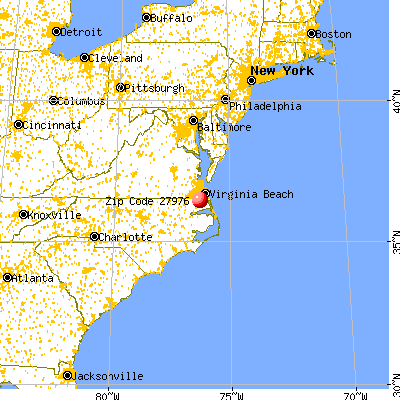
 Nearest zip codes: 23322, 23323, 27921, 27958, 27909, 27979.


 According to the data from the years 2002 - 2018 the average number of fire incidents per year is 17. The highest number of fire incidents - 50 took place in 2010, and the least - 0 in 2015. The data has an increasing trend.
 When looking into fire subcategories, the most reports belonged to: Outside Fires (46.9%), and Structure Fires (34.6%).