Estimated zip code population in 2022: 5,535 Zip code population in 2010: 6,123 Zip code population in 2000: 4,151
Houses and condos: 1,571 Renter-occupied apartments: 494
% of renters here:
34%
State:
33%
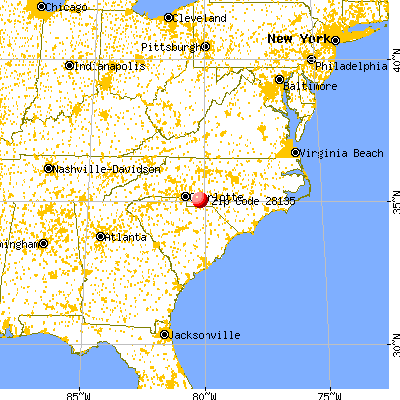
March 2022 cost of living index in zip code 28135: 80.6 (low, U.S. average is 100)
Land area: 100.1 sq. mi. Water area: 0.1 sq. mi.
Population density: 55 people per square mile
(very low).
OSM Map
General Map
Google Map
MSN Map
OSM Map
General Map
Google Map
MSN Map
OSM Map
General Map
Google Map
MSN Map
OSM Map
General Map
Google Map
MSN Map
Please wait while loading the map...
Real estate property taxes paid for housing units in 2022:
This zip code:
0.7% ($1,295)
North Carolina:
0.6% ($1,769)
Median real estate property taxes paid for housing units with mortgages in 2022: $1,599 (0.5%) Median real estate property taxes paid for housing units with no mortgage in 2022: $1,075 (0.7%)
Business Search- 14 Million verified businesses
Males: 2,985
(53.9%)
Females: 2,548
(46.1%)
For population 25 years and over in 28135:
High school or higher: 81.4%
Bachelor's degree or higher: 10.6%
Graduate or professional degree: 2.8%
Unemployed: 0.9%
Mean travel time to work (commute): 28.3 minutes
For population 15 years and over in 28135:
Never married: 42.3%
Now married: 38.6%
Separated: 1.5%
Widowed: 6.5%
Divorced: 11.2%
Zip code 28135 compared to state average:
Median house value below state average.
Unemployed percentage significantly below state average.
Black race population percentage above state average.
Foreign-born population percentage significantly below state average.
Length of stay since moving in significantly above state average.
Number of college students below state average.
Percentage of population with a bachelor's degree or higher significantly below state average.
Estimated median house/condo value in 2022: $184,319
28135:
$184,319
North Carolina:
$280,600
According to our research of North Carolina and other state lists, there were 9 registered sex offenders living in 28135 zip code as of May 28, 2024. The ratio of all residents to sex offenders in zip code 28135 is 705 to 1. The ratio of registered sex offenders to all residents in this zip code is lower than the state average.
Median resident age:
This zip code:
38.7 years
North Carolina median age:
39.2 years
Average household size:
This zip code:
2.6 people
North Carolina:
2.4 people
Averages for the 2020 tax year for zip code 28135, filed in 2021:
Average Adjusted Gross Income (AGI) in 2020: $44,089 (Individual Income Tax Returns)
Here:
$44,089
State:
$70,020
Salary/wage: $37,657 (reported on 84.3% of returns)
Here:
$37,657
State:
$58,387
(% of AGI for various income ranges: 1426.2% for AGIs below $25k, 3863.2% for AGIs $25k-50k, 7689.2% for AGIs $50k-75k, 10784.3% for AGIs $75k-100k, 16381.4% for AGIs $100k-200k)
Taxable interest for individuals: $646 (reported on 22.7% of returns)
This zip code:
$646
North Carolina:
$1,479
(% of AGI for various income ranges: 8.2% for AGIs below $25k, 12.4% for AGIs $25k-50k, 23.3% for AGIs $50k-75k, 21.4% for AGIs $75k-100k, 172.9% for AGIs $100k-200k)
Ordinary dividends: $3,136 (reported on 8.1% of returns)
Here:
$3,136
State:
$7,888
(% of AGI for various income ranges: 15.2% for AGIs below $25k, 7.9% for AGIs $25k-50k, 28.3% for AGIs $50k-75k, 427.1% for AGIs $100k-200k)
Net capital gain/loss in AGI: +$7,027 (reported on 6.4% of returns)
Here:
+$7,027
State:
+$23,652
(% of AGI for various income ranges: 27.4% for AGIs below $25k, 37.5% for AGIs $50k-75k, 844.3% for AGIs $100k-200k)
Profit/loss from business: +$11,958 (reported on 14.0% of returns)
Here:
+$11,958
State:
+$11,710
(% of AGI for various income ranges: 60.4% for AGIs below $25k, 146.8% for AGIs $25k-50k, 360.8% for AGIs $50k-75k, 2252.9% for AGIs $100k-200k)
Taxable individual retirement arrangement distribution: $15,127 (reported on 6.4% of returns)
28135:
$15,127
North Carolina:
$20,247
(% of AGI for various income ranges: 45.8% for AGIs below $25k, 164.7% for AGIs $25k-50k, 1155.7% for AGIs $75k-100k)
Total itemized deductions: $28,657 (reported on 4.1% of returns)
Here:
$28,657
State:
$34,549
(% of AGI for various income ranges: 181.8% for AGIs $25k-50k, 1878.6% for AGIs $100k-200k)
Charity contributions: $13,783 (reported on 3.5% of returns)
Here:
$13,783
State:
$13,360
(% of AGI for various income ranges: 54.7% for AGIs $25k-50k, 884.3% for AGIs $100k-200k)
Taxes paid: $6,471 (reported on 4.1% of returns)
28135:
$6,471
State:
$7,586
(% of AGI for various income ranges: 35.5% for AGIs $25k-50k, 454.3% for AGIs $100k-200k)
Earned income credit: $2,400 (reported on 26.2% of returns)
Here:
$2,400
State:
$2,337
(% of AGI for various income ranges: 133.6% for AGIs below $25k, 108.4% for AGIs $25k-50k)
Percentage of individuals using paid preparers for their 2020 taxes: 89.0%
Here:
89%
State:
93%
(% for various income ranges: 82.1% for AGIs below $25k, 93.9% for AGIs $25k-50k, 94.7% for AGIs $50k-75k, 100.0% for AGIs $75k-100k, 91.7% for AGIs $100k-200k, 100.0% for AGIs over 200k)
Averages for the 2012 tax year for zip code 28135, filed in 2013:
Average Adjusted Gross Income (AGI) in 2012: $36,201 (Individual Income Tax Returns)
Here:
$36,201
State:
$54,937
Salary/wage: $32,132 (reported on 85.1% of returns)
Here:
$32,132
State:
$46,336
(% of AGI for various income ranges: 74.7% for AGIs below $25k, 80.8% for AGIs $25k-50k, 80.0% for AGIs $50k-75k, 73.8% for AGIs $75k-100k, 64.7% for AGIs $100k-200k)
Taxable interest for individuals: $618 (reported on 27.0% of returns)
This zip code:
$618
North Carolina:
$1,298
(% of AGI for various income ranges: 0.9% for AGIs below $25k, 0.4% for AGIs $25k-50k, 0.3% for AGIs $50k-75k, 0.4% for AGIs $75k-100k, 0.5% for AGIs $100k-200k)
Ordinary dividends: $1,473 (reported on 7.8% of returns)
Here:
$1,473
State:
$6,213
(% of AGI for various income ranges: 0.4% for AGIs $25k-50k, 0.3% for AGIs $50k-75k, 1.0% for AGIs $75k-100k)
Net capital gain/loss in AGI: +$2,422 (reported on 6.4% of returns)
Here:
+$2,422
State:
+$12,740
(% of AGI for various income ranges: 0.2% for AGIs $50k-75k, 3.3% for AGIs $75k-100k)
Profit/loss from business: +$6,383 (reported on 16.3% of returns)
Here:
+$6,383
State:
+$10,311
(% of AGI for various income ranges: 8.1% for AGIs below $25k, 2.6% for AGIs $25k-50k, 1.6% for AGIs $50k-75k, 3.4% for AGIs $75k-100k)
Taxable individual retirement arrangement distribution: $8,700 (reported on 8.5% of returns)
28135:
$8,700
North Carolina:
$15,575
(% of AGI for various income ranges: 2.6% for AGIs below $25k, 2.0% for AGIs $25k-50k, 4.3% for AGIs $50k-75k)
Total itemized deductions: $16,821 (25% of AGI, reported on 24.1% of returns)
Here:
$16,821
State:
$23,438
Here:
25.4% of AGI
State:
21.5% of AGI
(% of AGI for various income ranges: 6.2% for AGIs below $25k, 8.8% for AGIs $25k-50k, 13.4% for AGIs $50k-75k, 14.5% for AGIs $75k-100k, 13.7% for AGIs $100k-200k)
Charity contributions: $3,945 (reported on 22.0% of returns)
Here:
$3,945
State:
$4,687
(% of AGI for various income ranges: 1.3% for AGIs below $25k, 2.0% for AGIs $25k-50k, 2.5% for AGIs $50k-75k, 3.0% for AGIs $75k-100k, 3.3% for AGIs $100k-200k)
Taxes paid: $5,191 (reported on 23.4% of returns)
28135:
$5,191
State:
$8,823
(% of AGI for various income ranges: 0.9% for AGIs below $25k, 1.8% for AGIs $25k-50k, 3.7% for AGIs $50k-75k, 5.5% for AGIs $75k-100k, 5.7% for AGIs $100k-200k)
Earned income credit: $2,696 (reported on 33.3% of returns)
Here:
$2,696
State:
$2,376
(% of AGI for various income ranges: 11.8% for AGIs below $25k, 1.9% for AGIs $25k-50k)
Percentage of individuals using paid preparers for their 2012 taxes: 72.3%
Here:
72%
State:
53%
(% for various income ranges: 72.1% for AGIs below $25k, 71.1% for AGIs $25k-50k, 75.0% for AGIs $50k-75k, 75.0% for AGIs $75k-100k, 71.4% for AGIs $100k-200k)
Averages for the 2004 tax year for zip code 28135, filed in 2005:
Average Adjusted Gross Income (AGI) in 2004: $31,593 (Individual Income Tax Returns)
Here:
$31,593
State:
$45,376
Salary/wage: $29,650 (reported on 88.1% of returns)
Here:
$29,650
State:
$39,442
(% of AGI for various income ranges: 84.7% for AGIs below $10k, 84.7% for AGIs $10k-25k, 86.9% for AGIs $25k-50k, 86.6% for AGIs $50k-75k, 78.1% for AGIs $75k-100k, 64.8% for AGIs over 100k)
Taxable interest for individuals: $915 (reported on 34.2% of returns)
This zip code:
$915
North Carolina:
$1,515
(% of AGI for various income ranges: 3.1% for AGIs below $10k, 1.1% for AGIs $10k-25k, 1.1% for AGIs $25k-50k, 0.9% for AGIs $50k-75k, 0.4% for AGIs $75k-100k, 0.8% for AGIs over 100k)
Taxable dividends: $926 (reported on 10.1% of returns)
Here:
$926
State:
$4,016
(% of AGI for various income ranges: 0.3% for AGIs below $10k, 0.2% for AGIs $10k-25k, 0.4% for AGIs $25k-50k, 0.2% for AGIs $50k-75k, 0.1% for AGIs $75k-100k, 0.6% for AGIs over 100k)
Net capital gain/loss: +$3,195 (reported on 8.8% of returns)
Here:
+$3,195
State:
+$11,152
(% of AGI for various income ranges: 0.2% for AGIs below $10k, 0.7% for AGIs $10k-25k, 0.5% for AGIs $25k-50k, 0.5% for AGIs $50k-75k, 1.5% for AGIs $75k-100k, 2.5% for AGIs over 100k)
Profit/loss from business: +$6,665 (reported on 12.9% of returns)
Here:
+$6,665
State:
+$9,490
(% of AGI for various income ranges: 12.9% for AGIs below $10k, 4.2% for AGIs $10k-25k, 1.8% for AGIs $25k-50k, 1.8% for AGIs $50k-75k, 4.9% for AGIs $75k-100k)
Profit/loss from farming: +$1,355 (reported on 5.7% of returns)
Here:
+$1,355
State:
-$3,231
(% of AGI for various income ranges: -1.2% for AGIs below $10k, 0.3% for AGIs $10k-25k, 0.7% for AGIs $25k-50k, 0.4% for AGIs $50k-75k, -0.8% for AGIs $75k-100k)
IRA payment deduction: $3,022 (reported on 3.4% of returns)
28135:
$3,022
North Carolina:
$2,967
Total itemized deductions: $14,532 (25% of AGI, reported on 25.7% of returns)
Here:
$14,532
State:
$19,464
Here:
25.4% of AGI
State:
22.7% of AGI
(% of AGI for various income ranges: 9.3% for AGIs below $10k, 5.6% for AGIs $10k-25k, 11.0% for AGIs $25k-50k, 14.3% for AGIs $50k-75k, 14.2% for AGIs $75k-100k, 16.0% for AGIs over 100k)
Charity contributions deductions: $3,817 (7% of AGI, reported on 22.4% of returns)
Here:
$3,817
State:
$4,035
Here:
6.5% of AGI
State:
4.5% of AGI
(% of AGI for various income ranges: 1.2% for AGIs below $10k, 1.4% for AGIs $10k-25k, 2.3% for AGIs $25k-50k, 3.0% for AGIs $50k-75k, 3.7% for AGIs $75k-100k, 4.4% for AGIs over 100k)
Total tax: $3,680 (reported on 64.1% of returns)
28135:
$3,680
State:
$7,257
(% of AGI for various income ranges: 2.8% for AGIs below $10k, 3.0% for AGIs $10k-25k, 5.8% for AGIs $25k-50k, 8.2% for AGIs $50k-75k, 10.7% for AGIs $75k-100k, 14.8% for AGIs over 100k)
Earned income credit: $1,983 (reported on 30.5% of returns)
Here:
$1,983
State:
$1,851
Percentage of individuals using paid preparers for their 2004 taxes: 80.8%
Here:
81%
State:
62%
(% for various income ranges: 77.4% for AGIs below $10k, 85.9% for AGIs $10k-25k, 79.5% for AGIs $25k-50k, 76.1% for AGIs $50k-75k, 86.9% for AGIs $75k-100k, 75.0% for AGIs over 100k)
Household received Food Stamps/SNAP in the past 12 months: 383 Household did not receive Food Stamps/SNAP in the past 12 months: 1,087
Women who had a birth in the past 12 months: 4 (0 now married, 3 unmarried) Women who did not have a birth in the past 12 months: 1,354 (365 now married, 984 unmarried)
Housing units in zip code 28135 with a mortgage: 373 (7 second mortgage, 7 both second mortgage and home equity loan) Houses without a mortgage: 6
Median monthly owner costs for units with a mortgage: $1,327 Median monthly owner costs for units without a mortgage: $436
Residents with income below the poverty level in 2022:
This zip code:
18.7%
Whole state:
12.8%
Residents with income below 50% of the poverty level in 2022:
This zip code:
11.1%
Whole state:
6.8%
Median number of rooms in houses and condos:
Here:
5.9
State:
6.4
Median number of rooms in apartments:
Here:
5.0
State:
4.4
Notable locations in this zip code not listed on our city pages
Churches in zip code 28135 include: Unity Chapel (A), West Rocky Ford Church (B), Mineral Springs Church (C), Wightman Church (D), New Grove Church (E), Cedar Grove Church (F), Oak Dale Church (G), Poplar Hill Church (H), Poplar Spring Church (I). Display/hide their locations on the map
Streams, rivers, and creeks: Flag Branch (A), Deep Bottom Branch (B), Cribs Creek (C), Cranes Branch (D), Canebreak Branch (E), Swans Branch (F), Rocky Branch (G), Richardson Creek (H), Pine Log Creek (I). Display/hide their locations on the map
In group quarters: 1,704 (-1 institutionalized population)
Size of family households: 471 2-persons, 242 3-persons, 152 4-persons, 112 5-persons, 9 7-or-more-persons
Size of nonfamily households: 366 1-person, 69 2-persons, 26 3-persons
385 married couples with children.
219 single-parent households (219 women).
91.4% of residents of 28135 zip code speak English at home.
8.0% of residents speak Spanish at home (76% very well, 23% well).
0.2% of residents speak other Indo-European language at home (100% very well).
Foreign born population: 183 (3.3%) (28.8% of them are naturalized citizens)
This zip code:
3.3%
Whole state:
8.6%
58%Honduras
12%Guatemala
8%Romania
5%Nicaragua
4%France
1%Malaysia
11%English
7%American
4%African
3%Scotch-Irish
3%European
3%German
2%Welsh
Year of entry for the foreign-born population
32010 or later
892000 to 2009
551990 to 1999
24Before 1990
Facilities with environmental interests located in this zip code:
ANSON CO-WASTE MGMT FACILITY (RT #1 BOX 235 in POLKTON, NC)
National Pollutant Discharge Elimination System NON-MAJOR (Tracking pollutant discharge elimination systems) - permit Business SIC classification: REFUSE SYSTEMS
ANSON COMMUNITY COLLEGE (HWY 74 in POLKTON, NC)
Conditionally Exempt Small Quantity Generators, less than 100 kg/month of hazardous waste (Resource Conservation and Recovery Act (tracking hazardous waste)) Organizations: COMMUNITY COLLEGE SYSTEM (CONTACT/OWNER)
Housing units lacking complete plumbing facilities: 1.4% Housing units lacking complete kitchen facilities: 1.6%
57.5%Electricity
33.7%Bottled, tank, or LP gas
3.8%Wood
3.1%Fuel oil, kerosene, etc.
1.8%Utility gas
Population in 1990: 6,679.
Place of birth for U.S.-born residents:
This state: 4,354
Northeast: 308
Midwest: 95
South: 400
West: 117
68% of the 28135 zip code residents lived in the same house 5 years ago. Out of people who lived in different houses, 25% lived in this county. Out of people who lived in different counties, 50% lived in North Carolina.
82% of the 28135 zip code residents lived in the same house 1 year ago. Out of people who lived in different houses, 9% moved from this county. Out of people who lived in different houses, 91% moved from different county within same state. Out of people who lived in different houses, 2% moved from different state.
Private vs. public school enrollment:
Students in private schools in grades 1 to 8 (elementary and middle school): 15
Here:
4.4%
North Carolina:
13.8%
Students in private schools in grades 9 to 12 (high school): 32
Here:
18.9%
North Carolina:
11.9%
Students in private undergraduate colleges: 62
Here:
46.5%
North Carolina:
19.3%
Occupation by median earnings in the past 12 months ($)
78,259Health diagnosing and treating practitioners and other technical occupations
46,912Office and administrative support occupations
44,012Education, training, and library occupations
38,978Installation, maintenance, and repair occupations
32,691Healthcare support occupations
31,222Management occupations
Top industries in this zip code by the number of employees in 2005:
Wholesale Trade: Recyclable Material Merchant Wholesalers (20-49 employees: 1 establishment)
Construction: Highway, Street, and Bridge Construction (10-19: 2)
Administrative and Support and Waste Management and Remediation Services: Solid Waste Landfill (10-19: 1)
Professional, Scientific, and Technical Services: Veterinary Services (10-19: 1)
People in group quarters in 2010:
2,190 people in state prisons
People in group quarters in 2000:
1,127 people in state prisons
Fatal accident statistics in 2011:
Fatal accident count: 1
Vehicles involved in fatal accidents: 2
Fatal accidents caused by drunken drivers: 0
Fatalities: 1
Persons involved in fatal accidents: 3
Pedestrians involved in fatal accidents: 0
Fatal accident statistics in 2010:
Fatal accident count: 1
Vehicles involved in fatal accidents: 2
Fatal accidents caused by drunken drivers: 0
Fatalities: 1
Persons involved in fatal accidents: 3
Pedestrians involved in fatal accidents: 0
2005 - 2018 National Fire Incident Reporting System (NFIRS) incidents
Based on the data from the years 2005 - 2018 the average number of fire incidents per year is 13. The highest number of fire incidents - 38 took place in 2007, and the least - 3 in 2017. The data has a rising trend.
When looking into fire subcategories, the most reports belonged to: Structure Fires (49.5%), and Outside Fires (23.9%).
Fire incident types reported to NFIRS in Zip Code 28135


+$1,355
-$3,231
(% of AGI for various income ranges: -1.2% for AGIs below $10k, 0.3% for AGIs $10k-25k, 0.7% for AGIs $25k-50k, 0.4% for AGIs $50k-75k, -0.8% for AGIs $75k-100k) Nearest zip codes: 28170, 28007, 28103, 28133, 28128, 28129.


 Based on the data from the years 2005 - 2018 the average number of fire incidents per year is 13. The highest number of fire incidents - 38 took place in 2007, and the least - 3 in 2017. The data has a rising trend.
 When looking into fire subcategories, the most reports belonged to: Structure Fires (49.5%), and Outside Fires (23.9%).