Estimated zip code population in 2022: 10,203 Zip code population in 2010: 11,830 Zip code population in 2000: 11,543
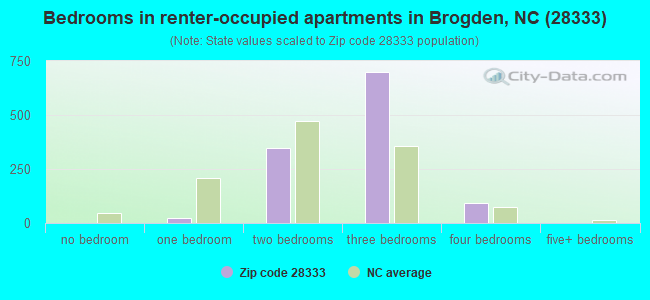
Houses and condos: 4,323 Renter-occupied apartments: 1,168
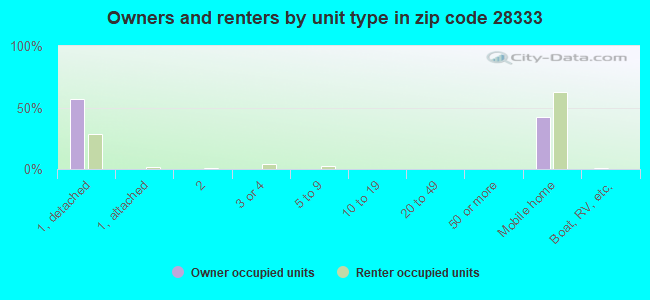
% of renters here:
31%
State:
33%
March 2022 cost of living index in zip code 28333: 79.9 (low, U.S. average is 100)
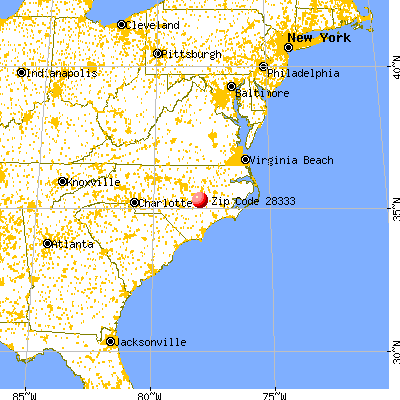
Land area: 47.2 sq. mi. Water area: 0.4 sq. mi.
Population density: 216 people per square mile
(very low).
OSM Map
General Map
Google Map
MSN Map
OSM Map
General Map
Google Map
MSN Map
OSM Map
General Map
Google Map
MSN Map
OSM Map
General Map
Google Map
MSN Map
Please wait while loading the map...
Real estate property taxes paid for housing units in 2022:
This zip code:
0.7% ($730)
North Carolina:
0.6% ($1,769)
Median real estate property taxes paid for housing units with mortgages in 2022: $909 (0.7%) Median real estate property taxes paid for housing units with no mortgage in 2022: $550 (0.5%)
Business Search- 14 Million verified businesses
Males: 4,912
(48.1%)
Females: 5,291
(51.9%)
For population 25 years and over in 28333:
High school or higher: 72.7%
Bachelor's degree or higher: 8.9%
Graduate or professional degree: 1.1%
Unemployed: 3.8%
Mean travel time to work (commute): 23.5 minutes
For population 15 years and over in 28333:
Never married: 35.4%
Now married: 42.1%
Separated: 4.9%
Widowed: 8.2%
Divorced: 9.4%
Zip code 28333 compared to state average:
Median household income below state average.
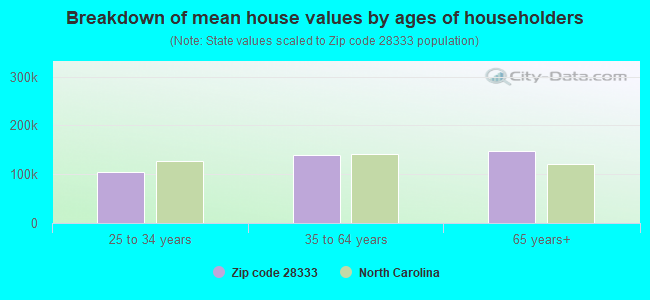
Median house value significantly below state average.
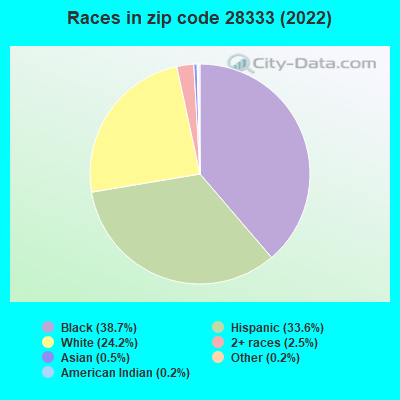
Black race population percentage above state average.
Hispanic race population percentage significantly above state average.
Median age below state average.
Foreign-born population percentage above state average.
Length of stay since moving in significantly above state average.
Percentage of population with a bachelor's degree or higher significantly below state average.
Estimated median house/condo value in 2022: $111,929
28333:
$111,929
North Carolina:
$280,600
According to our research of North Carolina and other state lists, there were 24 registered sex offenders living in 28333 zip code as of May 28, 2024. The ratio of all residents to sex offenders in zip code 28333 is 441 to 1. The ratio of registered sex offenders to all residents in this zip code is near the state average.
Median resident age:
This zip code:
32.6 years
North Carolina median age:
39.2 years
Average household size:
This zip code:
2.7 people
North Carolina:
2.4 people
Averages for the 2020 tax year for zip code 28333, filed in 2021:
Average Adjusted Gross Income (AGI) in 2020: $37,025 (Individual Income Tax Returns)
Here:
$37,025
State:
$70,020
Salary/wage: $32,968 (reported on 84.8% of returns)
Here:
$32,968
State:
$58,387
(% of AGI for various income ranges: 1300.6% for AGIs below $25k, 3973.3% for AGIs $25k-50k, 7411.8% for AGIs $50k-75k, 10647.1% for AGIs $75k-100k, 19348.0% for AGIs $100k-200k)
Taxable interest for individuals: $530 (reported on 12.9% of returns)
This zip code:
$530
North Carolina:
$1,479
(% of AGI for various income ranges: 3.5% for AGIs below $25k, 4.3% for AGIs $25k-50k, 16.9% for AGIs $50k-75k, 40.0% for AGIs $75k-100k, 99.0% for AGIs $100k-200k)
Ordinary dividends: $3,072 (reported on 3.7% of returns)
Here:
$3,072
State:
$7,888
(% of AGI for various income ranges: 3.7% for AGIs below $25k, 7.0% for AGIs $25k-50k, 10.3% for AGIs $50k-75k, 362.0% for AGIs $100k-200k)
Net capital gain/loss in AGI: +$9,576 (reported on 3.5% of returns)
Here:
+$9,576
State:
+$23,652
(% of AGI for various income ranges: 1.9% for AGIs below $25k, 5.3% for AGIs $25k-50k, 55.1% for AGIs $50k-75k, 1313.0% for AGIs $100k-200k)
Profit/loss from business: +$6,777 (reported on 12.5% of returns)
Here:
+$6,777
State:
+$11,710
(% of AGI for various income ranges: 149.5% for AGIs below $25k, 62.7% for AGIs $25k-50k, 143.3% for AGIs $50k-75k, 82.1% for AGIs $75k-100k, 270.0% for AGIs $100k-200k)
Taxable individual retirement arrangement distribution: $10,247 (reported on 3.9% of returns)
28333:
$10,247
North Carolina:
$20,247
(% of AGI for various income ranges: 17.4% for AGIs below $25k, 38.3% for AGIs $25k-50k, 149.5% for AGIs $50k-75k, 583.0% for AGIs $100k-200k)
Total itemized deductions: $24,300 (reported on 2.1% of returns)
Here:
$24,300
State:
$34,549
(% of AGI for various income ranges: 65.7% for AGIs $25k-50k, 195.6% for AGIs $50k-75k, 800.0% for AGIs $100k-200k)
Charity contributions: $9,500 (reported on 1.6% of returns)
Here:
$9,500
State:
$13,360
(% of AGI for various income ranges: 16.6% for AGIs $25k-50k, 69.7% for AGIs $50k-75k, 269.0% for AGIs $100k-200k)
Taxes paid: $4,400 (reported on 2.1% of returns)
28333:
$4,400
State:
$7,586
(% of AGI for various income ranges: 6.8% for AGIs $25k-50k, 33.8% for AGIs $50k-75k, 218.0% for AGIs $100k-200k)
Earned income credit: $2,635 (reported on 29.2% of returns)
Here:
$2,635
State:
$2,337
(% of AGI for various income ranges: 156.1% for AGIs below $25k, 96.7% for AGIs $25k-50k)
Percentage of individuals using paid preparers for their 2020 taxes: 88.5%
Here:
89%
State:
93%
(% for various income ranges: 87.6% for AGIs below $25k, 89.0% for AGIs $25k-50k, 87.9% for AGIs $50k-75k, 87.0% for AGIs $75k-100k, 104.8% for AGIs $100k-200k, 0.0% for AGIs over 200k)
Averages for the 2012 tax year for zip code 28333, filed in 2013:
Average Adjusted Gross Income (AGI) in 2012: $30,662 (Individual Income Tax Returns)
Here:
$30,662
State:
$54,937
Salary/wage: $27,606 (reported on 88.1% of returns)
Here:
$27,606
State:
$46,336
(% of AGI for various income ranges: 81.0% for AGIs below $25k, 86.4% for AGIs $25k-50k, 80.5% for AGIs $50k-75k, 74.2% for AGIs $75k-100k, 51.3% for AGIs $100k-200k)
Taxable interest for individuals: $724 (reported on 14.6% of returns)
This zip code:
$724
North Carolina:
$1,298
(% of AGI for various income ranges: 0.3% for AGIs below $25k, 0.3% for AGIs $25k-50k, 0.3% for AGIs $50k-75k, 0.3% for AGIs $75k-100k, 0.8% for AGIs $100k-200k)
Ordinary dividends: $1,663 (reported on 4.0% of returns)
Here:
$1,663
State:
$6,213
(% of AGI for various income ranges: 0.2% for AGIs below $25k, 0.2% for AGIs $50k-75k, 0.2% for AGIs $75k-100k, 1.0% for AGIs $100k-200k)
Net capital gain/loss in AGI: +$1,822 (reported on 3.8% of returns)
Here:
+$1,822
State:
+$12,740
(% of AGI for various income ranges: 0.3% for AGIs $50k-75k, 1.5% for AGIs $100k-200k)
Profit/loss from business: +$7,018 (reported on 10.2% of returns)
Here:
+$7,018
State:
+$10,311
(% of AGI for various income ranges: 6.1% for AGIs below $25k, 0.8% for AGIs $25k-50k, 1.5% for AGIs $50k-75k, 2.7% for AGIs $75k-100k)
Taxable individual retirement arrangement distribution: $7,290 (reported on 4.4% of returns)
28333:
$7,290
North Carolina:
$15,575
(% of AGI for various income ranges: 1.1% for AGIs below $25k, 0.7% for AGIs $25k-50k, 1.1% for AGIs $50k-75k, 3.0% for AGIs $75k-100k)
Total itemized deductions: $17,192 (28% of AGI, reported on 12.7% of returns)
Here:
$17,192
State:
$23,438
Here:
28.4% of AGI
State:
21.5% of AGI
(% of AGI for various income ranges: 2.9% for AGIs below $25k, 6.0% for AGIs $25k-50k, 9.5% for AGIs $50k-75k, 11.0% for AGIs $75k-100k, 13.2% for AGIs $100k-200k)
Charity contributions: $4,573 (reported on 10.8% of returns)
Here:
$4,573
State:
$4,687
(% of AGI for various income ranges: 0.4% for AGIs below $25k, 1.0% for AGIs $25k-50k, 2.3% for AGIs $50k-75k, 3.0% for AGIs $75k-100k, 4.0% for AGIs $100k-200k)
Taxes paid: $4,182 (reported on 12.7% of returns)
28333:
$4,182
State:
$8,823
(% of AGI for various income ranges: 0.5% for AGIs below $25k, 1.1% for AGIs $25k-50k, 2.2% for AGIs $50k-75k, 3.5% for AGIs $75k-100k, 4.6% for AGIs $100k-200k)
Earned income credit: $2,628 (reported on 33.1% of returns)
Here:
$2,628
State:
$2,376
(% of AGI for various income ranges: 9.3% for AGIs below $25k, 1.7% for AGIs $25k-50k)
Percentage of individuals using paid preparers for their 2012 taxes: 50.0%
Here:
50%
State:
53%
(% for various income ranges: 48.2% for AGIs below $25k, 50.6% for AGIs $25k-50k, 50.0% for AGIs $50k-75k, 58.8% for AGIs $75k-100k, 70.0% for AGIs $100k-200k)
Averages for the 2004 tax year for zip code 28333, filed in 2005:
Average Adjusted Gross Income (AGI) in 2004: $26,906 (Individual Income Tax Returns)
Here:
$26,906
State:
$45,376
Salary/wage: $25,020 (reported on 90.6% of returns)
Here:
$25,020
State:
$39,442
(% of AGI for various income ranges: 113.1% for AGIs below $10k, 85.8% for AGIs $10k-25k, 87.1% for AGIs $25k-50k, 83.2% for AGIs $50k-75k, 77.2% for AGIs $75k-100k, 58.0% for AGIs over 100k)
Taxable interest for individuals: $709 (reported on 20.2% of returns)
This zip code:
$709
North Carolina:
$1,515
(% of AGI for various income ranges: 1.4% for AGIs below $10k, 0.5% for AGIs $10k-25k, 0.5% for AGIs $25k-50k, 0.4% for AGIs $50k-75k, 0.3% for AGIs $75k-100k, 1.2% for AGIs over 100k)
Taxable dividends: $1,127 (reported on 5.7% of returns)
Here:
$1,127
State:
$4,016
(% of AGI for various income ranges: 0.2% for AGIs below $10k, 0.2% for AGIs $10k-25k, 0.2% for AGIs $25k-50k, 0.2% for AGIs $50k-75k, 0.4% for AGIs $75k-100k, 1.1% for AGIs over 100k)
Net capital gain/loss: +$3,184 (reported on 4.0% of returns)
Here:
+$3,184
State:
+$11,152
(% of AGI for various income ranges: 0.1% for AGIs below $10k, -0.0% for AGIs $10k-25k, 0.3% for AGIs $25k-50k, 0.2% for AGIs $50k-75k, 0.7% for AGIs $75k-100k, 4.4% for AGIs over 100k)
Profit/loss from business: +$5,014 (reported on 9.6% of returns)
Here:
+$5,014
State:
+$9,490
(% of AGI for various income ranges: 2.8% for AGIs below $10k, 3.1% for AGIs $10k-25k, 0.9% for AGIs $25k-50k, 1.2% for AGIs $50k-75k, 3.8% for AGIs $75k-100k)
IRA payment deduction: $2,434 (reported on 1.2% of returns)
28333:
$2,434
North Carolina:
$2,967
Total itemized deductions: $15,094 (29% of AGI, reported on 18.4% of returns)
Here:
$15,094
State:
$19,464
Here:
29.3% of AGI
State:
22.7% of AGI
(% of AGI for various income ranges: 3.4% for AGIs below $10k, 4.3% for AGIs $10k-25k, 11.6% for AGIs $25k-50k, 12.9% for AGIs $50k-75k, 15.4% for AGIs $75k-100k, 14.5% for AGIs over 100k)
Charity contributions deductions: $3,396 (6% of AGI, reported on 16.4% of returns)
Here:
$3,396
State:
$4,035
Here:
6.4% of AGI
State:
4.5% of AGI
(% of AGI for various income ranges: 0.4% for AGIs below $10k, 0.8% for AGIs $10k-25k, 1.9% for AGIs $25k-50k, 2.8% for AGIs $50k-75k, 3.5% for AGIs $75k-100k, 4.7% for AGIs over 100k)
Total tax: $2,775 (reported on 59.7% of returns)
28333:
$2,775
State:
$7,257
(% of AGI for various income ranges: 2.0% for AGIs below $10k, 2.5% for AGIs $10k-25k, 5.4% for AGIs $25k-50k, 8.1% for AGIs $50k-75k, 10.5% for AGIs $75k-100k, 15.2% for AGIs over 100k)
Earned income credit: $2,039 (reported on 35.4% of returns)
Here:
$2,039
State:
$1,851
Percentage of individuals using paid preparers for their 2004 taxes: 64.0%
Here:
64%
State:
62%
(% for various income ranges: 59.6% for AGIs below $10k, 69.1% for AGIs $10k-25k, 62.2% for AGIs $25k-50k, 58.5% for AGIs $50k-75k, 59.3% for AGIs $75k-100k, 71.2% for AGIs over 100k)
Likely homosexual households (counted as self-reported same-sex unmarried-partner households)
Lesbian couples: 0.0% of all households
Gay men: 0.7% of all households
Household received Food Stamps/SNAP in the past 12 months: 1,306 Household did not receive Food Stamps/SNAP in the past 12 months: 2,523
Women who had a birth in the past 12 months: 136 (36 now married, 95 unmarried) Women who did not have a birth in the past 12 months: 2,259 (971 now married, 1,287 unmarried)
Housing units in zip code 28333 with a mortgage: 1,228 (35 second mortgage, 4 home equity loan, 18 both second mortgage and home equity loan) Houses without a mortgage: 26
Median monthly owner costs for units with a mortgage: $1,043 Median monthly owner costs for units without a mortgage: $352
Residents with income below the poverty level in 2022:
This zip code:
29.8%
Whole state:
12.8%
Residents with income below 50% of the poverty level in 2022:
This zip code:
17.7%
Whole state:
6.8%
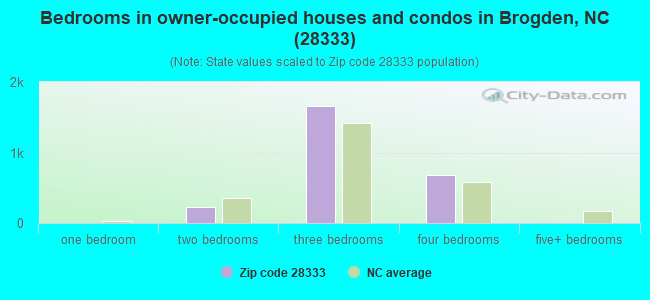
Median number of rooms in houses and condos:
Here:
5.9
State:
6.4
Median number of rooms in apartments:
Here:
5.1
State:
4.4
Notable locations in this zip code not listed on our city pages
Churches in zip code 28333 include: Holly Green Church (A), Johnson Chapel (B), Augusta Church (C), Mays Chapel (D), Brogden Chapel (E), Woodland Friends Church (F), Old Smoky Church (G), Peace Church (H), Dudley Church (I). Display/hide their locations on the map
Streams, rivers, and creeks: Edwards Branch (A), Carraway Creek (B), Cabin Branch (C), Burnt Mill Branch (D), Yellow Marsh Branch (E), Tommy Reed Creek (F), Sleepy Creek (G), Poplar Branch (H), Pine Level Branch (I). Display/hide their locations on the map
In group quarters: 8 (-1 institutionalized population)
Size of family households: 918 2-persons, 725 3-persons, 340 4-persons, 310 5-persons, 96 6-persons, 105 7-or-more-persons
Size of nonfamily households: 1,114 1-person, 132 2-persons, 11 3-persons
975 married couples with children.
1,486 single-parent households (209 men, 1,277 women).
67.3% of residents of 28333 zip code speak English at home.
31.3% of residents speak Spanish at home (51% very well, 16% well, 28% not well, 5% not at all).
0.9% of residents speak other Indo-European language at home (78% very well, 22% well).
0.1% of residents speak Asian or Pacific Island language at home (100% very well).
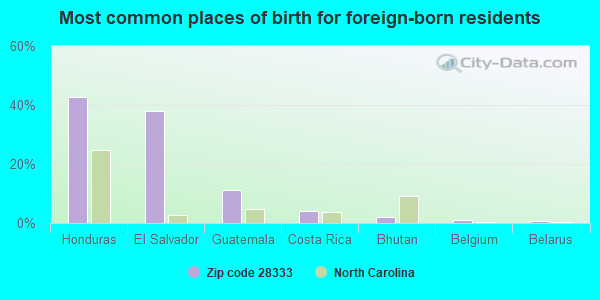
Foreign born population: 1,762 (17.3%) (14.8% of them are naturalized citizens)
This zip code:
17.3%
Whole state:
8.6%
43%Honduras
38%El Salvador
11%Guatemala
4%Costa Rica
2%Bhutan
1%Belgium
1%Belarus
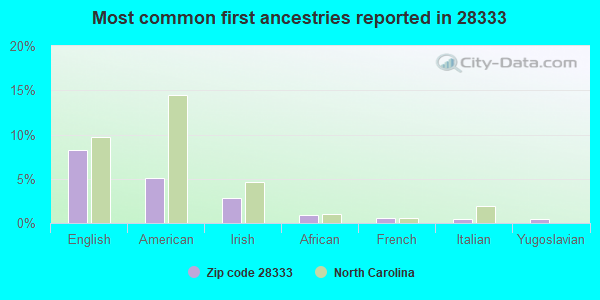
8%English
5%American
3%Irish
1%African
1%French
0%Italian
0%Yugoslavian
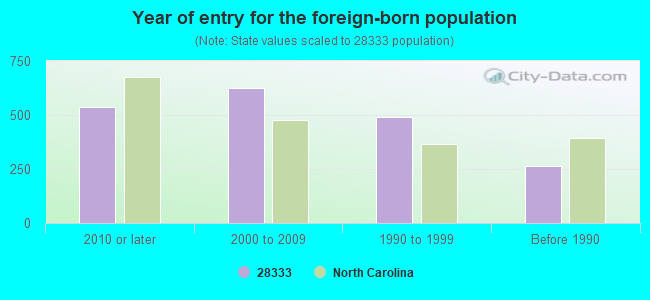
Year of entry for the foreign-born population
5372010 or later
6262000 to 2009
4911990 to 1999
264Before 1990
Public high school in in zip code 28333 not listed on the city page:
Public elementary/middle schools in in zip code 28333 not listed on the city page:
BROGDEN MIDDLE(Location: 3761 US 117 S ALT, Grades: 5-8)
BROGDEN PRIMARY(Location: 2253 OLD MT OLIVE HWY, Grades: PK-4)
Facilities with environmental interests located in this zip code:
BUILDING MATERIALS MFG. CORP. (430 OLD MOUNT OLIVE HWY. in DUDLEY, NC)
AIR SYNTHETIC MINOR (AIRS/AFS) STATE MASTER (North Carolina facility info) - AIR PROGRAM CRITERIA AND HAZARDOUS AIR POLLUTANT INVENTORY (Inventory of air pollution sources) National Pollutant Discharge Elimination System NON-MAJOR (Tracking pollutant discharge elimination systems) - permit Conditionally Exempt Small Quantity Generators, less than 100 kg/month of hazardous waste (Resource Conservation and Recovery Act (tracking hazardous waste)) - notification TRI REPORTER (Tracking of toxic chemicals releasing facilities) Business SIC classification: CONSTRUCTION SAND AND GRAVEL; ASPHALT FELTS AND COATINGS Business NAICS classification: ALL OTHER MISCELLANEOUS MANUFACTURING.; ALL OTHER MISCELLANEOUS MANUFACTURING. Organizations: BMCA GOLDSBORO INC (CONTACT/OWNER)
Alternative names: BMCA GOLDSBORO INC, GAF MATERIALS CORPORATION
CASE FARMS-PROCESSING PLANT (330 PECAN ROAD in DUDLEY, NC)
STATE MASTER (North Carolina facility info) - -115DA4YG00NJAW84AY3V85KEMH, WASTEWATER FACILITY National Pollutant Discharge Elimination System NON-MAJOR (Tracking pollutant discharge elimination systems) - permit TRI REPORTER (Tracking of toxic chemicals releasing facilities) Business SIC classification: POULTRY SLAUGHTERING AND PROCESSING Alternative names: WAMPLER LONGACRE PROCESSING FACILITY
BROGDEN JUNIOR HIGH SCHOOL (3761 US 117 S ALT in DUDLEY, NC)
(Geographic Names Information System) (National Center for Education Statistics) - STATE ID-312 Organizations: WAYNE COUNTY PUBLIC SCHOOLS (SCHOOL DISTRICT)
Alternative names: BROGDEN MIDDLE
BROGDEN PRIMARY (2253 OLD MT OLIVE HWY in DUDLEY, NC)
(National Center for Education Statistics) - STATE ID-314 Organizations: WAYNE COUNTY PUBLIC SCHOOLS (SCHOOL DISTRICT)
CELOTEX CORPORATION (430 OLD MT.OLIVE RD. in DUDLEY, NC)
TRI REPORTER (Tracking of toxic chemicals releasing facilities) Business SIC classification: ASPHALT FELTS AND COATINGS
Housing units lacking complete plumbing facilities: 2.2% Housing units lacking complete kitchen facilities: 3.1%
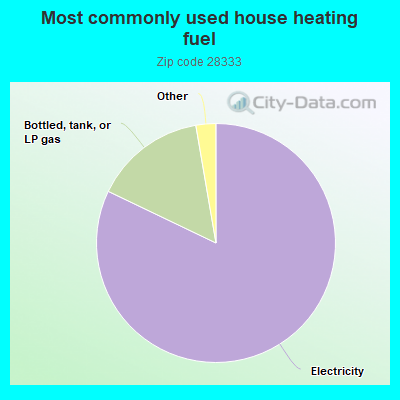
82.2%Electricity
15.2%Bottled, tank, or LP gas
1.0%Utility gas
0.9%No fuel used
0.8%Fuel oil, kerosene, etc.
Population in 1990: 8,450. Population change in the 1990s: +3,093 (+36.6%).
Place of birth for U.S.-born residents:
This state: 6,310
Northeast: 674
Midwest: 205
South: 938
West: 86
53% of the 28333 zip code residents lived in the same house 5 years ago. Out of people who lived in different houses, 68% lived in this county. Out of people who lived in different counties, 50% lived in North Carolina.
94% of the 28333 zip code residents lived in the same house 1 year ago. Out of people who lived in different houses, 59% moved from this county. Out of people who lived in different houses, 8% moved from different county within same state. Out of people who lived in different houses, 31% moved from different state. Out of people who lived in different houses, 5% moved from abroad.
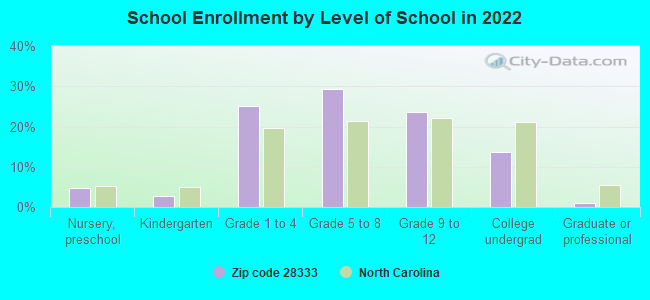
Private vs. public school enrollment:
Students in private schools in grades 1 to 8 (elementary and middle school): 39
Here:
2.8%
North Carolina:
13.8%
Students in private schools in grades 9 to 12 (high school):
Here:
0.0%
North Carolina:
11.9%
Students in private undergraduate colleges: 83
Here:
22.9%
North Carolina:
19.3%
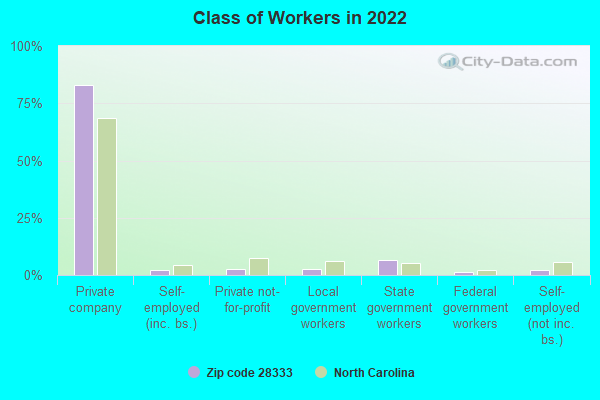
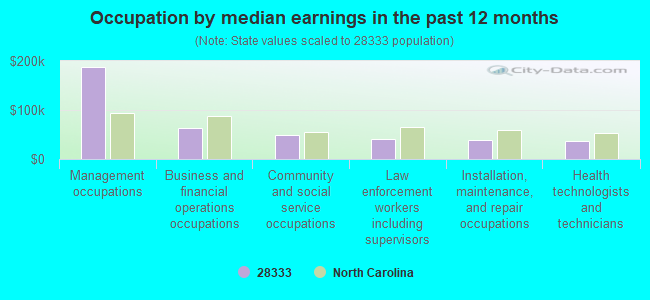
Occupation by median earnings in the past 12 months ($)
188,693Management occupations
62,899Business and financial operations occupations
48,543Community and social service occupations
40,001Law enforcement workers including supervisors
38,906Installation, maintenance, and repair occupations
36,470Health technologists and technicians
Companies with federal contracts located in this zip code:
EAGLES CLEANING AND FOOD SERVI (3433HIGHWAY 117 SOUTH ALTE in DUDLEY, NC; small business) : $1,743,415 in 21 contractsfrom 2000 to 2003
Contracts for Food Services by Air Force Signed by year:2000: $0; 2001: $898,245; 2002: $956,047; 2003: -$110,877; 2004: $0; 2005: $0; 2006: $0.
Biggest contracts:
$280,730 with Air Force for Food Services. Signed on 2001-05-17. Completion date: 2001-09-30.
$186,900 with Air Force for Food Services. Taking place in SC. Signed on 2001-12-31. Completion date: 2002-03-30.
$184,564, same as above.Signed on 2002-03-11. Completion date: 2002-06-30.
$178,811, same as above.Signed on 2001-10-01. Completion date: 2002-09-30.
RECYCLED MATERIALS INCORPORATE (538 OLD MOUNT OLIVE HWY in DUDLEY, NC; small business) : $39,784 in 4 contractsfrom 2003 to 2005
$19,998 with Air Force for Other Housekeeping Services. Signed on 2004-10-01. Completion date: 2005-09-30.
$19,998, same as above.Signed on 2003-12-09. Completion date: 2004-09-30.
$19,786, same as above.Signed on 2005-10-01. Completion date: 2006-09-30.
-$19,998, same as above.Signed on 2005-07-07. Completion date: 2005-09-20.
MECHANICAL & ENVIRONMENTAL CON (108 CEDAR STREET in DUDLEY, NC; small business)
$0 with Army for Chemicals. Signed on 2003-06-26. Completion date: 2004-04-15.
Top industries in this zip code by the number of employees in 2005:
Health Care and Social Assistance: Child Day Care Services (20-49 employees: 1 establishment, 10-19 employees: 1 establishment)
Construction: Plumbing, Heating, and Air-Conditioning Contractors (20-49: 1, 1-4: 1)
Professional, Scientific, and Technical Services: Offices of Certified Public Accountants (20-49: 1)
Health Care and Social Assistance: Residential Mental Health and Substance Abuse Facilities (20-49: 1)
Health Care and Social Assistance: Home Health Care Services (20-49: 1)
Utilities: Electric Power Distribution (20-49: 1)
People in group quarters in 2010:
7 people in group homes intended for adults
4 people in residential treatment centers for adults
People in group quarters in 2000:
7 people in nursing homes
6 people in homes for the mentally ill
Fatal accident statistics in 2013:
Fatal accident count: 2
Vehicles involved in fatal accidents: 3
Fatal accidents caused by drunken drivers: 1
Fatalities: 2
Persons involved in fatal accidents: 6
Pedestrians involved in fatal accidents: 0
Fatal accident statistics in 2012:
Fatal accident count: 2
Vehicles involved in fatal accidents: 2
Fatal accidents caused by drunken drivers: 0
Fatalities: 2
Persons involved in fatal accidents: 2
Pedestrians involved in fatal accidents: 1
Home Mortgage Disclosure Act Aggregated Statistics For Year 2009 (Based on 2 full and 4 partial tracts)
A) FHA, FSA/RHS & VA Home Purchase Loans
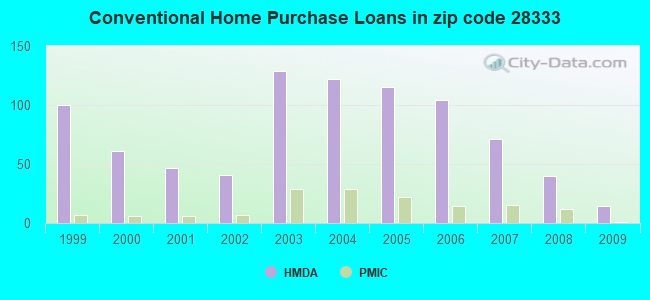
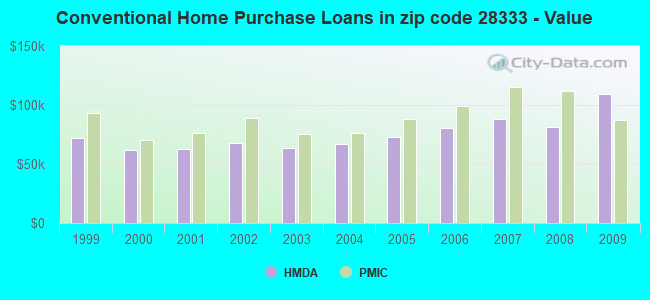
B) Conventional Home Purchase Loans
C) Refinancings
D) Home Improvement Loans
E) Loans on Dwellings For 5+ Families
F) Non-occupant Loans on < 5 Family Dwellings (A B C & D)
G) Loans On Manufactured Home Dwelling (A B C & D)
Number
Average Value
Number
Average Value
Number
Average Value
Number
Average Value
Number
Average Value
Number
Average Value
Number
Average Value
LOANS ORIGINATED
57
$111,445
14
$109,339
141
$103,238
12
$61,639
1
$79,010
21
$67,902
31
$73,228
APPLICATIONS APPROVED, NOT ACCEPTED
1
$27,260
3
$65,493
16
$71,591
2
$29,210
0
$0
1
$41,170
8
$53,678
APPLICATIONS DENIED
2
$55,085
26
$63,257
87
$92,829
21
$34,925
0
$0
5
$46,098
43
$63,000
APPLICATIONS WITHDRAWN
6
$93,638
3
$103,610
28
$108,760
3
$36,653
0
$0
2
$60,830
4
$68,910
FILES CLOSED FOR INCOMPLETENESS
1
$39,360
0
$0
8
$86,910
0
$0
0
$0
0
$0
1
$53,290
Aggregated Statistics For Year 2008 (Based on 2 full and 4 partial tracts)
A) FHA, FSA/RHS & VA Home Purchase Loans
B) Conventional Home Purchase Loans
C) Refinancings
D) Home Improvement Loans
F) Non-occupant Loans on < 5 Family Dwellings (A B C & D)
G) Loans On Manufactured Home Dwelling (A B C & D)
Number
Average Value
Number
Average Value
Number
Average Value
Number
Average Value
Number
Average Value
Number
Average Value
LOANS ORIGINATED
73
$104,734
40
$81,724
124
$96,748
41
$47,161
21
$94,227
53
$74,109
APPLICATIONS APPROVED, NOT ACCEPTED
4
$61,308
8
$58,278
32
$79,878
7
$15,199
1
$31,710
8
$49,659
APPLICATIONS DENIED
7
$88,699
28
$64,884
105
$82,909
92
$56,357
5
$75,270
59
$57,413
APPLICATIONS WITHDRAWN
6
$104,323
4
$64,848
40
$87,866
12
$70,558
5
$70,784
10
$67,638
FILES CLOSED FOR INCOMPLETENESS
2
$110,165
1
$55,640
6
$71,655
2
$8,995
1
$69,040
1
$107,190
Aggregated Statistics For Year 2007 (Based on 2 full and 4 partial tracts)
A) FHA, FSA/RHS & VA Home Purchase Loans
B) Conventional Home Purchase Loans
C) Refinancings
D) Home Improvement Loans
E) Loans on Dwellings For 5+ Families
F) Non-occupant Loans on < 5 Family Dwellings (A B C & D)
G) Loans On Manufactured Home Dwelling (A B C & D)
Number
Average Value
Number
Average Value
Number
Average Value
Number
Average Value
Number
Average Value
Number
Average Value
Number
Average Value
LOANS ORIGINATED
49
$106,156
71
$88,008
162
$72,662
60
$43,262
1
$497,980
30
$70,376
54
$65,225
APPLICATIONS APPROVED, NOT ACCEPTED
3
$107,587
22
$80,637
49
$76,429
14
$15,266
0
$0
6
$73,668
16
$49,179
APPLICATIONS DENIED
3
$90,257
56
$57,423
220
$76,720
86
$42,383
0
$0
14
$51,112
101
$56,956
APPLICATIONS WITHDRAWN
6
$86,415
15
$79,664
60
$77,380
7
$46,300
0
$0
6
$71,578
6
$53,080
FILES CLOSED FOR INCOMPLETENESS
1
$61,200
1
$56,750
11
$109,196
0
$0
0
$0
0
$0
0
$0
Aggregated Statistics For Year 2006 (Based on 2 full and 4 partial tracts)
A) FHA, FSA/RHS & VA Home Purchase Loans
B) Conventional Home Purchase Loans
C) Refinancings
D) Home Improvement Loans
E) Loans on Dwellings For 5+ Families
F) Non-occupant Loans on < 5 Family Dwellings (A B C & D)
G) Loans On Manufactured Home Dwelling (A B C & D)
Number
Average Value
Number
Average Value
Number
Average Value
Number
Average Value
Number
Average Value
Number
Average Value
Number
Average Value
LOANS ORIGINATED
57
$97,050
104
$80,445
220
$71,449
47
$42,381
1
$61,760
49
$56,882
69
$60,959
APPLICATIONS APPROVED, NOT ACCEPTED
1
$92,250
19
$60,611
35
$71,827
17
$30,763
0
$0
11
$81,861
20
$65,152
APPLICATIONS DENIED
13
$72,593
91
$50,608
237
$71,779
73
$42,022
1
$60,090
20
$47,536
106
$53,284
APPLICATIONS WITHDRAWN
5
$67,252
19
$78,797
84
$76,336
5
$45,264
0
$0
1
$40,620
7
$49,107
FILES CLOSED FOR INCOMPLETENESS
1
$57,310
10
$69,968
21
$93,321
1
$27,820
0
$0
2
$70,500
0
$0
Aggregated Statistics For Year 2005 (Based on 2 full and 4 partial tracts)
A) FHA, FSA/RHS & VA Home Purchase Loans
B) Conventional Home Purchase Loans
C) Refinancings
D) Home Improvement Loans
F) Non-occupant Loans on < 5 Family Dwellings (A B C & D)
G) Loans On Manufactured Home Dwelling (A B C & D)
Number
Average Value
Number
Average Value
Number
Average Value
Number
Average Value
Number
Average Value
Number
Average Value
LOANS ORIGINATED
48
$103,542
115
$73,215
212
$69,327
50
$35,387
55
$66,870
71
$53,470
APPLICATIONS APPROVED, NOT ACCEPTED
11
$107,734
31
$69,736
66
$69,856
4
$22,740
3
$64,743
25
$58,225
APPLICATIONS DENIED
5
$78,216
96
$61,328
339
$73,329
82
$46,144
20
$41,592
138
$55,171
APPLICATIONS WITHDRAWN
7
$76,014
45
$84,981
88
$88,080
26
$92,696
6
$58,647
28
$69,186
FILES CLOSED FOR INCOMPLETENESS
0
$0
0
$0
39
$85,691
0
$0
2
$59,965
11
$69,455
Aggregated Statistics For Year 2004 (Based on 2 full and 4 partial tracts)
A) FHA, FSA/RHS & VA Home Purchase Loans
B) Conventional Home Purchase Loans
C) Refinancings
D) Home Improvement Loans
E) Loans on Dwellings For 5+ Families
F) Non-occupant Loans on < 5 Family Dwellings (A B C & D)
G) Loans On Manufactured Home Dwelling (A B C & D)
Number
Average Value
Number
Average Value
Number
Average Value
Number
Average Value
Number
Average Value
Number
Average Value
Number
Average Value
LOANS ORIGINATED
47
$88,719
122
$66,722
276
$69,913
44
$19,071
1
$7,382,320
59
$50,659
79
$56,787
APPLICATIONS APPROVED, NOT ACCEPTED
1
$58,740
38
$64,303
58
$58,961
13
$18,474
0
$0
10
$67,176
27
$55,219
APPLICATIONS DENIED
5
$88,168
112
$49,770
305
$74,065
66
$29,507
0
$0
24
$47,660
168
$54,325
APPLICATIONS WITHDRAWN
2
$72,375
17
$56,431
119
$77,553
9
$32,901
0
$0
5
$56,526
20
$58,620
FILES CLOSED FOR INCOMPLETENESS
1
$38,760
1
$41,730
12
$100,417
1
$13,910
0
$0
0
$0
1
$78,450
Aggregated Statistics For Year 2003 (Based on 2 full and 4 partial tracts)
A) FHA, FSA/RHS & VA Home Purchase Loans
B) Conventional Home Purchase Loans
C) Refinancings
D) Home Improvement Loans
F) Non-occupant Loans on < 5 Family Dwellings (A B C & D)
Number
Average Value
Number
Average Value
Number
Average Value
Number
Average Value
Number
Average Value
LOANS ORIGINATED
59
$81,500
129
$63,249
383
$74,924
34
$15,367
42
$63,952
APPLICATIONS APPROVED, NOT ACCEPTED
0
$0
40
$53,926
75
$63,958
12
$16,121
7
$48,930
APPLICATIONS DENIED
14
$67,384
134
$47,241
226
$71,259
41
$23,528
15
$48,121
APPLICATIONS WITHDRAWN
3
$95,220
18
$65,870
93
$75,231
14
$26,609
6
$42,692
FILES CLOSED FOR INCOMPLETENESS
0
$0
5
$101,676
13
$73,893
0
$0
0
$0
Aggregated Statistics For Year 2002 (Based on 2 partial tracts)
A) FHA, FSA/RHS & VA Home Purchase Loans
B) Conventional Home Purchase Loans
C) Refinancings
D) Home Improvement Loans
F) Non-occupant Loans on < 5 Family Dwellings (A B C & D)
Number
Average Value
Number
Average Value
Number
Average Value
Number
Average Value
Number
Average Value
LOANS ORIGINATED
15
$93,587
41
$67,867
78
$79,023
8
$12,589
9
$49,706
APPLICATIONS APPROVED, NOT ACCEPTED
1
$37,840
13
$52,687
17
$64,968
1
$2,780
2
$62,315
APPLICATIONS DENIED
1
$55,080
40
$49,881
55
$71,907
12
$19,149
1
$63,430
APPLICATIONS WITHDRAWN
1
$47,290
4
$79,982
21
$84,811
3
$37,650
0
$0
FILES CLOSED FOR INCOMPLETENESS
1
$66,770
0
$0
7
$105,874
0
$0
0
$0
Aggregated Statistics For Year 2001 (Based on 2 partial tracts)
A) FHA, FSA/RHS & VA Home Purchase Loans
B) Conventional Home Purchase Loans
C) Refinancings
D) Home Improvement Loans
F) Non-occupant Loans on < 5 Family Dwellings (A B C & D)
Number
Average Value
Number
Average Value
Number
Average Value
Number
Average Value
Number
Average Value
LOANS ORIGINATED
20
$84,100
47
$62,589
96
$80,452
14
$17,209
8
$55,292
APPLICATIONS APPROVED, NOT ACCEPTED
0
$0
13
$45,967
17
$77,143
0
$0
1
$21,140
APPLICATIONS DENIED
1
$23,930
43
$48,057
50
$70,629
6
$19,382
4
$55,082
APPLICATIONS WITHDRAWN
2
$99,040
3
$77,153
33
$70,511
3
$16,877
1
$40,060
FILES CLOSED FOR INCOMPLETENESS
1
$40,620
1
$57,870
5
$79,788
0
$0
0
$0
Aggregated Statistics For Year 2000 (Based on 2 partial tracts)
A) FHA, FSA/RHS & VA Home Purchase Loans
B) Conventional Home Purchase Loans
C) Refinancings
D) Home Improvement Loans
F) Non-occupant Loans on < 5 Family Dwellings (A B C & D)
Number
Average Value
Number
Average Value
Number
Average Value
Number
Average Value
Number
Average Value
LOANS ORIGINATED
12
$89,209
61
$61,760
41
$60,648
4
$22,952
9
$52,549
APPLICATIONS APPROVED, NOT ACCEPTED
1
$47,290
18
$49,334
16
$56,961
1
$1,670
1
$81,790
APPLICATIONS DENIED
4
$34,915
62
$49,071
57
$51,189
7
$26,230
5
$49,074
APPLICATIONS WITHDRAWN
2
$77,620
4
$42,425
24
$58,237
1
$8,900
1
$47,290
FILES CLOSED FOR INCOMPLETENESS
0
$0
2
$57,865
4
$63,152
0
$0
1
$28,930
Aggregated Statistics For Year 1999 (Based on 2 partial tracts)
A) FHA, FSA/RHS & VA Home Purchase Loans
B) Conventional Home Purchase Loans
C) Refinancings
D) Home Improvement Loans
F) Non-occupant Loans on < 5 Family Dwellings (A B C & D)
2002 - 2018 National Fire Incident Reporting System (NFIRS) incidents
According to the data from the years 2002 - 2018 the average number of fires per year is 78. The highest number of reported fires - 159 took place in 2002, and the least - 0 in 2003. The data has a declining trend.
When looking into fire subcategories, the most reports belonged to: Outside Fires (47.5%), and Structure Fires (43.1%).
Fire incident types reported to NFIRS in Zip Code 28333


 Nearest zip codes: 27531, 27530, 28365, 27534, 28325, 28578.


 (Location: 124 WALTER FULCHER RD, Grades: 9-12)
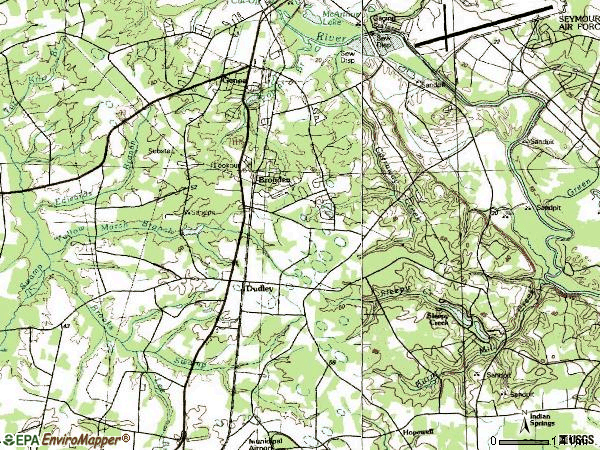


 According to the data from the years 2002 - 2018 the average number of fires per year is 78. The highest number of reported fires - 159 took place in 2002, and the least - 0 in 2003. The data has a declining trend.
 When looking into fire subcategories, the most reports belonged to: Outside Fires (47.5%), and Structure Fires (43.1%).